. 2020 Jun 9:11:1166.
doi: 10.3389/fimmu.2020.01166. eCollection 2020.

Non-sterilizing, Infection-Permissive Vaccination With Inactivated Influenza Virus Vaccine Reshapes Subsequent Virus Infection-Induced Protective Heterosubtypic Immunity From Cellular to Humoral Cross-Reactive Immune Responses

Affiliations

Non-sterilizing, Infection-Permissive Vaccination With Inactivated Influenza Virus Vaccine Reshapes Subsequent Virus Infection-Induced Protective Heterosubtypic Immunity From Cellular to Humoral Cross-Reactive Immune Responses

Angela Choi et al. Front Immunol. .

Abstract

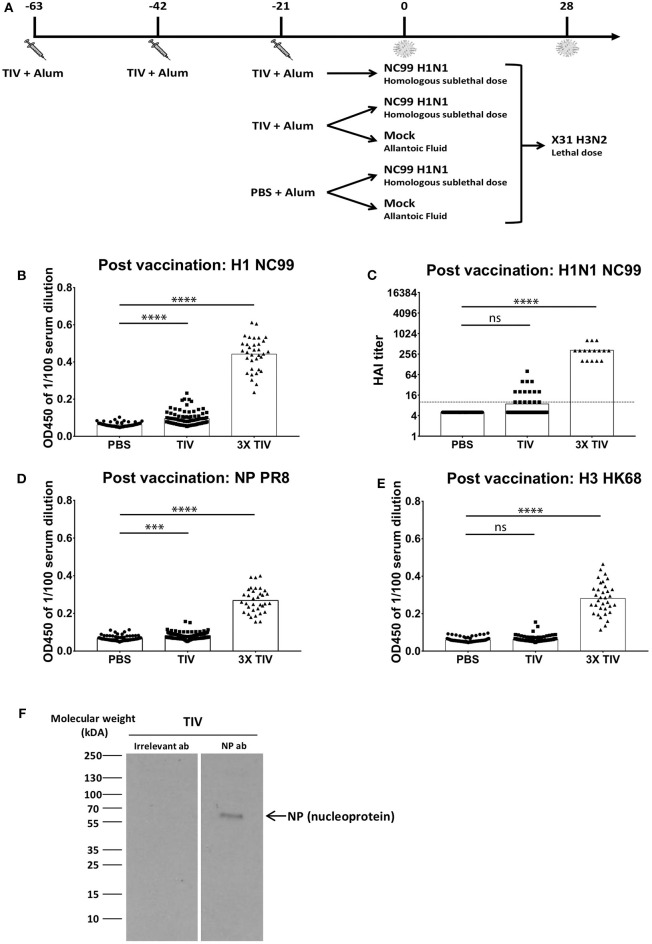
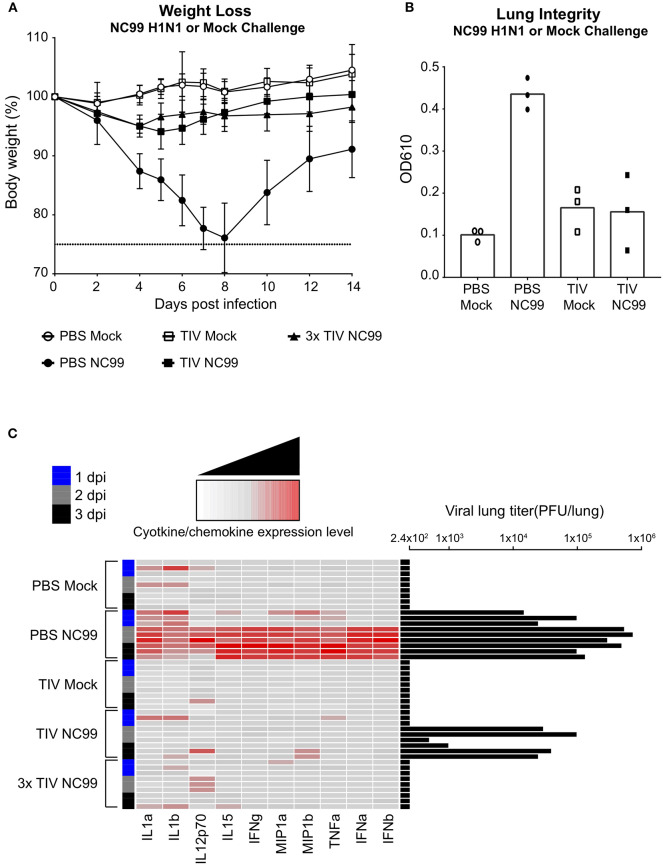
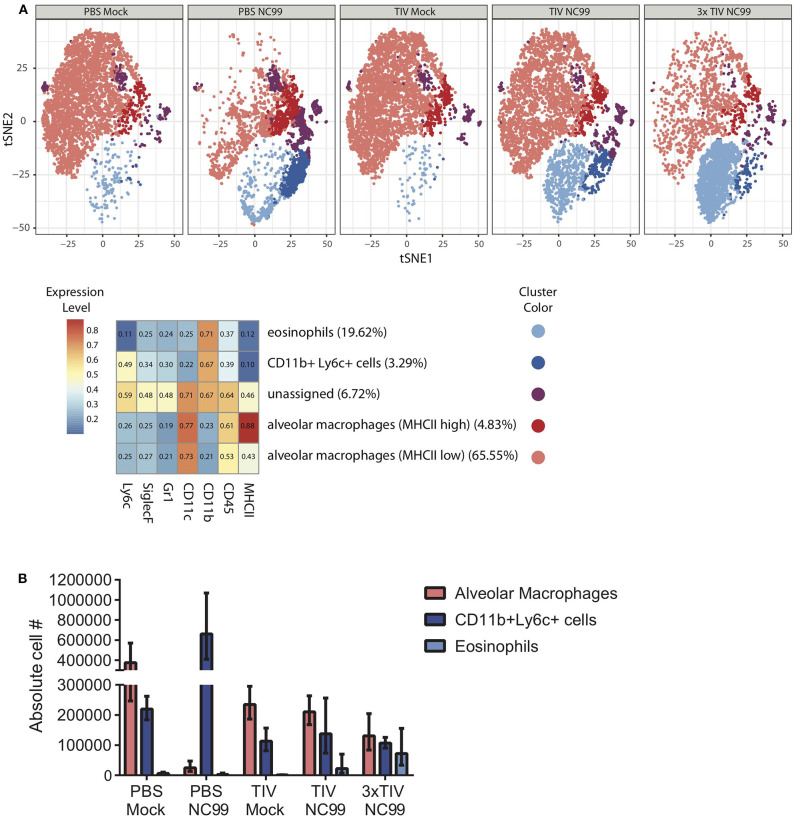
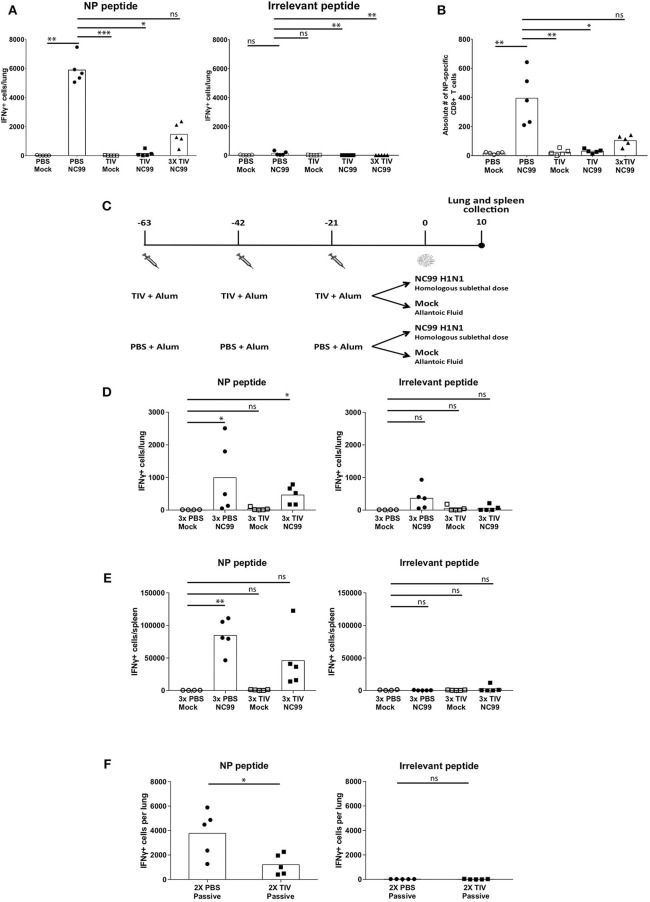
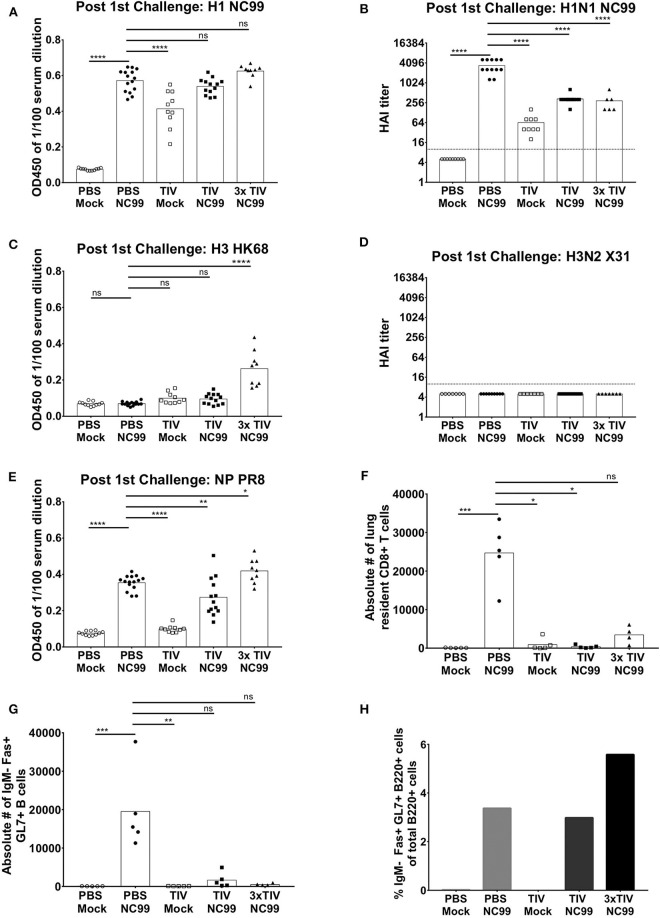
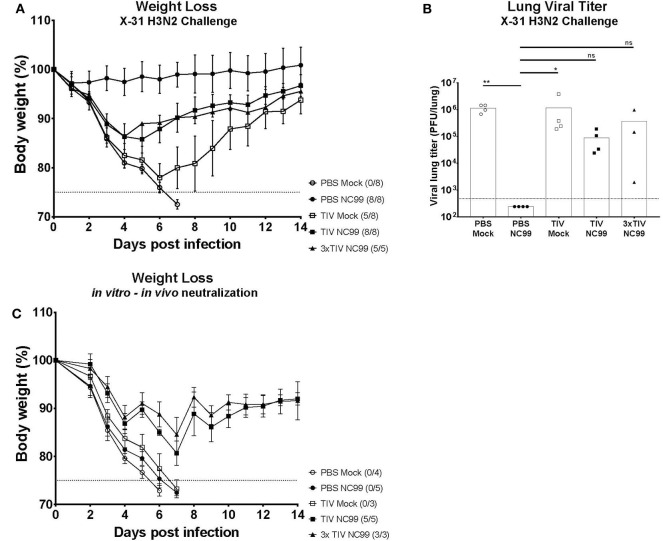
Conventional influenza vaccines aim at the induction of virus-neutralizing antibodies that provide with sterilizing immunity. However, influenza vaccination often confers protection from disease but not from infection. The impact of infection-permissive vaccination on the immune response elicited by subsequent influenza virus infection is not well-understood. Here, we investigated to what extent infection-permissive immunity, in contrast to virus-neutralizing immunity, provided by a trivalent inactivated virus vaccine (TIV) modulates disease and virus-induced host immune responses after sublethal vaccine-matching H1N1 infection in a mouse model. More than one TIV vaccination was needed to induce a serum HI titer and provide sterilizing immunity upon homologous virus infection. However, single TIV administration provided infection-permissive immunity, characterized by lower viral lung titers and faster recovery. Despite the presence of replicating virus, single TIV vaccination prevented induction of pro-inflammatory cyto- and chemokines, alveolar macrophage depletion as well as the establishment of lung-resident B and T cells after infection. To investigate virus infection-induced cross-protective heterosubtypic immune responses in vaccinated and unvaccinated animals, mice were re-infected with a lethal dose of H3N2 virus 4 weeks after H1N1 infection. Single TIV vaccination did not prevent H1N1 virus infection-induced heterosubtypic cross-protection, but shifted the mechanism of cross-protection from the cellular to the humoral branch of the immune system. These results suggest that suboptimal vaccination with conventional influenza vaccines may still positively modulate disease outcome after influenza virus infection, while promoting humoral heterosubtypic immunity after virus infection.

Keywords: TIV; alveolar macrophage; germinal center B cell; heterosubtypic immunity; influenza; pre-existing immunity; tissue-resident memory T cell.


Figures

Figure 1
Figure 1
More than one TIV vaccination is needed to induce virus-specific antibody responses efficiently in naïve mice. (A) Overall study design. BALB/c mice were either vaccinated three times with seasonal TIV, once with TIV, or once with PBS. Each vaccination was adjuvanted with Alum. Three weeks after the last immunization, animals were either challenged with H1N1 NC99 virus or allantoic fluid (mock challenge). Four weeks after the initial challenge, animals were challenged a second time with a lethal dose of X-31 H3N2. (B,D,E) Individual mouse sera were collected 14 days after the last vaccination. Samples were diluted 1/100 for ELISA. Total IgG antibody levels were measured against recombinant full length HAs (H1 NC99 and H3 HK68) and NP PR8. Each symbol represents a single mouse. Bars represent means. (C) Antibodies post vaccination sera were tested against H1N1 NC99 virus for HAI titers. Dotted line represents the limit of detection. Each symbol represents one mouse. Bars represent means. (F) Using NP antibody, presence of NP in TIV was confirmed through western blot. ***p < 0.001, ****p < 0.0001, ns = not significant.
Figure 2
Figure 2
TIV vaccination provides protection against morbidity and inflammation caused by influenza virus infection. (A) Mice were given a homologous H1N1 virus infection or egg allantoic fluid as mock infection. The body weights of mice were recorded for 14 days after challenge. Animals that lost more than 25% body weight (dotted line) were euthanized for humane reasons. Symbols and error bars represent mean ± SD. (B) Lung integrity at 6 days post infection was observed using Evan's Blue Dye. Supernatant from BALF were measured at OD 610 nm. Each symbol represents one mouse. n = 3 mice/group. Bars represent mean. (C) Lung homogenates were prepared at day 1 (blue), 2 (gray), and 3 (black) post-challenge. Cytokine and chemokine expression levels were determined using a luminex cytokine bead array. Each column is a single cytokine/chemokine as indicated at the bottom of the heat map. Each row represents an individual mouse with vaccine and challenge status indicated on the left-hand side of the heat map. Lung viral titers (PFU/lung) were also measured through plaque assay. Titers were plotted as black bars on the right-hand side of the heatmap. n = 3 mice/dpi; n = 9 mice/group.
Figure 3
Figure 3
TIV vaccination affects the immune cell populations in the lung at 7 days post H1N1 virus infection. (A) Unsupervised analysis of immune cell populations was performed. Single cell suspensions from mouse lungs were stained for viability and surface markers. Live, SiglecF+ single cells were pregated to define immune cell populations by clustering cells based on their mean fluorescence intensities for different surface markers. Surface markers that were used are mentioned at the bottom of the heatmap. Z-scored mean fluorescence intensities are given from the respective clusters in the heatmap. Every row represents the surface expression profile for one cluster. Relative abundance of different clusters is given between parentheses after the cluster names. t-SNE plots for the five experimental groups were then generated. Each cluster was given different colors. Every plot represents subsamples of 1,000 cells/mouse with n = 5 mice/group. (B) Absolute cell counts of alveolar macrophages, Ly6c+ monocytes, and eosinophils were also quantified through flow cytometry. Bars represent means ± SD. n = 5 mice/group.
Figure 4
Figure 4
Cellular host immune responses are affected by pre-existing immunity given by vaccination and infection. (A) Lungs were collected to quantify antigen-specific T cells at 10 dpi. The cells isolated from the lungs were stimulated with either NP-derived peptide, TRYQTRALV (NP-specific), or irrelevant peptide. Each symbol represents the number if IFNγ-producing cells measure by ELISpot per mouse. Bars represent means. n = 5 mice/group. (B) NP-specific CD8+ T cells in the lungs were quantified by NP-specific pentamer staining. Each symbol represents counts per mouse. n = 5 mice/group. Bars represent mean. (C) Study design to look at the effect of repeat vaccinations with TIV. Mice were vaccinated three times with TIV or PBS with 3-week intervals. Each vaccination was adjuvanted with Alum. Three weeks after the last vaccination, both groups were challenged with either H1N1 NC99 or allanotic fluid. At day 10, both lungs and spleen were harvested for assessment of antigen specific T cell responses. (D,E) Cells isolated for lungs (D) and spleens (E) were restimulated with either NP-specific peptide or an irrelevant peptide. Individual symbols represent number of IFNγ+ cells/organ from one mouse. Bars represent mean. (F) After passive transfer of sera into naïve mice and challenged with NC99, lungs were collected and restimulated with NP-specific peptide or an irrelevant peptide for control. Each symbol represents a mouse. Bars represent means. *p < 0.05, **p < 0.01, ***p < 0.001, ns = not significant.
Figure 5
Figure 5
Humoral immune responses were boosted after NC99 virus challenge and TIV vaccination prevented the formation of GC B cells and TRM in the lungs after infection. (A,C,E) On day 26 serum were collected from individual mice and diluted 1/100 to perform ELISAs. Total IgG antibody titers against full length H1 NC99, H3 HK68 Has, and NP PR8 were analyzed. (B,D) HAI titers against H1N1 NC99 and H3N2 X31 viruses were also measured. Dotted line represents the limit of detection in the HAI assay. (F) Lung resident CD8+ T cells (CD3+, CD8+, CD44+, CD69+, CD103+ cells) were analyzed from lungs collected about 4 weeks after the first challenge (Day 27). Circulating immune cells were excluded by i.v. CD45 labeling. n = 5 mice/group. (G) Germinal center B cells are a hallmark of iBALT formation. Thus, lungs were harvested on Day 24 and CD3–, IgM–, B220+, Fas+, GL7+ cells were quantified through flow cytometry. n = 5 mice/group. (H) Germinal center B cells were also analyzed in lymph nodes. From the same mice used to harvest lungs, mediastinal lymph nodes were collected and pooled per group. Pooled samples were analyzed by flow cytometry and percentages of GC B cells were plotted. All bars represent means and symbols represent an individual mouse. *p < 0.05, **p < 0.01, ***p < 0.001, ****p < 0.0001, ns = not significant.
Figure 6
Figure 6
Protection against lethal X31 H3N2 virus challenge is observed in mice with pre-existing immunity provided by vaccination and infection. (A) 4 weeks after the first challenge (Day 28), all groups received a second challenge with a lethal dose of X-31 H3N2. The body weighs of mice were monitored for 14 days. Animals that lost more than 25% body weight (dotted line) were euthanized for humane reasons. Each symbol represents the mean body weight per group. Error bars represent SD. The number of mice that died over total number of mice per group is shown next to each symbol. (B) 5 days post X-31 challenge (Day 35), lungs were collected to quantify viral titers. Individual symbol is an individual mouse, bars represent means and dotted line represents the limit of detection (480 PFU/lung). (C) Body weights from each group were monitored for 14 days after in vitro-in vivo neutralization assay was performed. Naïve mice received the same lethal dose of H3N2 X-31 virus after in vitro incubation of virus with different groups of pooled sera for 1 h at 37°C. Each symbol represents the mean body weight of naïve mice that received pooled sera from specific groups. Animals that lost more than 25% body weight (dotted line) were euthanized for humane reasons. The number of mice that died over total number of mice per group is shown next to each group name. *p < 0.05, **p < 0.01, ns = not significant.

References

    1. CDC Influenza (flu) Including Seasonal, Avian, Swine, Pandemic, and Other. Centers for Disease Control and Prevention; (2018). Available online at: https://www.cdc.gov/flu/index.htm (accessed September 24, 2018).
    1. Cox RJ. Correlates of protection to influenza virus, where do we go from here? Hum Vaccines Immunother. (2013) 9:405–8. 10.4161/hv.22908 - DOI - PMC - PubMed
    1. Epstein SL. Prior H1N1 influenza infection and susceptibility of cleveland family study participants during the H2N2 pandemic of 1957: an experiment of nature. J Infect Dis. (2006) 193:49–53. 10.1086/498980 - DOI - PubMed
    1. Epstein SL, Lo CY, Misplon JA, Lawson CM, Hendrickson BA, Max EE, et al. Mechanisms of heterosubtypic immunity to lethal influenza A virus infection in fully immunocompetent, T cell-depleted, beta2-microglobulin-deficient, and J chain-deficient mice. J Immunol Baltim Md. (1997) 158:1222–30. - PubMed
    1. Hillaire MLB, van Trierum SE, Kreijtz JHCM, Bodewes R, Geelhoed-Mieras MM, Nieuwkoop NJ, et al. Cross-protective immunity against influenza pH1N1 2009 viruses induced by seasonal influenza A (H3N2) virus is mediated by virus-specific T-cells. J Gen Virol. (2011) 92:2339–49. 10.1099/vir.0.033076-0 - DOI - PubMed

Publication types

MeSH terms