. 2020 Jun 5:11:663.
doi: 10.3389/fpls.2020.00663. eCollection 2020.

Early Diagnosis and Management of Nitrogen Deficiency in Plants Utilizing Raman Spectroscopy

Affiliations

Early Diagnosis and Management of Nitrogen Deficiency in Plants Utilizing Raman Spectroscopy

Chung Hao Huang et al. Front Plant Sci. .

Abstract

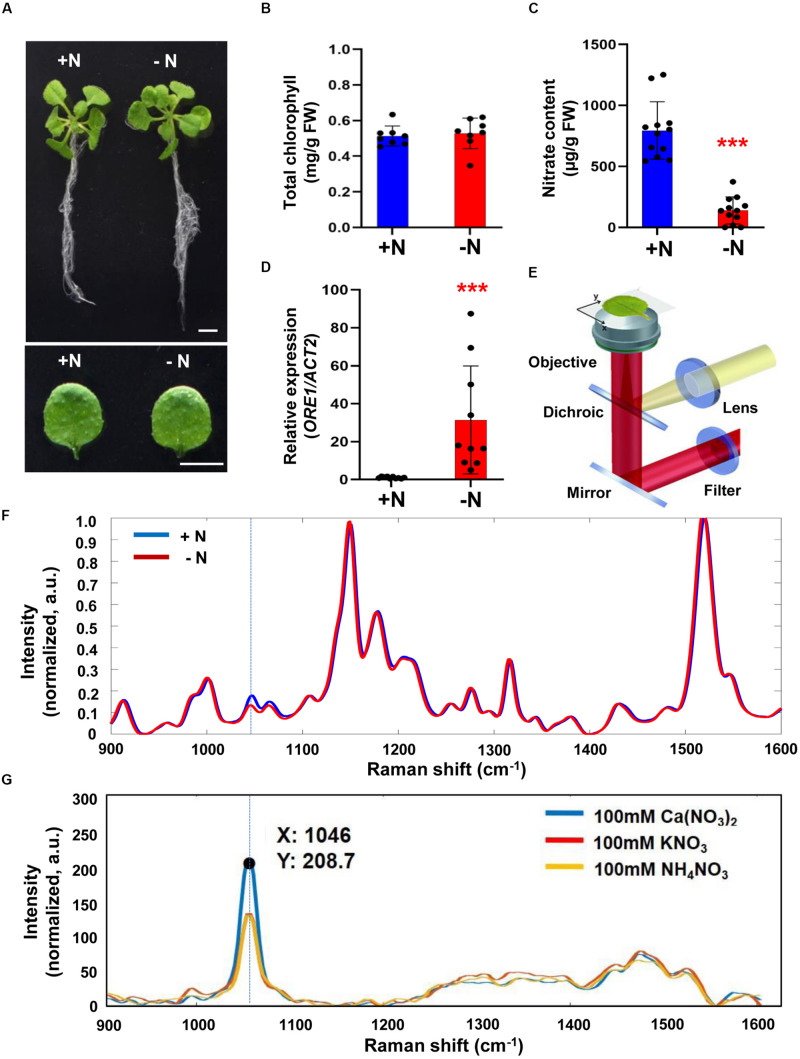
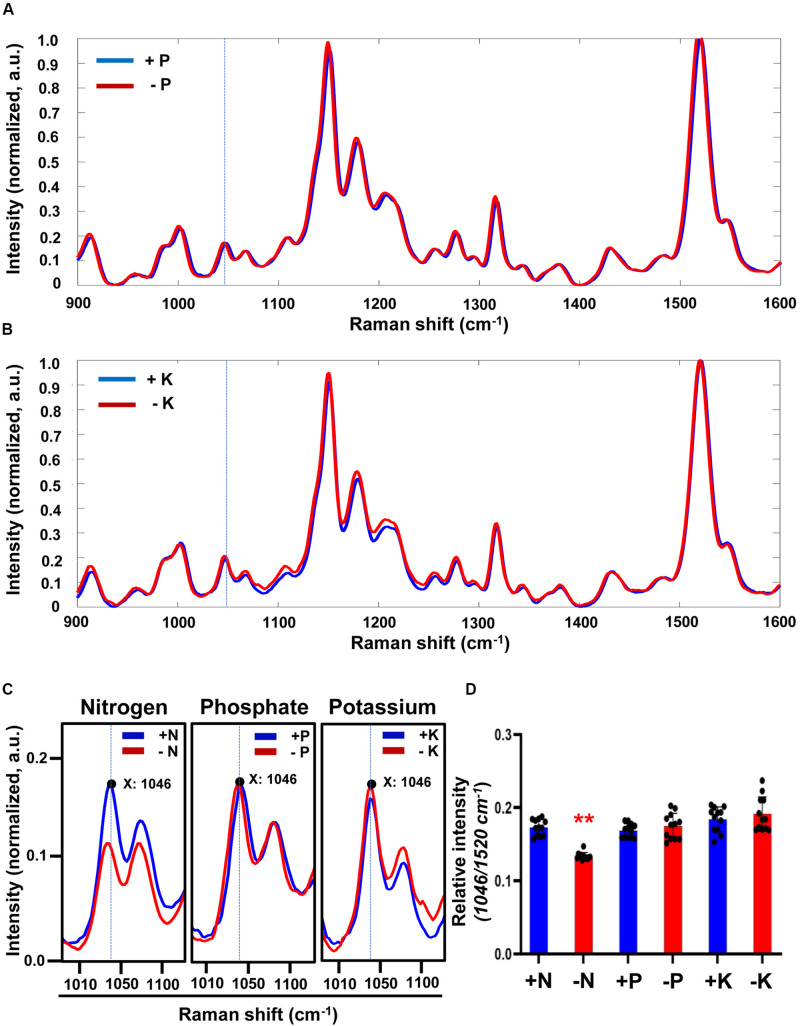
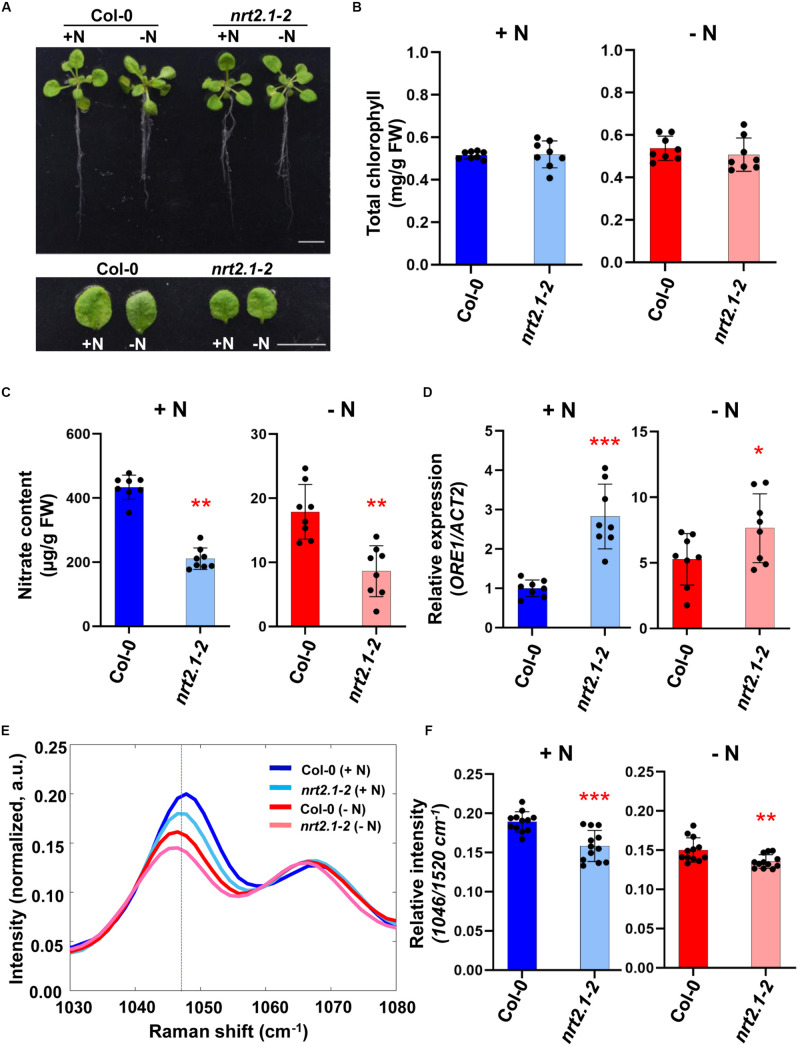
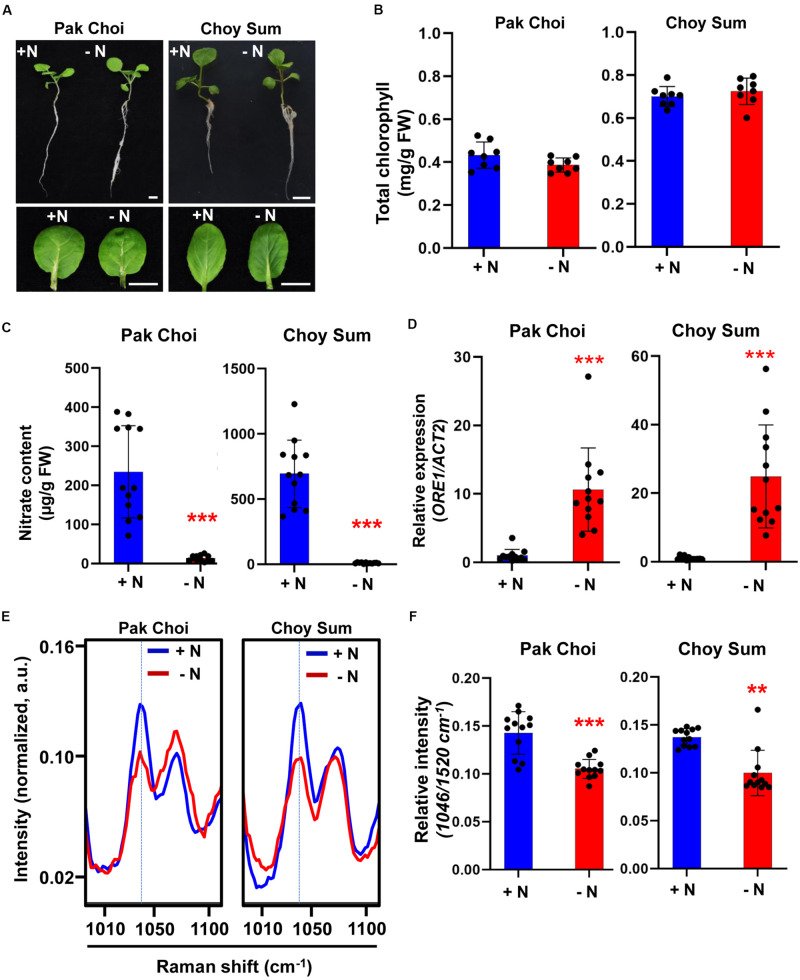
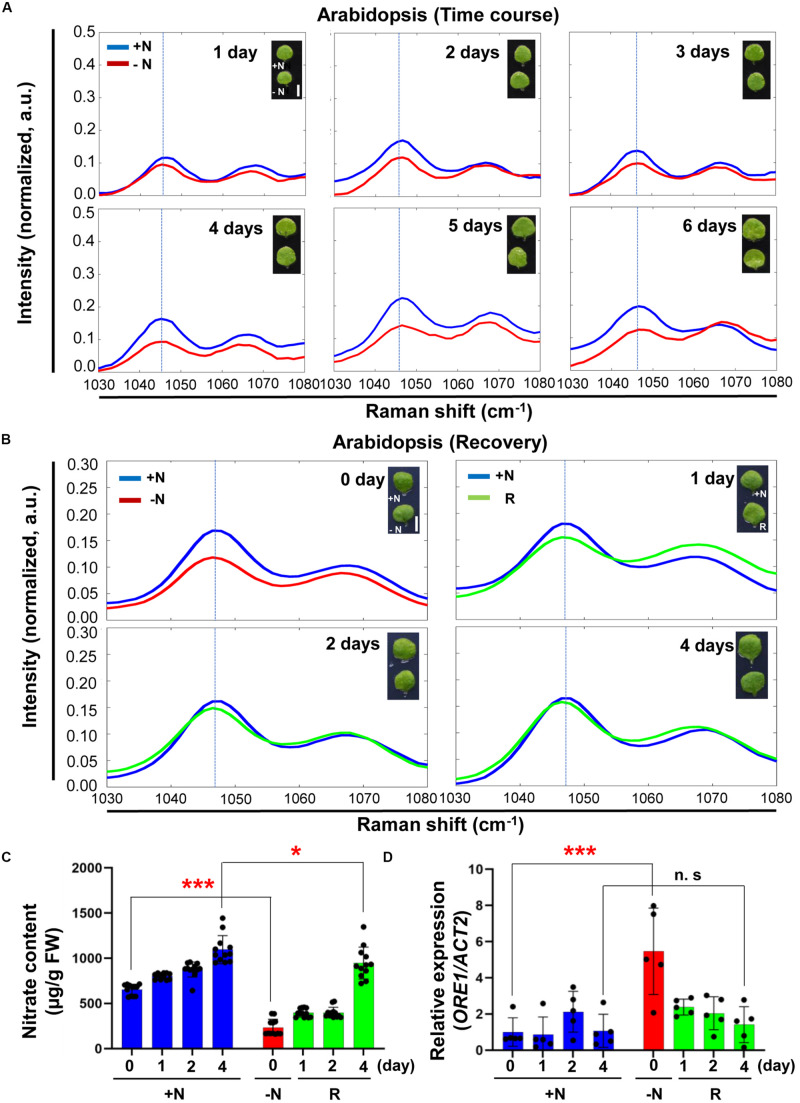
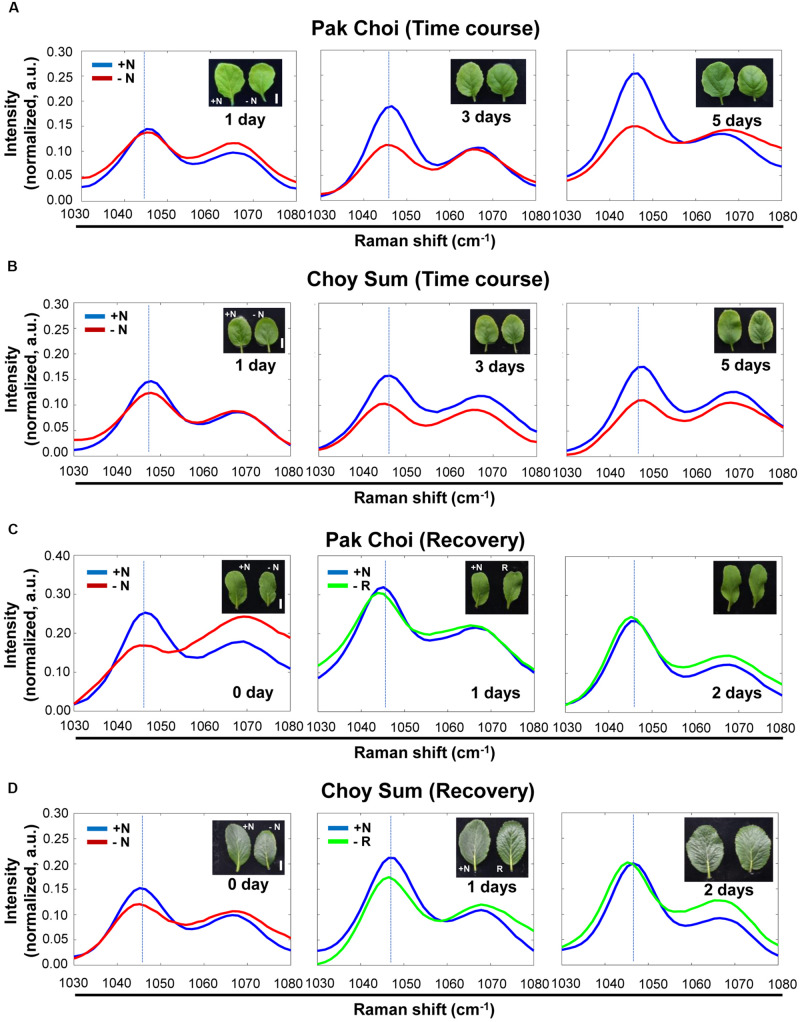
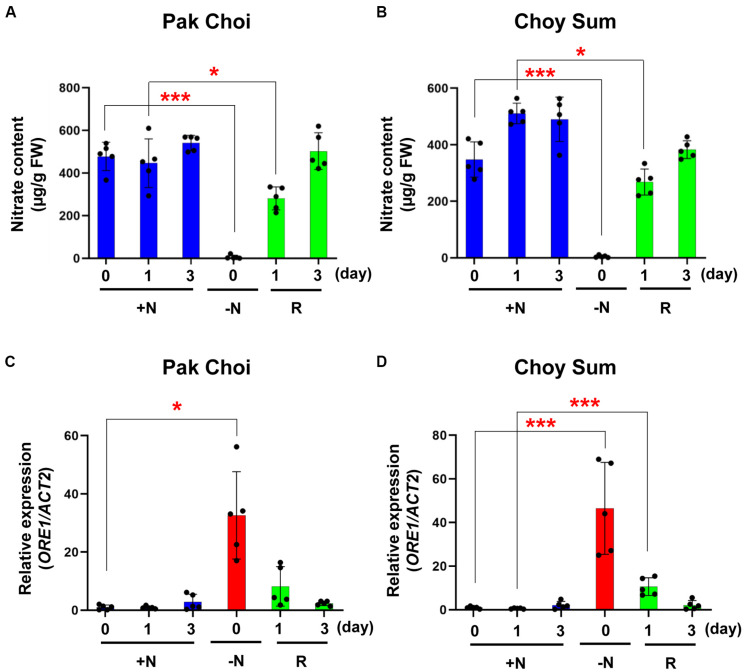
Nutrient deficiency alters growth and development of crop plants and compromises yield. Real-time non-invasive monitoring of the nutritional status of crops would allow timely applications of fertilizers to optimize for growth and yield at different times of the plant's life cycle. Here, we used Raman spectroscopy to characterize Arabidopsis and two varieties of leafy vegetable crops under nitrogen sufficient and deficient conditions. We showed that the 1046 cm-1 Raman peak serves as a specific signature of nitrogen status in planta, which can be used for early diagnosis of nitrogen deficiency in plants before onset of any visible symptoms. Our research can be applied toward crop management for sustainable and precision agriculture.

Keywords: Arabidopsis; Raman spectroscopy; leafy vegetables; nitrate peak; nitrogen deficiency.


Figures

FIGURE 1
FIGURE 1
Analysis of biological/molecular phenotype and Raman spectrum of early nitrogen deficiency in Arabidopsis. Three-week-old seedlings of wild-type (WT) Arabidopsis (Col-0) were transferred into nitrogen-sufficient (+N) or nitrogen-deficient (–N) hydroponic medium and grown for an additional 3 days. (A) Morphological phenotype, scale bar, 1 cm. (B) Total chlorophyll content of leaf No. 4 was analyzed in +N and –N plants. n = 8 (biologically independent experiments). Data are mean values, n = 8 (biologically independent experiments) and individual data points are shown as overlays. FW; fresh weight. P values are given in Supplementary Table S2. (C) Nitrate content of leaf No. 4 was analyzed in +N or –N plants. Data are mean values, n = 12 (biologically independent experiments) and individual data points are shown as overlays. Asterisks indicate statistically significant difference compared with + N. *P < 0.05, **P < 0.01, and ***P < 0.001; two-tailed t-test. FW; fresh weight. Supplementary Table S2 shows P values. (D) ORE1 transcript levels were analyzed by qRT-PCR in leaf No.4 samples of +N or -N plants. Data are mean values, n = 10 (biologically independent experiments) and individual data points are shown as overlays. Asterisks indicate statistically significant difference compared with + N. *P < 0.05, **P < 0.01, and ***P < 0.001; two-tailed t-test. Supplementary Tables S1, S2 show primer sets and P values, respectively. (E). Schematic of the Raman spectroscopy setup. (F). Three-week-old seedlings of WT transferred into +N and –N hydroponic medium and grown for 3 days. Leaf No. 4 was used for measurement of Raman spectra. Peak intensities are mean values, n = 12 (biologically independent experiments). (G). Raman spectra of 100 mM Ca(NO3)2, KNO3, and NH4NO3. Identification of the nitrate peak by standard pure chemicals. a.u; arbitrary unit.
FIGURE 2
FIGURE 2
Comparison of Raman spectra under sufficient or deficient condition of 3 macronutrients (N, P, and K) in Arabidopsis. (A,B) Three-week-old seedlings of WT transferred into phosphate-sufficient (+P), phosphate-deficient (–P), potassium-sufficient (+K), or potassium-deficient (–K) hydroponic medium and grown for 3 days. Leaf No. 4 was used for measurement of Raman spectra. Peak intensities are mean values, n = 12 (biologically independent experiments). (C) Comparison of peak intensity of the 1046 cm–1 peak in +N, –N, +P, –P, +K or –K plants. Region of Raman spectra between 1010 and 1100 cm–1 is shown from Figure 1E, 2A,B. a.u; arbitrary unit. (D) The intensity of the 1046 cm–1 peak was analyzed. Data are mean values, n = 12 (biologically independent experiments) and individual data points are shown as overlays. Asterisks indicate statistically significant difference compared with +N, +P or +K, respectively. *P < 0.05, **P < 0.01, and ***P < 0.001; two-tailed t-test. P values are shown in Supplementary Table S3.
FIGURE 3
FIGURE 3
Comparative analysis of biological/molecular phenotype and Raman spectra of early nitrogen deficiency in Arabidopsis WT and nrt2.1-2. Three-week-old seedlings of Arabidopsis WT (Col-0) and nrt2.1-2 were transferred into +N or –N hydroponic medium and grown for 3 days. (A) Morphological phenotype, scale bar, 1 cm. n = 8 (biologically independent experiments). (B) Total chlorophyll content of leaf No. 4 samples was analyzed in +N and –N plants. Data are mean values, n = 8 (biologically independent experiments) and individual data points are shown as overlays. FW; fresh weight. P values are shown in Supplementary Table S4. (C) Nitrate content of leaf No. 4 samples was analyzed in +N and –N plants. Data are mean values, n = 8 (biologically independent experiments) and individual data points are shown as overlays. Asterisks indicate statistically significant difference compared with + N. *P < 0.05, **P < 0.01, and ***P < 0.001; two-tailed t-test. FW; fresh weight. Supplementary Table S4 shows P values. (D) ORE1 transcript levels were analyzed by qRT-PCR in leaf No.4 samples of +N and –N plants Data are mean values, n = 8 (biologically independent experiments) and individual data points are shown as overlays. Asterisks indicate statistically significant difference compared with + N. *P < 0.05, **P < 0.01, and ***P < 0.001; two-tailed t-test. Supplementary Tables S1, S4 show primer sets and P values, respectively. (E,F) Leaf No.4 samples of +N or –N plants were measured by Raman spectroscopy. The 1046 cm–1 region of Raman spectrum shows the nitrate peak of WT or nrt2.1-2 in +N or –N condition. Data are mean values, n = 12 (biologically independent experiments) and individual data points are shown as overlays. Asterisks indicate statistically significant difference compared with Col-0 (+N). *P < 0.05, **P < 0.01, and ***P < 0.001; two-tailed t-test. P values were shown in Supplementary Table S5. a.u; arbitrary unit.
FIGURE 4
FIGURE 4
Biological/molecular phenotype and Raman spectral analysis of early nitrogen deficiency in leafy vegetables, Pak Choi and Choy Sum. Two-week-old seedlings of Pak Choi (Brassica rapa chinensis) and Choy Sum (Brassica rapa var. parachinensis) were transferred into +N or –N hydroponic medium and grown for 5 days. (A) Morphological phenotype, scale bar, 1 cm. n = 8 (biologically independent experiments). (B) Total chlorophyll content of leaf No. 4 samples was analyzed in +N and –N plants. Data are mean values, n = 8 (biologically independent experiments) and individual data points are shown as overlays. Asterisks indicate statistically significant difference compared with + N. *P < 0.05, **P < 0.01, and ***P < 0.001; two-tailed t-test. FW; fresh weight. P values are shown in Supplementary Table S2. (C) Nitrate content of leaf No. 4 samples was analyzed in +N and –N plants. Data are mean values, n = 12 (biologically independent experiments) and individual data points are shown as overlays. Asterisks indicate statistically significant difference compared with + N. *P < 0.05, **P < 0.01, and ***P < 0.001; two-tailed t-test. FW; fresh weight. P values are shown in Supplementary Table S2. (D) ORE1 orthologous gene transcript levels were analyzed by qRT-PCR in leaf No. 4 samples of Pak Choi and Choy Sum grown under +N or –N condition for 5 days. Data are mean values, n = 12 (biologically independent experiments) and individual data points are shown as overlays. Asterisks indicate statistically significant difference compared with +N. *P < 0.05, **P < 0.01, and ***P < 0.001; two-tailed t-test. Supplementary Tables S1, S2 show primer sets and P values, respectively. (E,F) Leaf No. 4 samples from +N and -N plants were measured by Raman spectroscopy. Only the 1046 cm–1 of Raman shift (cm–1) is shown. Data are mean values, n = 12 (biologically independent experiments) and individual data points are shown as overlays. Asterisks indicate statistically significant difference compared with +N. *P < 0.05, **P < 0.01, and ***P < 0.001; two-tailed t-test. P values were shown in Supplementary Table S5. a.u; arbitrary unit.
FIGURE 5
FIGURE 5
Time course analysis of Arabidopsis under + N, –N and recovery conditions by Raman spectroscopy. (A) Three-week-old seedlings of WT (Col-0) were transferred into +N or –N hydroponic medium. Leaf No. 4 samples were measured by Raman spectroscopy at various time points after transfer to –N medium. n = 10 (biologically independent experiments). (B) Arabidopsis plants grown under –N for 3 days were transferred into +N medium. Plants samples (R) at 0 day were same with samples grown for 3 days under –N medium. Samples were taken at various time points for 4 days. R; plants in the recovery +N medium, Scale bar, 0.5 cm (A,B). a.u; arbitrary unit. n = 10 (biologically independent experiments). (C) Nitrate content of leaf No. 4 was analyzed in +N or recovery plants (R). Data are mean values, n = 12 (biologically independent experiments) and individual data points are shown as overlays. Asterisks indicate statistically significant difference compared with +N. *P < 0.05, **P < 0.01, and ***P < 0.001; two-tailed t-test. FW; fresh weight. Supplementary Table S2 shows P values. (D) ORE1 transcript levels were analyzed by qRT-PCR in samples (leaf #4) of +N or recovery plants (R). Data are mean values, n = 5 (biologically independent experiments) and individual data points are shown as overlays. Asterisks indicate statistically significant difference compared with +N. *P < 0.05, **P < 0.01, and ***P < 0.001; two-tailed t-test. Supplementary Tables S1, S6 show primer set and P values, respectively.
FIGURE 6
FIGURE 6
Time course analysis of leafy vegetables, Pak Choi and Choy Sum under + N, –N and recovery conditions by Raman spectroscopy. (A,B) Three-week old seedlings of two-week old seedlings of Pak Choi (Brassica rapa chinensis) and Choy Sum (Brassica rapa var. parachinensis) were transferred into +N or –N hydroponic medium. Leaf No. 4 samples were measured by Raman spectroscopy at various time points after transfer to –N medium. n = 10 (biologically independent experiments). (C,D) Pak Choi and Choy Sum plants grown under –N for 3 days were transferred into +N medium. Plants samples (R) at 0 day were same with samples grown for 3 days under –N medium. Samples were taken at various time points for 3 days. n = 5 (biologically independent experiments). R; recovery plant, Scale bar, 0.5 cm. a.u; arbitrary unit.
FIGURE 7
FIGURE 7
Nitrate content and ORE1 orthologous gene expression levels of two leafy vegetables in recovery experiments. (A,B) Nitrate content of leaf No. 4 was analyzed in +N or recovery plants (R) in Pak Choi (A) and Choy Sum (B). Data are mean values, n = 5 (biologically independent experiments) and individual data points are shown as overlays. Asterisks indicate statistically significant difference compared with +N. *P < 0.05, **P < 0.01, and ***P < 0.001; two-tailed t-test. FW; fresh weight. (C,D) ORE1 orthologous gene transcript levels were analyzed by qRT-PCR in leaf No. 4 samples of +N or recovery plants (R) in Pak Choi (C) and Choy Sum (D). Data are mean values, n = 5 (biologically independent experiments) and individual data points are shown as overlays. Asterisks indicate statistically significant difference compared with +N. *P < 0.05, **P < 0.01, and ***P < 0.001; two-tailed t-test. Supplementary Tables S1, S7 show primer sets and P values, respectively.

Similar articles

Cited by

References

    1. Altangerel N., Ariunbold G. O., Gorman C., Alkahtani M. H., Borrego E. J., Bohlmeyer D., et al. (2017). In vivo diagnostics of early abiotic plant stress response via Raman spectroscopy. Proc. Natl. Acad. Sci. U.S.A. 114 3393–3396. 10.1073/pnas.1701328114 - DOI - PMC - PubMed
    1. Baranski R., Baranska M., Schulz H. (2005). Changes in carotenoid content and distribution in living plant tissue can be observed and mapped in situ using NIR-FT-Raman spectroscopy. Planta 222 448–457. 10.1007/s00425-005-1566-9 - DOI - PubMed
    1. Blackmer T. M., Schepers J. S., Varvel G. E., Walter-Shea E. A. (1996). Nitrogen deficiency detection using reflected shortwave radiation from irrigated corn canopies. Agron. J. 88 1–5. 10.2134/agronj1996.00021962008800010001x - DOI
    1. Carter G. A. (1994). Ratios of leaf reflectances in narrow wavebands as indicators of plant stress. Int. J. Remote Sens. 15 697–703. 10.1080/01431169408954109 - DOI
    1. Cataldo D. A., Maroon M., Schrader L. E., Youngs V. L. (1975). Rapid colorimetric determination of nitrate in plant tissue by nitration of salicylic acid. Commun. Soil Sci. Plant Anal. 6 71–80. 10.1080/00103627509366547 - DOI

LinkOut - more resources