

Interaction Between Zn Deficiency, Toxicity and Turnip Yellow Mosaic Virus Infection in Noccaea ochroleucum
- PMID: 32582260
- PMCID: PMC7290001
- DOI: 10.3389/fpls.2020.00739
Interaction Between Zn Deficiency, Toxicity and Turnip Yellow Mosaic Virus Infection in Noccaea ochroleucum
Abstract
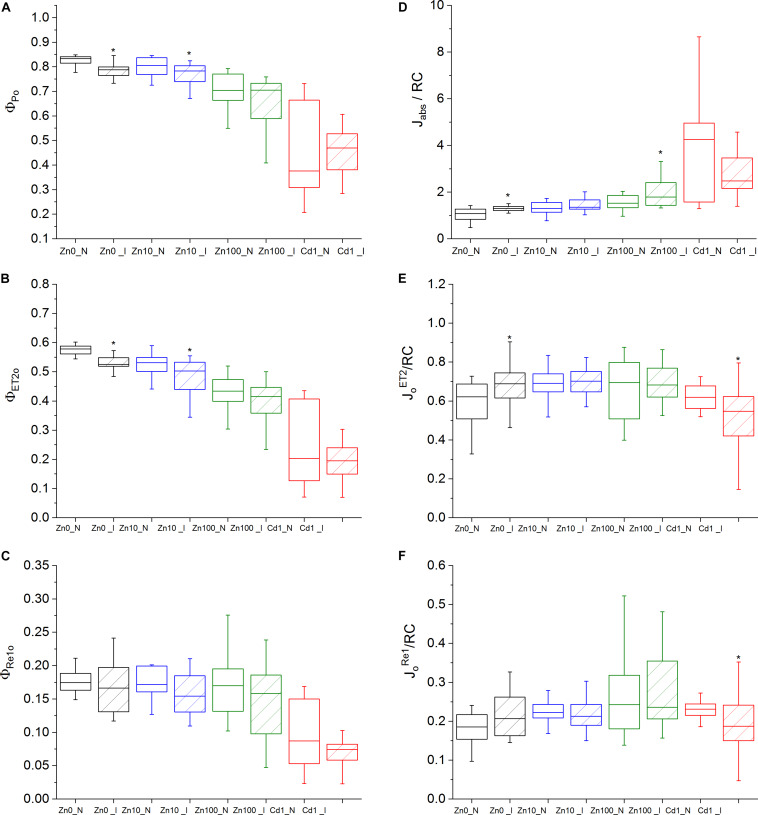
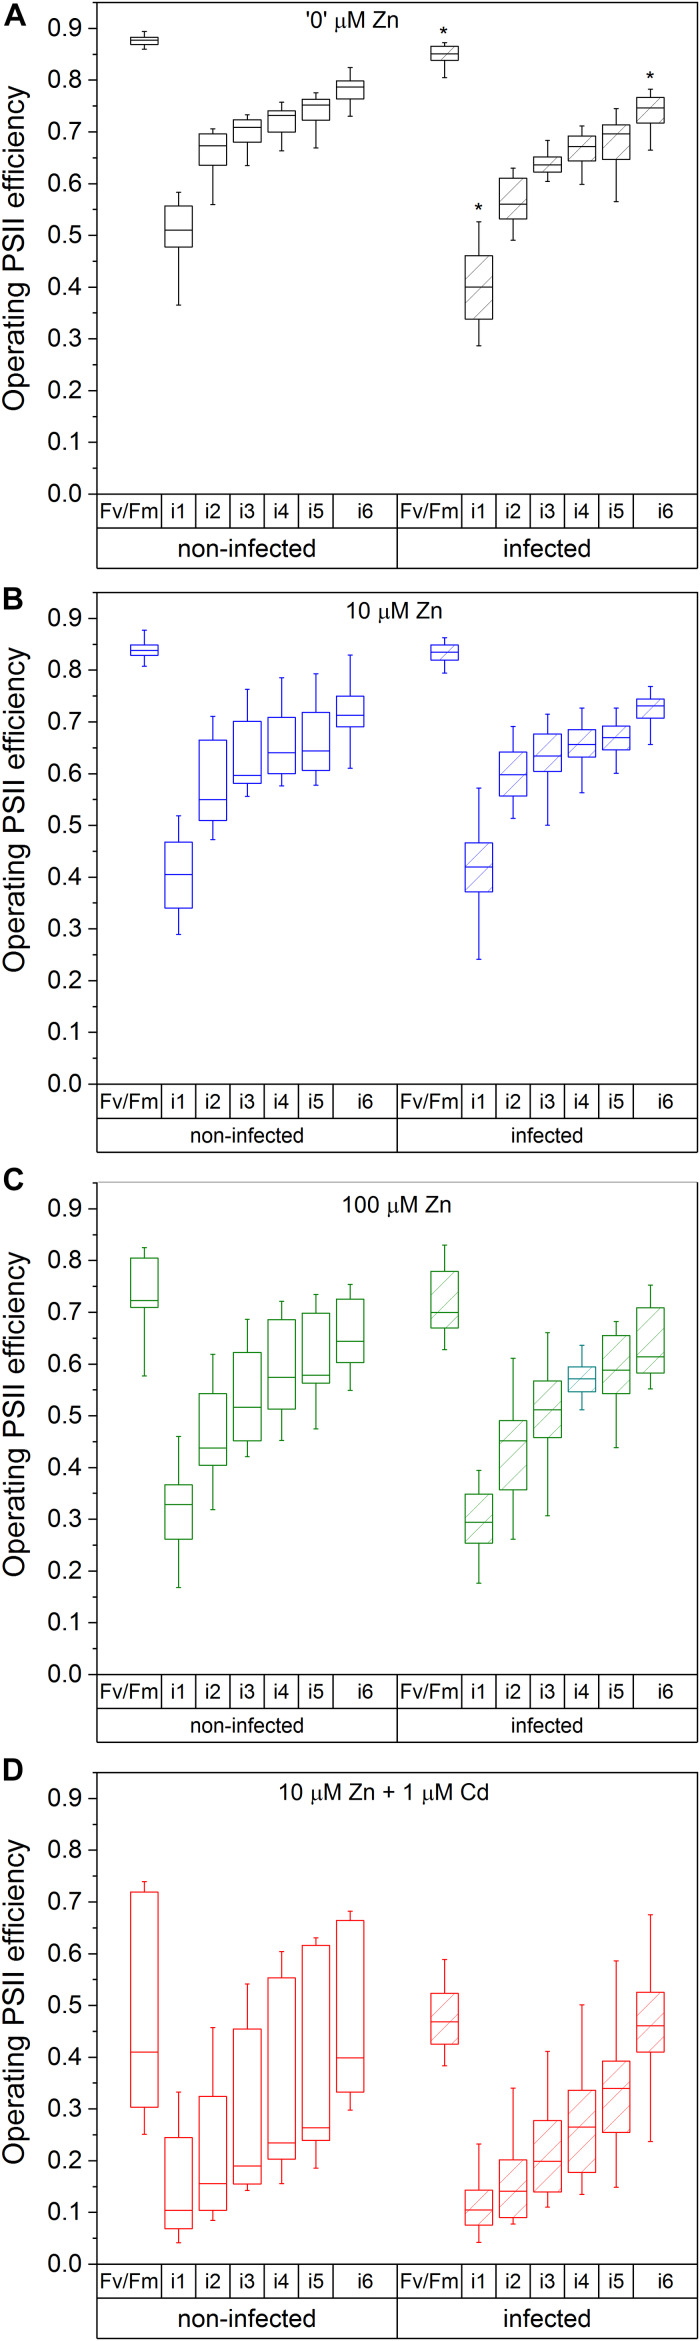
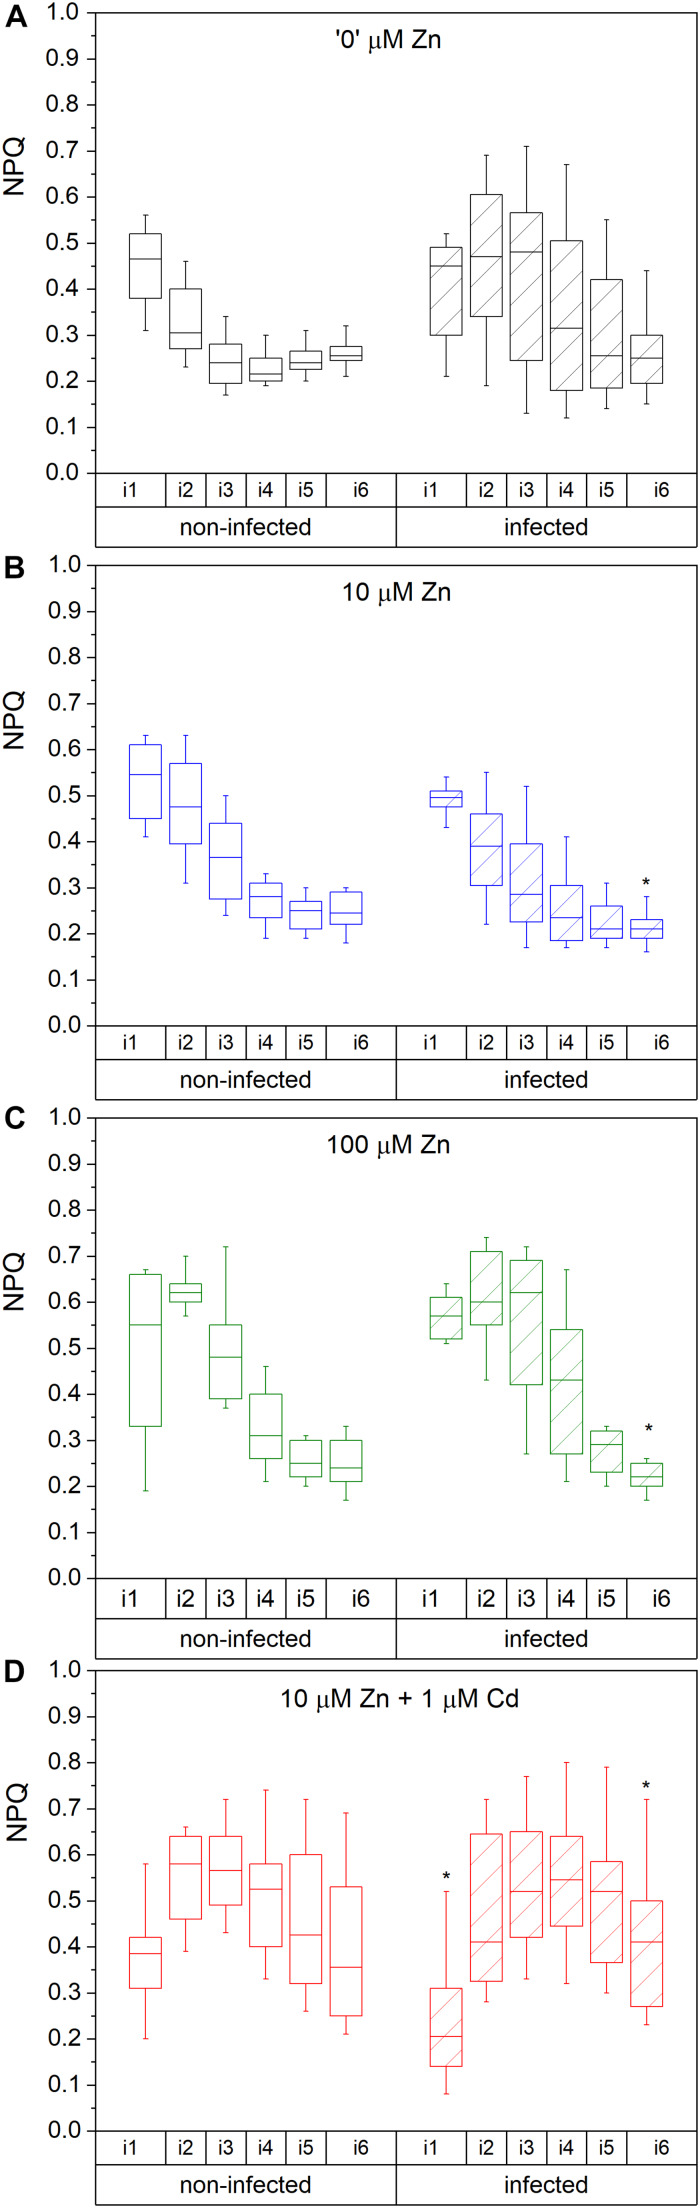
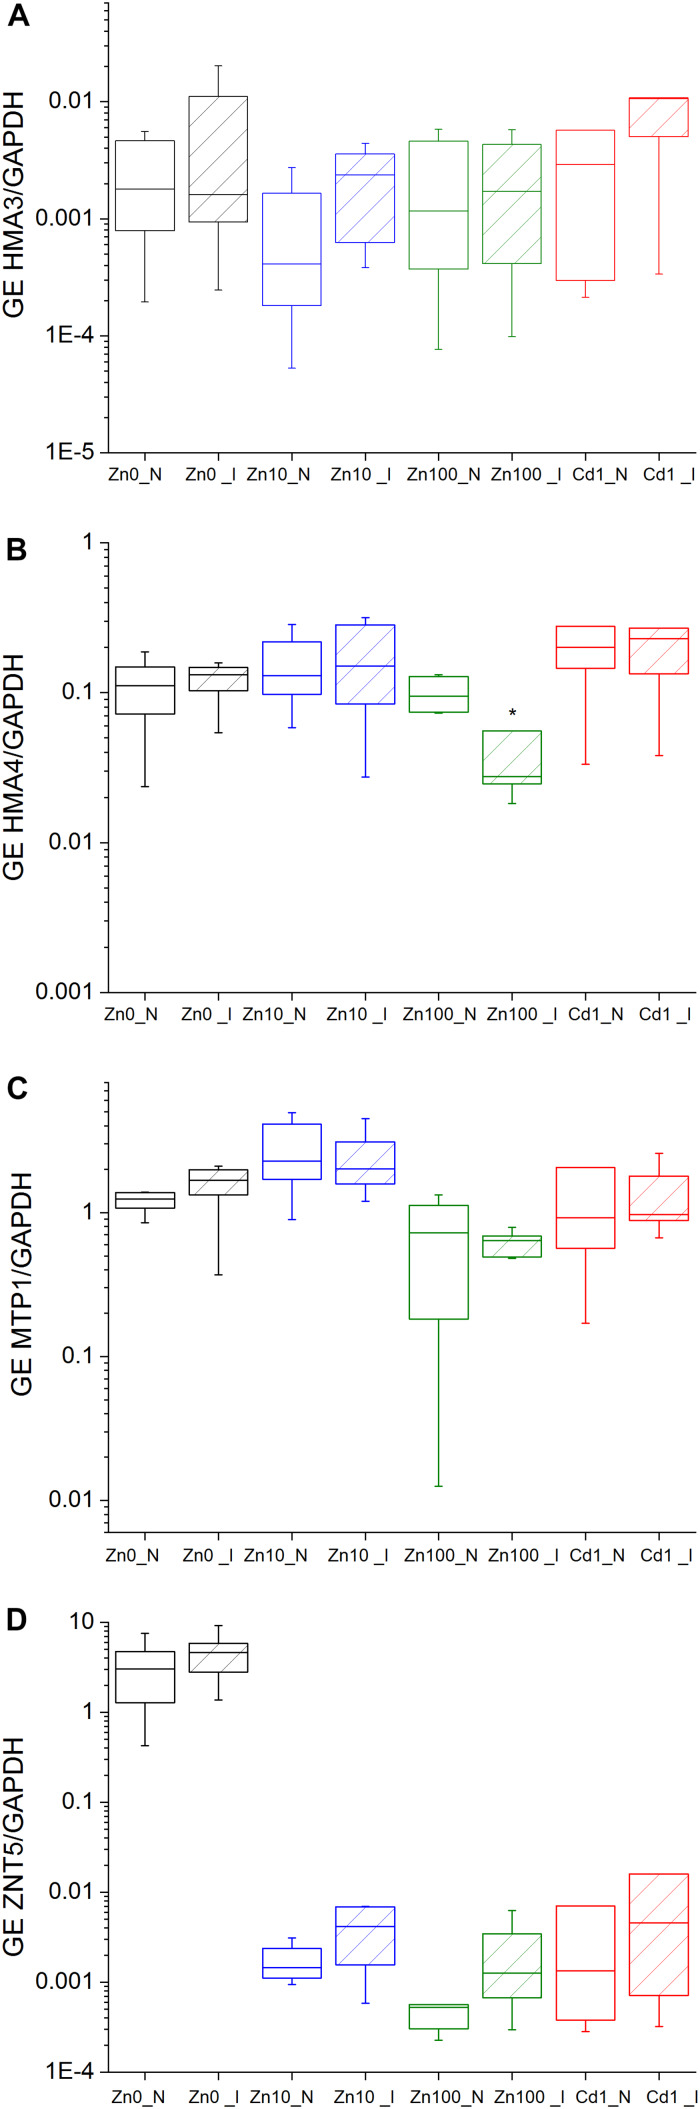
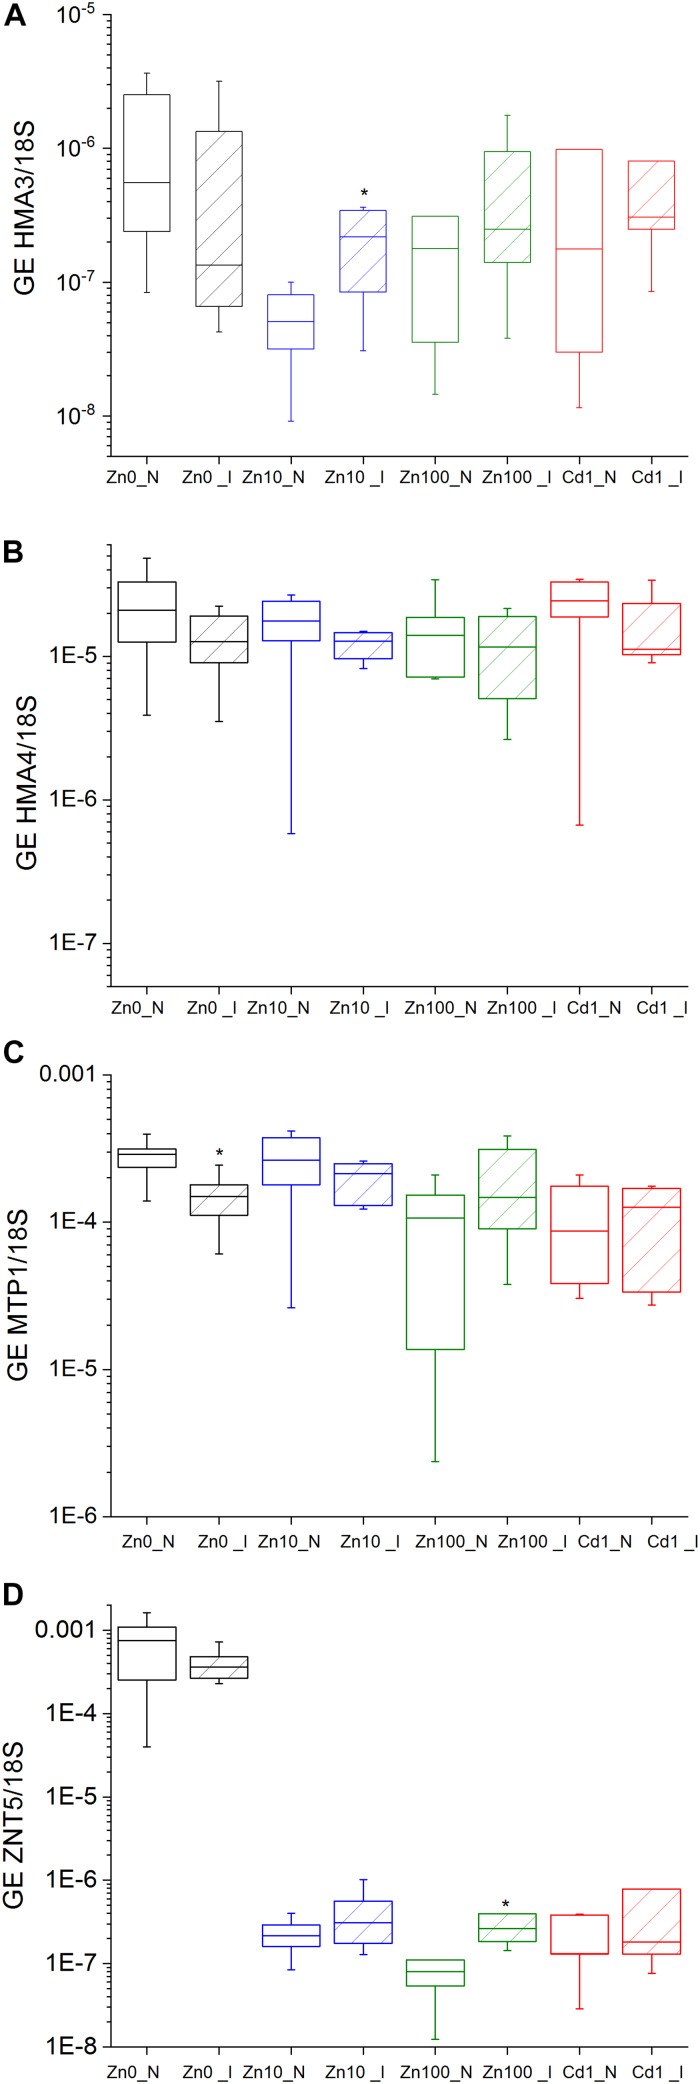
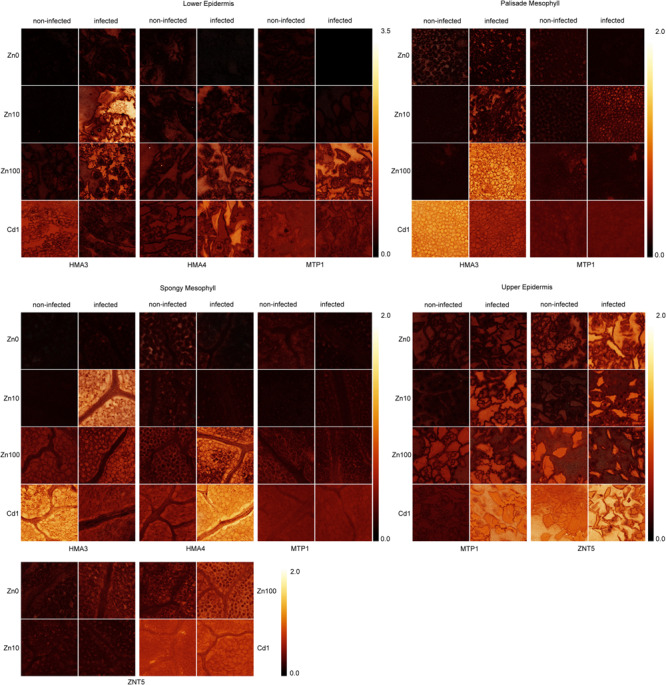
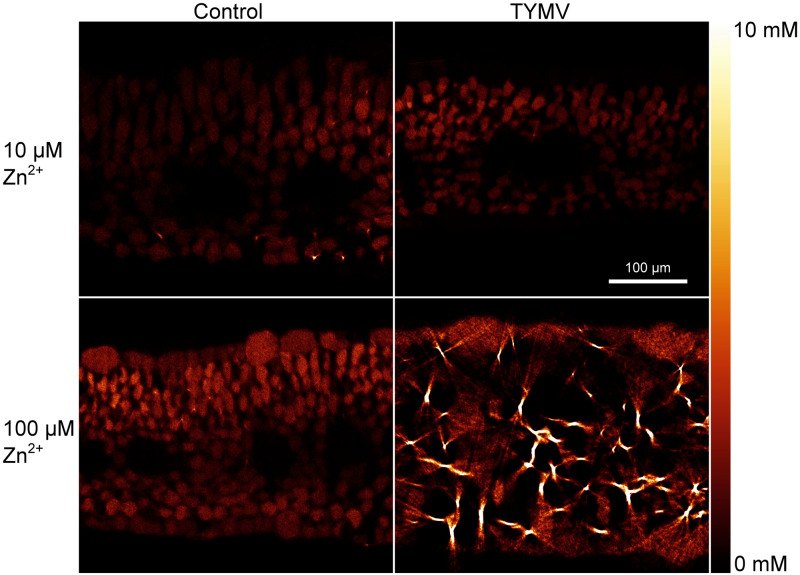
Zinc is essential for the functioning of numerous proteins in plants. To investigate how Zn homeostasis interacts with virus infection, Zn-tolerant Noccaea ochroleucum plants exposed to deficient (Zn'0'), optimal (Zn10), and excess Zn (Zn100) concentrations, as well as Cd amendment, were infected with Turnip yellow mosaic virus (TYMV). Imaging analysis of fluorescence kinetics from the μs (OJIP) to the minutes (Kautsky effect, quenching analysis) time domain revealed strong patchiness of systemic virus-induced photosystem II (PSII) inhibition. That was more pronounced in Zn-deficient plants, while Zn excess acted synergistically with TYMV, in both cases resulting in reduced PSII reaction centers. Infected Cd-treated plants, already severely stressed, showed inhibited non-photochemical quenching and PSII activity. Quantitative in situ hybridization at the cellular level showed increased gene expression of ZNT5 and downregulation of HMA4 in infected Zn-deficient leaves. In Zn10 and Zn100 infected leaves, vacuolar sequestration of Zn increased by activation of HMA3 (mesophyll) and MTP1 (epidermis). This correlated with Zn accumulation in the mesophyll and formation of biomineralization dots in the cell wall (Zn100) visible by micro X-ray fluorescence tomography. The study reveals the importance of adequate Zn supply and distribution in the maintenance of photosynthesis under TYMV infection, achieved by tissue-targeted activation of metal transporter gene expression.
Keywords: TYMV infection; cadmium; chlorophyll fluorescence kinetics; metal transporters; micro X-ray fluorescence; non-hyperaccumulator; plant immunity; zinc.
Copyright © 2020 Morina, Mishra, Mijovilovich, Matoušková, Brückner, Špak and Küpper.
Figures
Similar articles
-
Cadmium and Zn hyperaccumulation provide efficient constitutive defense against Turnip yellow mosaic virus infection in Noccaea caerulescens.Plant Sci. 2023 Nov;336:111864. doi: 10.1016/j.plantsci.2023.111864. Epub 2023 Sep 7. Plant Sci. 2023. PMID: 37689279
-
Direct inhibition of photosynthesis by Cd dominates over inhibition caused by micronutrient deficiency in the Cd/Zn hyperaccumulator Arabidopsis halleri.Plant Physiol Biochem. 2020 Oct;155:252-261. doi: 10.1016/j.plaphy.2020.07.018. Epub 2020 Jul 22. Plant Physiol Biochem. 2020. PMID: 32781275
-
Impaired leaf CO2 diffusion mediates Cd-induced inhibition of photosynthesis in the Zn/Cd hyperaccumulator Picris divaricata.Plant Physiol Biochem. 2013 Dec;73:70-6. doi: 10.1016/j.plaphy.2013.09.008. Epub 2013 Sep 18. Plant Physiol Biochem. 2013. PMID: 24077231
-
Cadmium-zinc accumulation and photosystem II responses of Noccaea caerulescens to Cd and Zn exposure.Environ Sci Pollut Res Int. 2017 Jan;24(3):2840-2850. doi: 10.1007/s11356-016-8048-4. Epub 2016 Nov 12. Environ Sci Pollut Res Int. 2017. PMID: 27838905
-
Route and Regulation of Zinc, Cadmium, and Iron Transport in Rice Plants (Oryza sativa L.) during Vegetative Growth and Grain Filling: Metal Transporters, Metal Speciation, Grain Cd Reduction and Zn and Fe Biofortification.Int J Mol Sci. 2015 Aug 13;16(8):19111-29. doi: 10.3390/ijms160819111. Int J Mol Sci. 2015. PMID: 26287170 Free PMC article. Review.
Cited by
-
A resilient mutualistic interaction between cucumber mosaic virus and its natural host to adapt to an excess zinc environment and drought stress.J Plant Res. 2024 Nov;137(6):1151-1164. doi: 10.1007/s10265-024-01573-w. Epub 2024 Aug 27. J Plant Res. 2024. PMID: 39190237
-
Interactions among Zinc, Iron, and Paraquat in the Physiological and Toxicological Responses of the Egyptian Cotton Leafworm Spodoptera littoralis.Toxics. 2025 Jan 5;13(1):38. doi: 10.3390/toxics13010038. Toxics. 2025. PMID: 39853036 Free PMC article.
-
Zinc and Copper Ions Differentially Regulate Prion-Like Phase Separation Dynamics of Pan-Virus Nucleocapsid Biomolecular Condensates.Viruses. 2020 Oct 18;12(10):1179. doi: 10.3390/v12101179. Viruses. 2020. PMID: 33081049 Free PMC article.
References
-
- Alexander M. M., Cilia M. (2016). A molecular tug-of-war: global plant proteome changes during viral infection. Curr. Plant Biol. 5 13–24. 10.1016/j.cpb.2015.10.003 - DOI
-
- Andresen E., Küpper H. (2013). “Cadmium toxicity in plants,” in Cadmium: From Toxicity to Essentiality, Chapter 13, Volume 11 of Series Metal Ions in Life Sciences, eds Sigel A., Sigel H., Sigel R. K. O. (Dordrecht: Springer; ), 395–414. - PubMed
LinkOut - more resources
Full Text Sources