. 2020 Jun 9:11:478.
doi: 10.3389/fgene.2020.00478. eCollection 2020.

Bioinformatics Analysis of Prognostic miRNA Signature and Potential Critical Genes in Colon Cancer

Affiliations

Bioinformatics Analysis of Prognostic miRNA Signature and Potential Critical Genes in Colon Cancer

Weigang Chen et al. Front Genet. .

Abstract

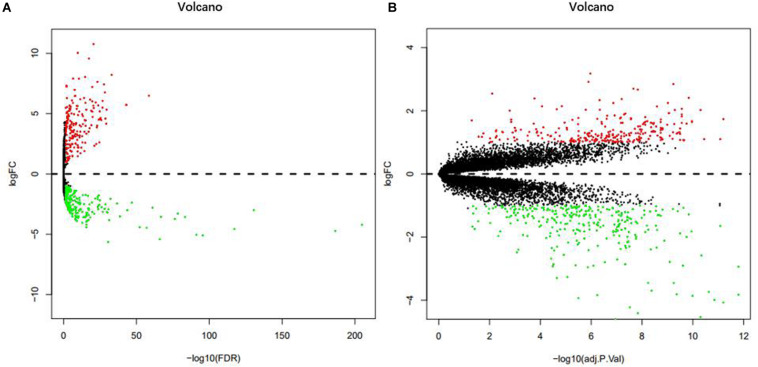
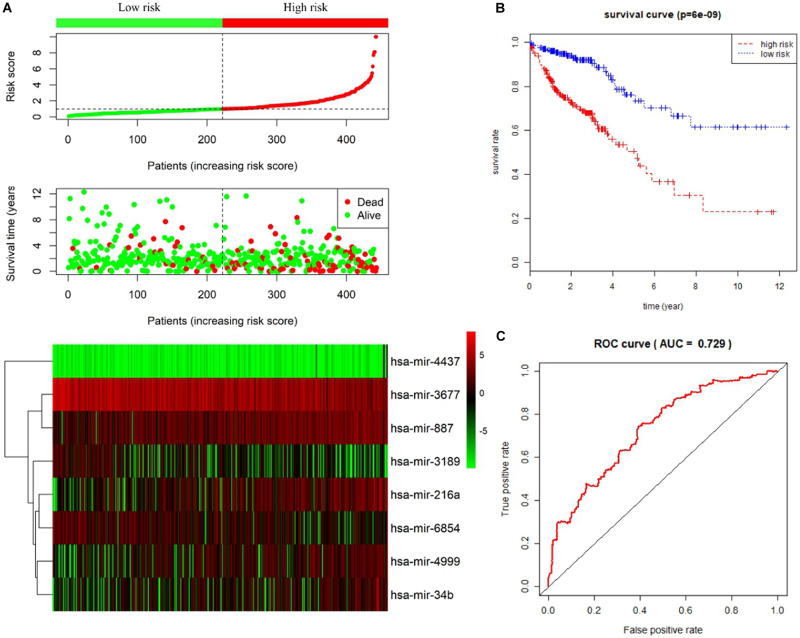
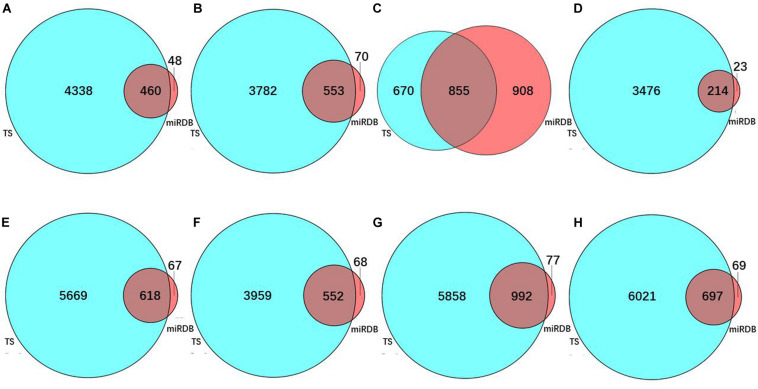
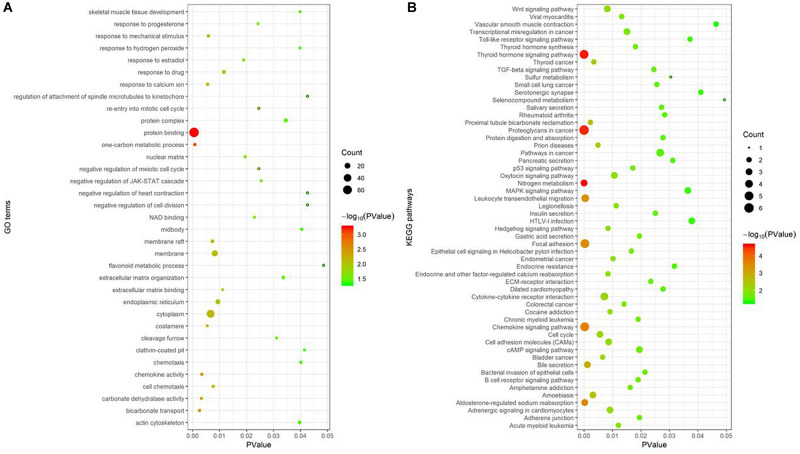
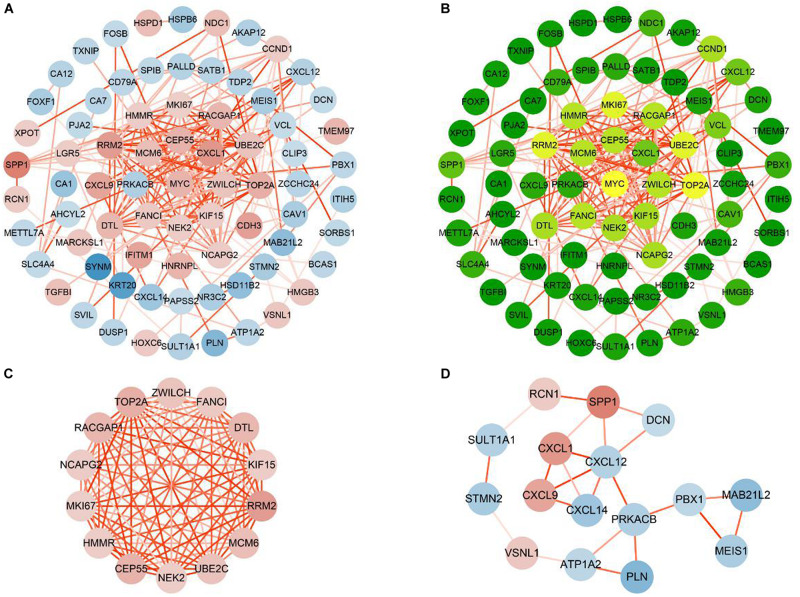
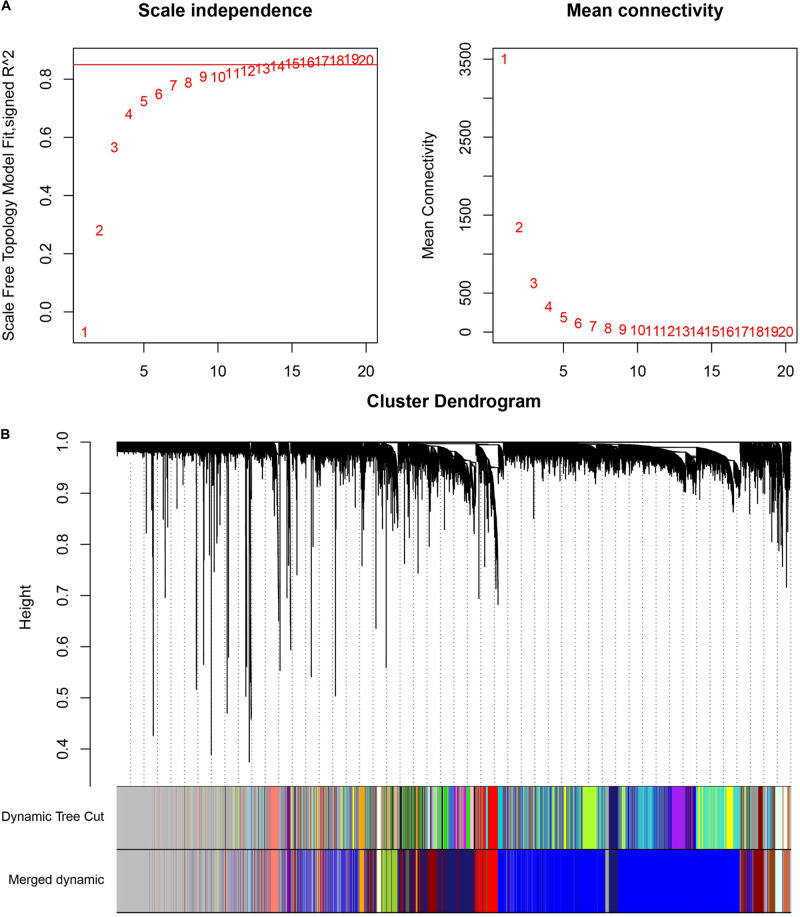
This study aims to lay a foundation for studying the regulation of microRNAs (miRNAs) in colon cancer by applying bioinformatics methods to identify miRNAs and their potential critical target genes associated with colon cancer and prognosis. Data of differentially expressed miRNAs (DEMs) and genes (DEGs) downloaded from two independent databases (TCGA and GEO) and analyzed by R software resulted in 472 DEMs and 565 DEGs in colon cancers, respectively. Next, we developed an 8-miRNA (hsa-mir-6854, hsa-mir-4437, hsa-mir-216a, hsa-mir-3677, hsa-mir-887, hsa-mir-4999, hsa-mir-34b, and hsa-mir-3189) prognostic signature for patients with colon cancer by Cox proportional hazards regression analysis. To predict the target genes of these miRNAs, we used TargetScan and miRDB. The intersection of DEGs with the target genes predicted for these eight miRNAs retrieved 112 consensus genes. GO and KEGG pathway enrichment analyses showed these 112 genes were mainly involved in protein binding, one-carbon metabolic process, nitrogen metabolism, proteoglycans in cancer, and chemokine signaling pathways. The protein-protein interaction network of the consensus genes, constructed using the STRING database and imported into Cytoscape, identified 14 critical genes in the pathogenesis of colon cancer (CEP55, DTL, FANCI, HMMR, KIF15, MCM6, MKI67, NCAPG2, NEK2, RACGAP1, RRM2, TOP2A, UBE2C, and ZWILCH). Finally, we verified the critical genes by weighted gene co-expression network analysis (WGCNA) of the GEO data, and further mined the core genes involved in colon cancer. In summary, this study identified an 8-miRNA model that can effectively predict the prognosis of colon cancer patients and 14 critical genes with vital roles in colon cancer carcinogenesis. Our findings contribute new ideas for elucidating the molecular mechanisms of colon cancer carcinogenesis and provide new therapeutic targets and biomarkers for future treatment and prognosis.

Keywords: GEO; TCGA; bioinformatics; biomarker; colon cancer; microRNA; prognosis.


Figures

FIGURE 1
FIGURE 1
Volcano plot of DEMs in TCGA (A). Volcano plot of DEGs in GSE24514 (B). Red dots represent up-regulation and green dots represent down-regulation.
FIGURE 2
FIGURE 2
Prognostic risk score model analysis of eight prognostic miRNAs in colon cancer patients. (A) From top to bottom are the risk score distribution, patients’ survival status distribution, and the heatmap of eight miRNA expression profiles ranked by risk score. (B) Kaplan–Meier curves for high-risk and low-risk groups. (C) The ROC curves for predicting survival in colon cancer patients by the risk score.
FIGURE 3
FIGURE 3
The number of predicted target genes of eight prognostic miRNAs. Target gene number predicted for (A) hsa-mir-6854, (B) hsa-mir-4437, (C) hsa-mir-216a, (D) hsa-mir-3677, (E) hsa-mir-887, (F) hsa-mir-4999, (G) hsa-mir-34b, and (H) hsa-mir-3189. In these sub-figures, blue represents the predicted results of TargetScan, and red represents the predicted results of miRDB.
FIGURE 4
FIGURE 4
Functional enrichment analysis of 112 consensus genes. (A) GO enrichment analysis; (B) KEGG pathway enrichment analysis. In these two sub-figures, the x-axis represents the P-value, and the y-axis represents the different GO terms and the KEGG pathways, respectively. The size of the bubbles grows as the number of involved genes increases.
FIGURE 5
FIGURE 5
Construction and analysis PPI networks of consensus genes. (A) PPI network of 75 consensus genes. Red nodes represent up-regulated genes, and blue nodes represent down-regulated genes. The color of the node deepens as the value of |log2FC| increases. The color of the line connecting the circles deepens as the confidence scores increase. (B) Degree values of 75 consensus genes were obtained by CentiScaPe. As the degree values increase, the color of the node changes from green to yellow. (C) Module 1 (MCODE score = 13.8466). (D) Module 2 (MCODE score = 3.067).
FIGURE 6
FIGURE 6
Weighted co-expression gene network analysis. (A) Determination of the soft threshold in the WGCNA algorithm. When the soft thresholding power was 15, the gene distribution conformed to the scale-free network. (B) The cluster dendrogram of all the genes in GSE24514. Each leaf represents a separate gene, and each branch represents a co-expression gene module.
FIGURE 7
FIGURE 7
The visualization of co-expression gene modules. (A) Midnight blue module. (B) Yellow-green module. (C) Red module. The color of the line connecting the circles deepens as the topological overlap measures increases. The color of the node changes from yellow to red as the degree values increases.

Similar articles

Cited by

References

    1. Agarwal V., Bell G. W., Nam J. W., Bartel D. P. (2015). Predicting effective microRNA target sites in mammalian mRNAs. eLife 4:e05005. 10.7554/eLife.05005 - DOI - PMC - PubMed
    1. Ahmed F. E., Vos P. W., Holbert D. (2007). Modeling survival in colon cancer: a methodological review. Mol. Cancer 6:15. 10.1186/1476-4598-6-15 - DOI - PMC - PubMed
    1. Aran V., Victorino A. P., Thuler L. C., Ferreira C. G. (2016). Colorectal cancer: epidemiology, disease mechanisms and interventions to reduce onset and mortality. Clin. Colorectal. Cancer 15 195–203. 10.1016/j.clcc.2016.02.008 - DOI - PubMed
    1. Arnold M., Sierra M. S., Laversanne M., Soerjomataram I., Jemal A., Bray F. (2017). Global patterns and trends in colorectal cancer incidence and mortality. Gut 66 683–691. 10.1136/gutjnl-2015-310912 - DOI - PubMed
    1. Ashburner M., Ball C. A., Blake J. A., Botstein D., Butler H., Cherry J. M., et al. (2000). Gene ontology: tool for the unification of biology. The gene ontology consortium. Nat. Genet. 25 25–29. 10.1038/75556 - DOI - PMC - PubMed