. 2020 Jun 9:11:544.
doi: 10.3389/fgene.2020.00544. eCollection 2020.

Ancestral Haplotype Mapping for GWAS and Detection of Signatures of Selection in Admixed Dairy Cattle of Kenya

Affiliations

Ancestral Haplotype Mapping for GWAS and Detection of Signatures of Selection in Admixed Dairy Cattle of Kenya

Hassan Aliloo et al. Front Genet. .

Abstract

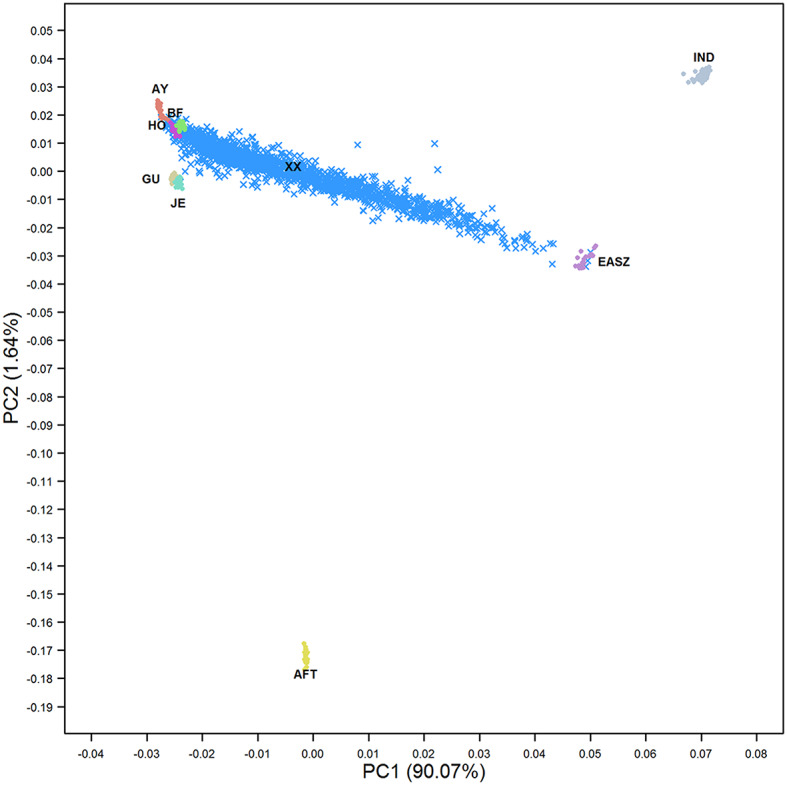
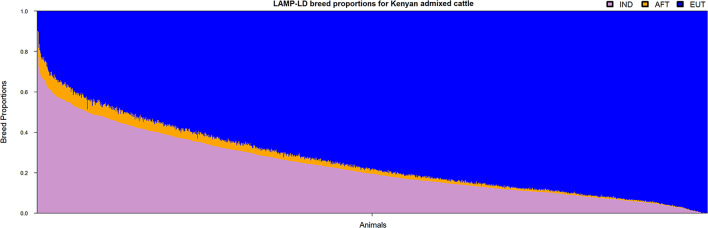
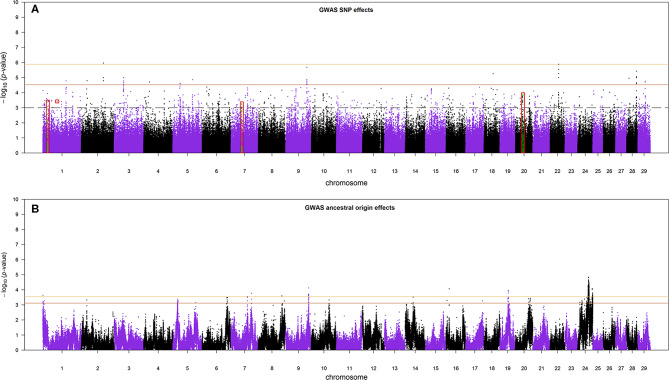
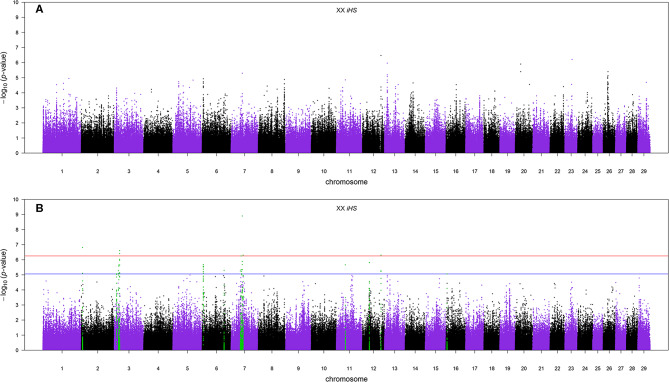
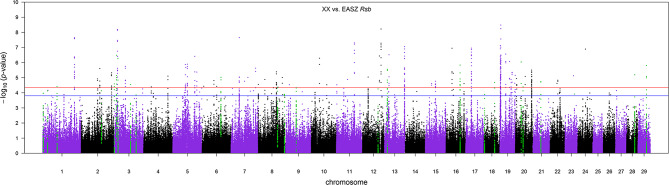
Understanding the genetic structure of adaptation and productivity in challenging environments is necessary for designing breeding programs that suit such conditions. Crossbred dairy cattle in East Africa resulting from over 60 years of crossing exotic dairy breeds with indigenous cattle plus inter se matings form a highly variable admixed population. This population has been subject to natural selection in response to environmental stresses, such as harsh climate, low-quality feeds, poor management, and strong disease challenge. Here, we combine two complementary sets of analyses, genome-wide association (GWA) and signatures of selection (SoS), to identify genomic regions that contribute to variation in milk yield and/or contribute to adaptation in admixed dairy cattle of Kenya. Our GWA separates SNP effects due to ancestral origin of alleles from effects due to within-population linkage disequilibrium. The results indicate that many genomic regions contributed to the high milk production potential of modern dairy breeds with no region having an exceptional effect. For SoS, we used two haplotype-based tests to compare haplotype length variation within admixed and between admixed and East African Shorthorn Zebu cattle populations. The integrated haplotype score (iHS) analysis identified 16 candidate regions for positive selection in the admixed cattle while the between population Rsb test detected 24 divergently selected regions in the admixed cattle compared to East African Shorthorn Zebu. We compare the results from GWA and SoS in an attempt to validate the most significant SoS results. Only four candidate regions for SoS intersect with GWA regions using a low stringency test. The identified SoS candidate regions harbored genes in several enriched annotation clusters and overlapped with previously found QTLs and associations for different traits in cattle. If validated, the GWA and SoS results indicate potential for SNP-based genomic selection for genetic improvement of smallholder crossbred cattle.

Keywords: GWAS; admixed cattle; haplotype; local ancestry inference; signatures of selection.


Figures

Figure 1
Figure 1
The first two principal components showing the distribution of admixed cattle in relation to their ancestral breeds. IND, Bos indicus; AFT, African Bos taurus; AY, Ayrshire; HO, Holstein; BF, British Friesian; GU, Guernsey; JE, Jersey; EASZ, East African Shorthorn Zebu; and XX, Admixed cattle.
Figure 2
Figure 2
The genome-wide average ancestries of the admixed cattle contributed by the three ancestral groups. IND, Bos indicus; AFT, African Bos taurus; and EUT, European Bos taurus.
Figure 3
Figure 3
The distribution of genome-wide average number of crossovers per Morgan on the admixed cattle haplotypes carrying the lowest (A) and highest (B) number of crossovers.
Figure 4
Figure 4
Average local ancestries of the admixed cattle with three or more crossovers per Morgan in the haplotype carrying the lowest number of crossovers. The gray, yellow, and blue lines represent Bos indicus, African Bos Taurus, and European Bos taurus ancestry, respectively.
Figure 5
Figure 5
(A) The Manhattan plot of p-values for SNP allele effects and (B) the Manhattan plot of p-values for ancestral origin effects. The red boxes in (A) are the candidate regions for selection signatures that overlap with GWA regions. The colored horizontal lines are false discovery rate thresholds at 0.112 [−log10(p-value) = 5.88] and 0.35 [−log10(p-value) = 4.53] in (A), and at 0.229 [−log10(p-value) = 3.55] and 0.35 [−log10(p-value) = 3.11] in (B), from top to bottom, respectively. The dashed line in (A) is the suggestive p-value threshold of 10−3.
Figure 6
Figure 6
(A) The Manhattan plot of p-values for genome-wide iHS scores calculated using all samples and (B) the Manhattan plot of p-values for genome-wide iHS scores calculated using only admixed cattle with three or more crossovers per Morgan. The red and blue horizontal lines are false discovery rate thresholds at 0.05 [−log10(p-value) = 6.25] and 0.10 [−log10(p-value) = 5.06], respectively. Green points are the SNPs within the candidate regions identified as being under selection.
Figure 7
Figure 7
The Manhattan plot of p-values for Rsb analysis between the admixed cattle with a minimum number of three crossovers per Morgan and the East African Shorthorn Zebu population. The red and blue horizontal lines are false discovery rate thresholds at 0.05 [−log10(p-value) = 4.35] and 0.10 [−log10(p-value) = 3.80], respectively. Green points are the SNPs within the candidate regions identified as being under selection in the crossbred population.

Similar articles

Cited by

References

    1. Akanno E. C., Chen L., Abo-Ismail M. K., Crowley J. J., Wang Z., Li C., et al. . (2018). Genome-wide association scan for heterotic quantitative trait loci in multi-breed and crossbred beef cattle. Genet. Sel. Evol. 50:48. 10.1186/s12711-018-0405-y - DOI - PMC - PubMed
    1. Alexander D. H., Novembre J., Lange K. (2009). Fast model-based estimation of ancestry in unrelated individuals. Genome Res. 19, 1655–1664. 10.1101/gr.094052.109 - DOI - PMC - PubMed
    1. Al-Husseini W., Gondro C., Quinn K., Herd R. M., Gibson J. P., Chen Y. (2014). Expression of candidate genes for residual feed intake in Angus cattle. Anim. Genet. 45, 12–19. 10.1111/age.12092 - DOI - PubMed
    1. Aliloo H., Mrode R., Okeyo A. M., Ni G., Goddard M. E., Gibson J. P. (2018). The feasibility of using low-density marker panels for genotype imputation and genomic prediction of crossbred dairy cattle of East Africa. J. Dairy Sci. 101, 9108–9127. 10.3168/jds.2018-14621 - DOI - PubMed
    1. Ariffin J. K., Kapetanovic R., Schaale K., Gatica-Andrades M., Blumenthal A., Schroder K., et al. . (2016). The E3 ubiquitin ligase RNF144B is LPS-inducible in human, but not mouse, macrophages and promotes inducible IL-1β expression. J. Leukocyte Biol. 100, 155–161. 10.1189/jlb.2AB0815-339R - DOI - PubMed

LinkOut - more resources