. 2020 Jun 9:11:587.
doi: 10.3389/fgene.2020.00587. eCollection 2020.

Identification of the cDNA Encoding the Growth Hormone Receptor (GHR) and the Regulation of GHR and IGF-I Gene Expression by Nutritional Status in Reeves' Turtle (Chinemys reevesii)

Affiliations

Identification of the cDNA Encoding the Growth Hormone Receptor (GHR) and the Regulation of GHR and IGF-I Gene Expression by Nutritional Status in Reeves' Turtle (Chinemys reevesii)

Wenlu Zhu et al. Front Genet. .

Abstract

Chinemys reevesii (Reeves' turtle) is a slow-growing reptile that is distributed widely across China. Prior to this study, the cDNA sequence of the growth hormone receptor (GHR) in the Reeve's turtle, or how periods of starvation might influence the gene expression of GHR and insulin-like growth factor I (IGF-I) in this species, were unknown. Here, we identified the full-length sequence of the cDNA encoding GHR in Reeves' turtle by using RT-PCR and RACE. The full-length GHR cDNA was identified to be 3936 base-pairs in length, with a 1848 base-pair open reading frame (ORF) that encodes a 615 amino acid protein. Analysis showed that GHR mRNA was detectable in a wide range of tissues; the highest and lowest levels of expression were detected in the liver and the gonad, respectively. IGF-I was also expressed in a range of tissues, but not in the gonad; the highest levels of IGF-I expression were detected in the liver. After 4 weeks of fasting, the expression levels of GHR and IGF-I in the liver had decreased significantly; however, these gradually returned to normal after refeeding. We report the first cloned cDNA sequence for the GHR gene in the Reeve's turtle. Our findings provide a foundation from which to investigate the specific function of the GHR in Reeve's turtle, and serve as a reference for studying the effects of different nutrient levels on GHR expression in this species.

Keywords: Chinemys reevesii; GHR; IGF-I; Reeves’ turtle; starvation.


Figures

FIGURE 1
FIGURE 1
cDNA and deduced amino acid sequences of the GHR gene in Reeves’ turtle. The 5′-UTR and 3′-UTR are shown in lowercase, while the coding region is shown in uppercase. The upper sequence shows nucleotides, while the lower sequence shows amino acids. The initiation codon and the termination codon are indicated by a rectangular box. N-glycosylation sites are indicated by oval boxes. The putative signal peptide region is shown by a dotted line, and the potential transmembrane domain is underlined.
FIGURE 2
FIGURE 2
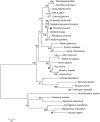
Phylogenetic analysis of GHR proteins. Only complete protein sequences were used for this analysis. The tree was constructed by the neighbor-joining method, using MEGA6.0 software (http://www.megasoftware.net/). The numbers at the nodes represent the bootstrap percentages from 1000 replicates. The GenBank accession numbers of GHR proteins used in the present study are listed in Table 3.
FIGURE 3
FIGURE 3
The tissue distribution of the GHR gene in male (A) and female (B) Reeves’ turtle. Gene expression levels were evaluated by the comparative Ct (2–△△Ct) method with β-actin as an internal standard. Significant differences between groups were detected using one-way ANOVA. Different superscripts signify significant differences (P < 0.05). Data are expressed as mean ± standard error of the mean (n = 3).
FIGURE 4
FIGURE 4
Tissue distribution of the IGF-I gene in male (A) and female (B) Reeves’ turtles. Gene expression levels were evaluated by the comparative Ct (2–△△Ct) method with β-actin as an internal standard. Significant differences between groups were detected using one-way ANOVA. Different superscripts signify significant differences (P < 0.05). Data are expressed as mean ± standard error of the mean (n = 3).
FIGURE 5
FIGURE 5
The expression of GHR mRNA in male (A) and female (B) Reeves’ turtles in a group that was fed and a group that was starved for 28 days. Expression levels were normalized against those of β-actin as an internal standard. Groups that differed significantly are indicated by asterisks above the bars (P < 0.05). Data are shown as mean ± standard error of the mean (n = 3).
FIGURE 6
FIGURE 6
The relative gene expression of GHR in the livers of male (A) and female (B) Reeves’ turtle during fasting (day 0–28) and refeeding (day 28–56). Following standardization against β-actin, gene expression levels were normalized to an expression level of 1 on day 0 (baseline). Asterisks above the bars indicate significant differences (P < 0.05). Data are shown as mean ± standard error of the mean (n = 3).
FIGURE 7
FIGURE 7
The expression of IGF-I mRNA in male (A) and female (B) Reeves’ turtle in groups that were fed and starved for 28 days. Expression levels were normalized against β-actin as a reference gene. Groups that differed significantly are indicated by asterisks above the bars (P < 0.05). Data are shown as mean ± standard error of the mean (n = 3).
FIGURE 8
FIGURE 8
The relative gene expression of IGF-I in the livers of male (A) and female (B) Reeves’ turtle during fasting (days 0–28) and refeeding (days 28–56). Following standardization by β-actin, gene expression levels were normalized to a mean expression level of 1 on day 0 (baseline). Asterisks above the bars indicate significant differences (P < 0.05). Data are shown as mean ± standard error of the mean (n = 3).

Similar articles

Cited by

References

    1. Armstrong D. G., Gutierrez C. G., Baxter G., Glazyrin A. L., Mann G. E., Woad K. J., et al. (2000). Expression of mRNA encoding IGF-I, IGF-II and type 1 IGF receptor in bovine ovarian follicles. J. Endocrinol. 165 101–113. 10.1677/joe.0.1650101 - DOI - PubMed
    1. Ayson F. G., De Jesus-Ayson E. G., Takemura A. (2007). mRNA expression patterns for GH, PRL, SL, IGF-I and IGF-II during altered feeding status in rabbitfish, Siganus guttatus. Gen. Comp. Endocrinol. 150 196–204. 10.1016/j.ygcen.2006.08.001 - DOI - PubMed
    1. Belkin D. A. (1965). Reduction of Metabolic Rate in Response to Starvation in the Turtle Sternothaerus minor. Copeia 1965:367 10.2307/1440804 - DOI
    1. Bergan-Roller H. E., Sheridan M. A. (2018). The growth hormone signaling system: Insights into coordinating the anabolic and catabolic actions of growth hormone. Gen. Comp. Endocrinol. 258 119–133. 10.1016/j.ygcen.2017.07.028 - DOI - PubMed
    1. Bornfeldt K. E., Arnqvist H. J., Enberg B., Mathews L. S., Norstedt G. (1989). Regulation of insulin-like growth factor-I and growth hormone receptor gene expression by diabetes and nutritional state in rat tissues. J. Endocrinol. 122 651–656. 10.1677/joe.0.1220651 - DOI - PubMed

LinkOut - more resources