. 2020 Jun 9:11:611.
doi: 10.3389/fgene.2020.00611. eCollection 2020.

Genetic Bases of the Stomata-Related Traits Revealed by a Genome-Wide Association Analysis in Rice (Oryza sativa L.)

Affiliations

Genetic Bases of the Stomata-Related Traits Revealed by a Genome-Wide Association Analysis in Rice (Oryza sativa L.)

Hongwei Chen et al. Front Genet. .

Abstract

Stomatal density (D) and size (S) are an important adaptive mechanism for abiotic stress tolerance and photosynthesis capacity in rice. However, the genetic base of rice stomata-related traits still remains unclear. We identified quantitative trait loci (QTLs) associated with D and S on abaxial and adaxial leaf surfaces using genome-wide association analysis with 451 diverse accessions in two environments. D and S showed significant differences between indica (xian) and japonica (geng) accessions and significantly negative phenotypic correlations. A total of 64 QTLs influencing eight stomata-related traits were identified using 2,936,762 high-quality single nucleotide polymorphism markers. Twelve QTLs were consistently detected for the same traits in nine chromosomal regions in both environments. In addition, 12 QTL clusters were simultaneously detected for the same stomata-related traits on abaxial and adaxial leaf surfaces in the same environment, probably explaining the genetic bases of significant correlations of the stomata-related traits. We screened 64 candidate genes for the nine consistent QTL regions using haplotype analysis. Among them, LOC_Os01g66120 for qD ada 1, OsSPCH2 (LOC_Os02g15760) for qD ada 2.1 and qD aba 2.1, LOC_Os02g34320 for qS ada 2.2, OsFLP (LOC_Os07g43420) or LOC_Os07g43530 for qS aba 7.1, and LOC_Os07g41200 for qW ada 7 and qW aba 7 were considered as the most likely candidate genes based on functional annotations. The results systematically dissected the genetic base of stomata-related traits and provide useful information for improving rice yield potential via increasing abiotic stress tolerance and photosynthesis capacity under stressed and non-stressed conditions through deploying the favorable alleles underlying stomata-related traits by marker-assisted selection.

Keywords: QTL; candidate gene; genome-wide association study; stomatal density; stomatal size.


Figures

FIGURE 1
FIGURE 1
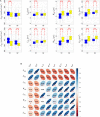
Values and correlations of stomata-related traits in two environments. (A) Box plots of eight stomata-related traits in Sanya (SY) and Beijing (BJ) between xian and geng rice (Oryza sativa L.) panels. Blue and yellow colors indicate xian and geng, respectively. ***Denotes significance of Student’s t-test at P < 0.001. Dada, stomatal density on the adaxial surface; Daba, stomatal density on the abaxial surface; Lada, guard cell length on the adaxial surface; Laba, guard cell length on the abaxial surface; Wada, guard cell width on the adaxial surface; Waba, guard cell width on the abaxial surface; Sada, stomatal size on the adaxial surface; Saba, stomatal size on the abaxial surface. (B) Correlations between the eight tested traits in SY (upper diagonal) and BJ (lower diagonal). The values are correlation coefficients (r) multiplied by 100. The values on the main diagonal are correlations between SY and BJ. The areas and colors of ellipses correspond to absolute values of the corresponding r. Right and left oblique ellipses indicate positive and negative correlations, respectively. Values without glyphs were insignificant at the 0.05 probability level. *, **, *** Indicate significant correlations at P < 0.05, P < 0.01, and P < 0.001, respectively.
FIGURE 2
FIGURE 2
Distribution of quantitative trait loci (QTLs) associated with stomata-related traits on abaxial and adaxial leaf surfaces across the two environments on 12 chromosomes according to physical distance. Dada, stomatal density on the adaxial surface; Daba, stomatal density on the abaxial surface; Lada, guard cell length on the adaxial surface; Laba, guard cell length on the abaxial surface; Wada, guard cell width on the adaxial surface; Waba, guard cell width on the abaxial surface; Sada, stomatal size on the adaxial surface; Saba, stomatal size on the abaxial surface; Envir., environment; SY, Sanya; BJ, Beijing.
FIGURE 3
FIGURE 3
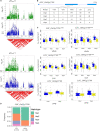
Haplotype analyses of the LOC_Os01g66120 candidate gene for the Dada at qDada1. (A) Linkage disequilibrium (LD) block surrounding the peak on chromosome 1. Dashed lines indicate the candidate region for the peak. (B) Gene structure of LOC_Os01g66120 and DNA polymorphisms in that gene. (C) Boxplots for stomatal density on the adaxial surface (Dada) based on haplotypes for LOC_Os01g66120 using non-synonymous single nucleotide polymorphisms (SNPs) within the coding region in the whole, xian, and geng populations. ***Denotes the significance of ANOVA at P < 0.001. Letters on histograms (a and b) are ranked by Duncan’s test at P < 0.05. Blue and yellow colors indicate Sanya and Beijing, respectively. (D) Frequencies of different haplotypes of the LOC_Os01g66120 in xian and geng subpopulations. (E) Spatio-temporal expression of LOC_Os01g66120 in various Nipponbare tissues throughout the entire growth period in the field [downloaded from RiceXPro (version 3.0)].
FIGURE 4
FIGURE 4
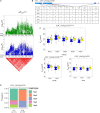
Haplotype analyses for the Dada and Daba of the LOC_Os02g15760 candidate gene at qDada2.1 and qDaba2.1. (A) Linkage disequilibrium (LD) block surrounding the peak on chromosome 2. Dashed lines indicate the candidate region for the peak. (B) Gene structure of LOC_Os02g15760 and DNA polymorphisms in that gene. (C) Boxplots for stomatal density on the adaxial surface (Dada) and the abaxial surface (Daba) based on haplotypes for the LOC_Os02g15760 using non-synonymous SNPs within the coding region in the whole, xian, and geng populations. ***Denotes the significance of ANOVA at P < 0.001. Letters on histograms (a and b) are ranked by Duncan’s test at P < 0.05. Blue and yellow colors indicate Sanya and Beijing, respectively. (D) Frequencies of different haplotypes of LOC_Os02g15760 in xian and geng subpopulations.
FIGURE 5
FIGURE 5
Haplotype analyses for the Wada and Waba of the LOC_Os07g41200 candidate gene at qWada7 and qWaba7. (A) Linkage disequilibrium (LD) block surrounding the peak on chromosome 7. Dashed lines indicate the candidate region for the peak. (B) Gene structure of LOC_Os07g41200 and DNA polymorphisms in that gene. (C) Boxplots for guard cell width on the adaxial surface (Wada) and the abaxial surface (Waba) based on haplotypes for LOC_Os07g41200 using non-synonymous SNPs within the coding region in the whole, xian, and geng populations. ** and ***denotes the significance of ANOVA at P < 0.01 and P < 0.001, respectively. Letters on histograms (a, b, and c) are ranked by Duncan’s test at P < 0.05. Blue and yellow colors indicate Sanya and Beijing, respectively. (D) Frequencies of different haplotypes of LOC_Os07g41200 in xian and geng subpopulations. (E) Spatio-temporal expression of LOC_Os07g41200 in various Nipponbare tissues throughout the entire growth period in the field [downloaded from RiceXPro (version 3.0)].
FIGURE 6
FIGURE 6
Haplotype analyses for Sada of LOC_Os02g34320 candidate gene at qSada2.2. (A) Linkage disequilibrium (LD) block surrounding the peak on chromosome 2. Dashed lines indicate the candidate region for the peak. (B) Gene structure of LOC_Os02g34320 and DNA polymorphisms in that gene. (C) Boxplots for stomatal size on the adaxial surface (Sada) based on haplotypes for LOC_Os02g34320 using non-synonymous SNPs within the coding region in the whole, xian and geng populations. ***Denotes significance of ANOVA at P < 0.001. Letters on histograms (a and b) are ranked by Duncan’s test at P < 0.05. Blue and yellow colors indicate Sanya and Beijing, respectively. (D) Frequencies of different haplotypes of LOC_Os02g34320 in xian and geng subpopulations.
FIGURE 7
FIGURE 7
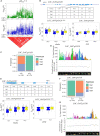
Haplotype analyses for the Saba of the LOC_Os07g43420 and LOC_Os07g43530 candidate genes at qSaba7.1. (A) Linkage disequilibrium (LD) block surrounding the peak on chromosome 7. Dashed lines indicate the candidate region for the peak. (B) Gene structure of LOC_Os07g43420, DNA polymorphisms in the gene, and boxplots for stomatal size on the abaxial leaf surface (Saba) based on haplotypes for LOC_Os07g43420 using non-synonymous SNPs within the coding region in the whole and xian populations. (C) Frequencies of different haplotypes of LOC_Os07g43420 in xian and geng subpopulations. (D) Spatio-temporal expression of LOC_Os07g43420 in various Nipponbare tissues throughout the entire growth period in the field [downloaded from RiceXPro (version 3.0)]. (E) Gene structure of LOC_Os07g43530, DNA polymorphisms in the gene, and boxplots for Saba based on haplotypes for LOC_Os07g43530 using non-synonymous SNPs within the coding region in the whole and geng populations. ***Denotes significance of ANOVA at P < 0.001. Letters on histograms (a and b) are ranked by Duncan’s test at P < 0.05. Blue and yellow colors indicate Sanya and Beijing, respectively. (F) Frequencies of different haplotypes of LOC_Os07g43530 in xian and geng subpopulations. (G) Spatio-temporal expression of LOC_Os07g43530 in various Nipponbare tissues throughout the entire growth period in the field [downloaded from RiceXPro (version 3.0)].

Similar articles

Cited by

References

    1. 3K RGP (2014). The 3,000 rice genomes project. Gigascience 3:7. - PMC - PubMed
    1. Adachi S., Yamamoto T., Nakae T., Yamashita M., Uchida M., Karimata R., et al. (2019). Genetic architecture of leaf photosynthesis in rice revealed by different types of reciprocal mapping populations. J. Exp. Bot. 70 5131–5144. 10.1093/jxb/erz303 - DOI - PMC - PubMed
    1. Bergmann D. C., Sack F. D. (2007). Stomatal development. Annu. Rev. Plant Biol. 58 163–181. - PubMed
    1. Buckley C. R., Caine R. S., Gray J. E. (2020). Pores for thought: can genetic manipulation of stomatal density protect future rice yields? Front. Plant Sci. 10:1783. 10.3389/fpls.2019.01783 - DOI - PMC - PubMed
    1. Caine R. S., Yin X., Sloan J., Harrison E. L., Mohammed U., Fulton T., et al. (2019). Rice with reduced stomatal density conserves water and has improved drought tolerance under future climate conditions. New Phytol. 221 371–384. 10.1111/nph.15344 - DOI - PMC - PubMed