. 2020 Jun 2:10:732.
doi: 10.3389/fonc.2020.00732. eCollection 2020.

Differential O- and Glycosphingolipid Glycosylation in Human Pancreatic Adenocarcinoma Cells With Opposite Morphology and Metastatic Behavior

Affiliations

Differential O- and Glycosphingolipid Glycosylation in Human Pancreatic Adenocarcinoma Cells With Opposite Morphology and Metastatic Behavior

Tao Zhang et al. Front Oncol. .

Abstract

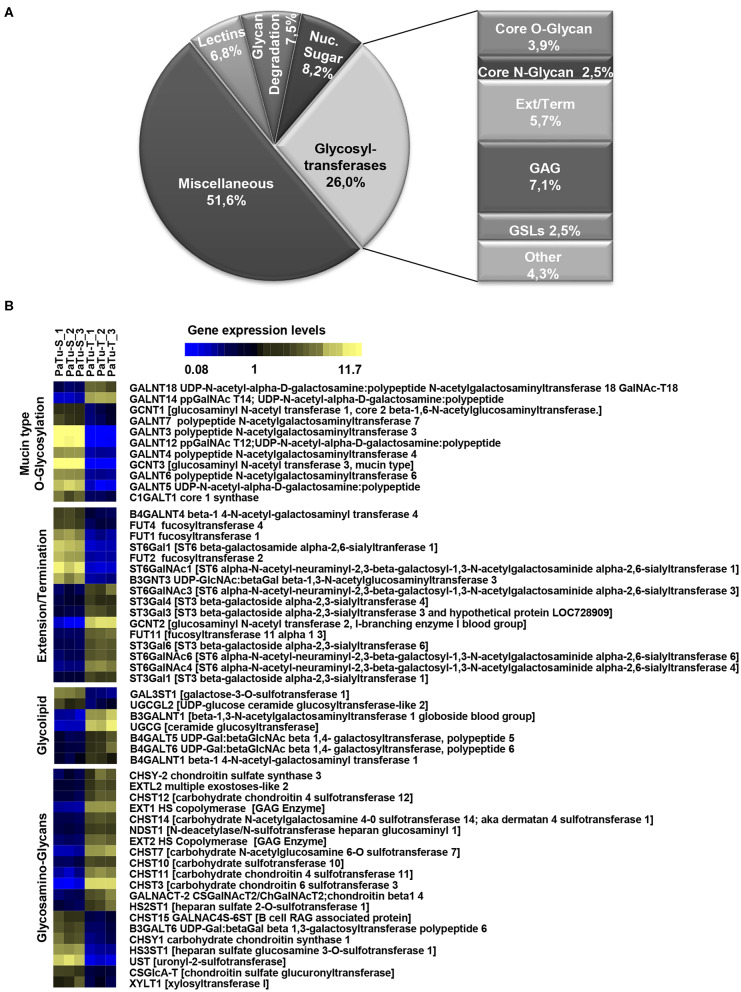
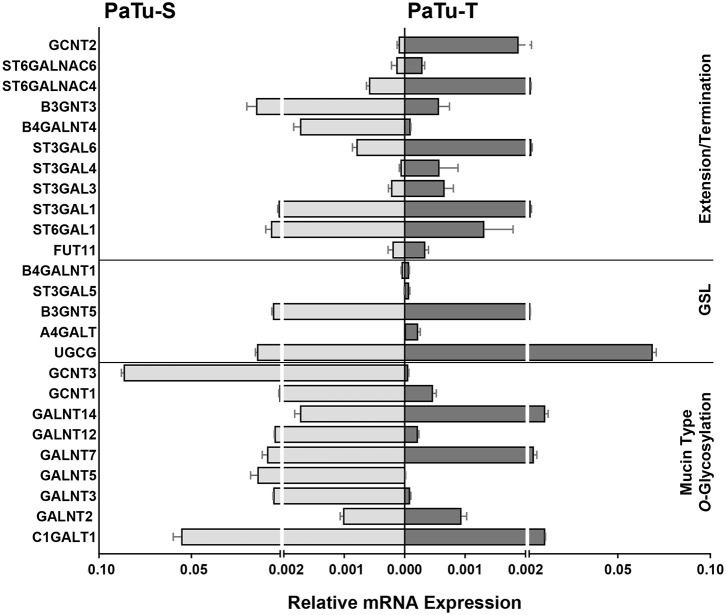
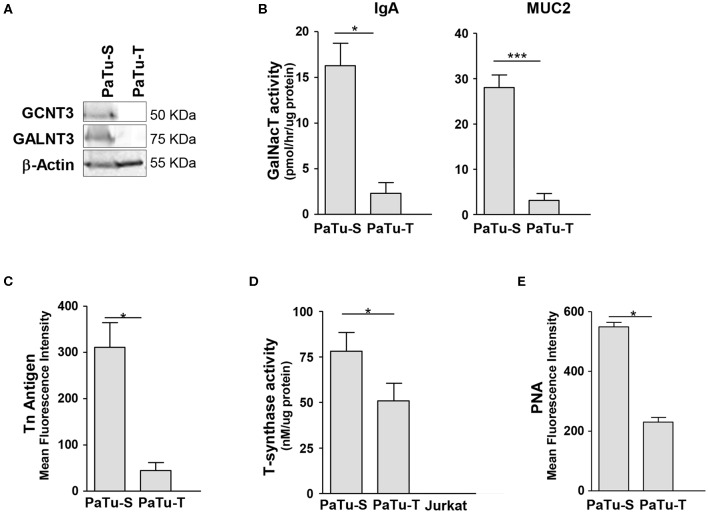
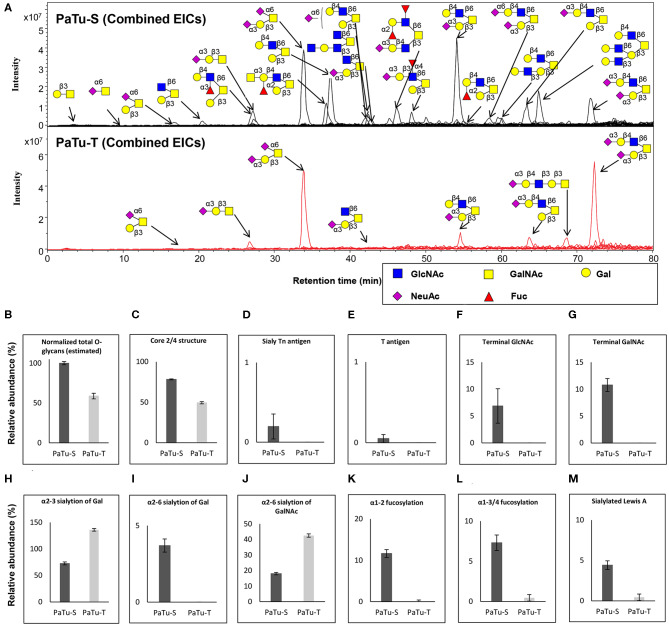
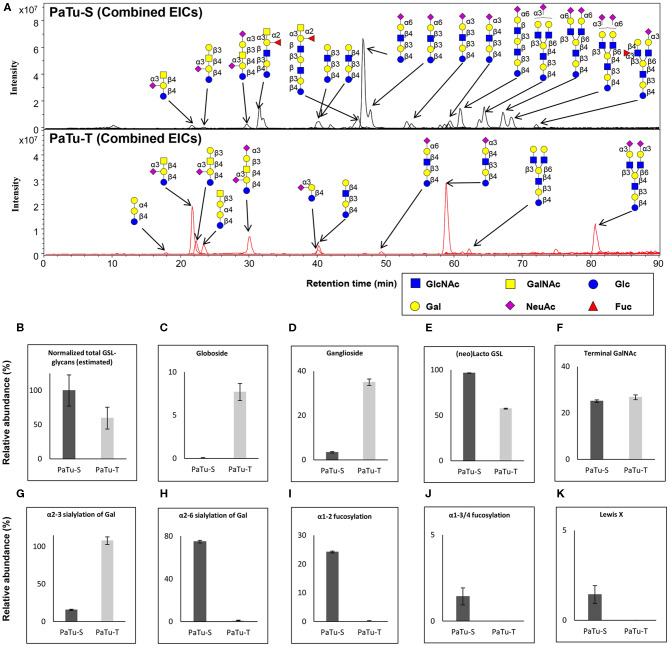
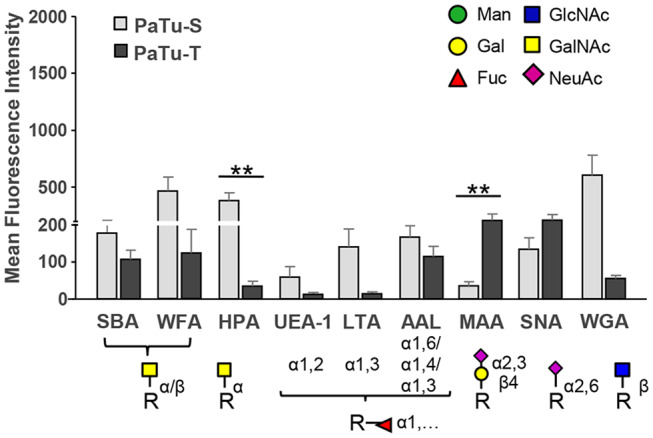
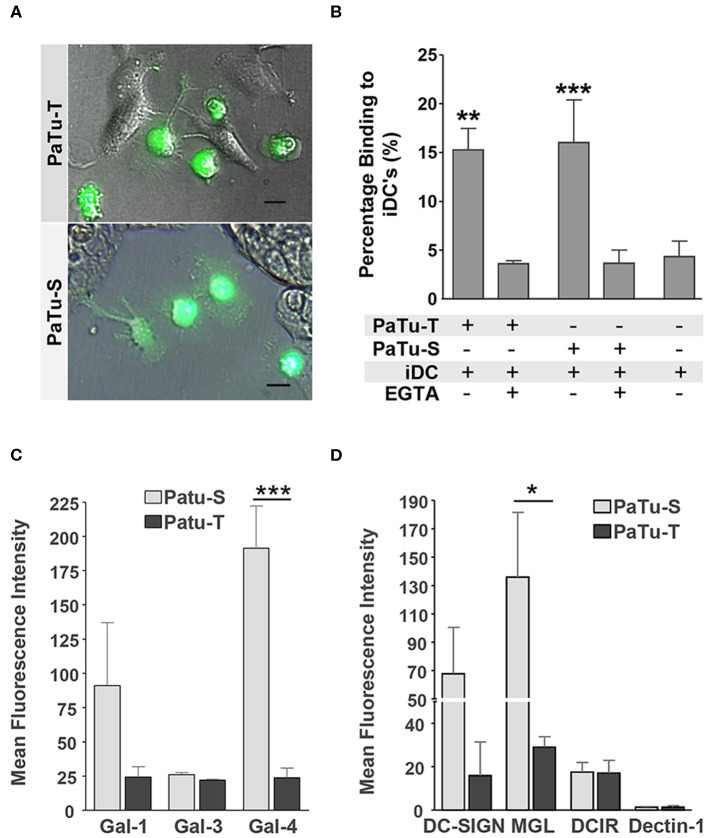
Changes in the glycosylation profile of cancer cells have been strongly associated with cancer progression. To increase our insights into the role of glycosylation in human pancreatic ductal adenocarcinoma (PDAC), we performed a study on O-glycans and glycosphingolipid (GSL) glycans of the PDAC cell lines Pa-Tu-8988T (PaTu-T) and Pa-Tu-8988S (PaTu-S). These cell lines are derived from the same patient, but show an almost opposite phenotype, morphology and capacity to metastasize, and may thus provide an attractive model to study the role of glycosylation in progression of PDAC. Gene-array analysis revealed that 24% of the glycosylation-related genes showed a ≥ 1.5-fold difference in expression level between the two cell lines. Subsequent validation of the data by porous graphitized carbon nano-liquid chromatography coupled to a tandem ion trap mass spectrometry and flow cytometry established major differences in O-glycans and GSL-glycans between the cell lines, including lower levels of T and sialylated Tn (sTn) antigens, neoexpression of globosides (Gb3 and Gb4), and higher levels of gangliosides in the mesenchymal-like PaTu-T cells compared to the epithelial-like PaTu-S. In addition, PaTu-S cells demonstrated a significantly higher binding of the immune-lectins macrophage galactose-type lectin and galectin-4 compared to PaTu-T. In summary, our data provide a comprehensive and differential glycan profile of two PDAC cell lines with disparate phenotypes and metastatic behavior. This will allow approaches to modulate and monitor the glycosylation of these PDAC cell lines, which opens up avenues to study the biology and metastatic behavior of PDAC.

Keywords: O-glycosylation; gene array analysis; glycosphingolipid (GSL) glycans; glycosylation; glycosyltransferase; pancreatic ductal adenocarcinoma.


Figures

Figure 1
Figure 1
Expression levels of glycosylation-related genes in PaTu-T and PaTu-S cell lines. (A) Glyco-gene transcripts with more than 1.5-fold difference in transcription levels between the two cell lines (281 from a total of 1,171 gene transcripts) clustered according to their putative function. The miscellaneous group includes genes related to glycosylation such as growth factors, receptors, interleukins, and adhesion molecules. Glycosyltransferases (GTs) comprises 73 of the 281 genes (26%) and are classified according to their assumed role in biosynthesis of target structures like O-glycan core, N-glycan core, GAG (glycosaminoglycan), GSLs (glycosphingolipids), Term (terminal modifications of various types of glycan structures), and Ext (extension of the various types of glycan structures). (B) TreeView of GT gene expression levels in PaTu-S and PaTu-T. Expression levels are depicted from low expressed genes (dark blue), through middle range gene expression (black) to highly expressed genes (yellow).
Figure 2
Figure 2
mRNA levels of selected GT genes in PaTu-S and PaTu-T. Validation by qRT-PCR of the expression of selected GT genes involved in O-glycan core and glycosphingolipid synthesis as well as in extension or termination of various glycan structures in PaTu-S (light gray bars) vs. PaTu-T cells (dark gray bars). mRNA levels are shown as relative abundance to the household reference gene GAPDH ± SEM of at least 3 independent experiments.
Figure 3
Figure 3
Biosynthesis of O-glycan structures. (A) Protein levels of GCNT3 and GALNT3 in PaTu-S and PaTu-T. Total proteins (150 μg) from whole-cell extracts were analyzed by Western blotting using anti-GCNT3 and anti-GALNT3 for detection of the respective proteins and anti-actin as the protein loading control. (B) ppGALNT activity was determined using whole cell lysates from PaTu-S and PaTu-T cells as enzyme source, UDP-[3H]-GalNAc as a donor, and MUC2 and IgA hinge region peptide as acceptor substrates. Radioactivity incorporated in the peptide-products was determined. (C) Binding of anti-Tn mAb to PaTu-S and PaTu-T cells as measured by flow cytometry, and shown as average MFI ± SEM of at least 3 independent experiments. (D) T-synthase activity was measured using whole cell lysates from PaTu-S, PaTu-T, and Jurkat cells (as negative control) as enzyme sources, UDP-Gal as a donor and GalNAc-α-(4-MU) as acceptor. Final product was measured by fluorescence (excitation 360 nm and emission at 460 nm). Results are given as average enzyme activity ± SEM of at least 3 independent experiments. (E) Binding of PNA recognizing terminal Galβ1-3GalNAc (T-antigen) to PaTu-S and PaTu-T cells as measured by flow cytometry, and shown as average MFI ± SEM of at least 3 independent experiments. *P ≤ 0.05 and ***P ≤ 0.001.
Figure 4
Figure 4
O-glycosylation analysis in PaTu-S and PaTu-T by PGC nano-LC-ESI-MS/MS. (A) Combined extracted ion chromatograms (EICs) of O-glycans derived from PaTu-S and PaTu-T cell lines. (B–M) Relative abundance of structural O-glycan classes derived from 0.5 million PaTu-S and PaTu-T cells on PGC nano-LC-ESI-MS/MS in negative ion mode (displayed as mean relative abundance plus standard deviation; N = 3). (B) Normalized total O-glycan content (estimated), (C) Core2/4 O-glycan structure, (D) Sialylated Tn antigen, (E) T antigen, (F) Terminal GlcNAc, (G) Terminal GalNAc, (H) α2,3-sialylation of Gal, (I) α2,6-sialylation of Gal, (J) α2,6-sialylation of GalNAc, (K) α1,2-fucosylation, (L) α1,3/4-fucosylation, and (M) sLeA.
Figure 5
Figure 5
GSL-glycosylation analysis in PaTu-S and PaTu-T by PGC nano-LC-ESI-MS/MS. (A) Combined EICs of GSL-glycans derived from PaTu-S and PaTu-T cell lines. (B–K) Relative abundance of structural GSL-glycan classes derived from 2 million PaTu-S and PaTu-T cells on PGC nano-LC-ESI-MS/MS in negative ion mode (displayed as mean relative abundance plus standard deviation; N = 3). (B) Normalized total GSL-glycans content (estimated), (C) Globosides, (D) Ganglioside, (E) nsGSLs, (F) Terminal GalNAc, (G) α2,3-sialylation of Gal, (H) α2,6-sialylation of Gal, (I) α1,2-fucosylation, (J) α1,3/4-fucosylation, and (K) Lewis X.
Figure 6
Figure 6
Binding of glycan-binding proteins to PaTu-S and PaTu-T cells. Lectin binding to PaTu-S and PaTu-T cells was measured by flow cytometry. The schematic glycan structures which are shown under the lectins used are common structures known to be recognized by the lectins. Results are shown as average MFI ± SEM. **P ≤ 0.01.
Figure 7
Figure 7
Immune recognition of glycan structures on PaTu-S and PaTu-T cells. (A) Interaction of immature DCs with PaTu-S and PaTu-T were visualized by fluorescence microscopy. Bar = 100 μm. (B) Binding of immature DCs to PaTu-S and PaTu-T in a cell adhesion assay, in the presence or absence of EGTA. Results are derived from 6 independent experiments using different donors and expressed as average percentage binding ± SEM. (C) Binding of recombinant human galectins Gal-1, Gal-3, and Gal-4 (5 μg/ml) to the PDAC cell lines was measured by flow cytometry. Results are given as average MFI ± SEM of at least 2 independent experiments. (D) Binding of Fc-chimeras of DC-SIGN, MGL, DCIR and Dectin-1 to PaTu-S and PaTu-T cells was measured by flow cytometry. Results are given as average MFI ± SEM of at least 3 independent experiments. *P ≤ 0.05, **P ≤ 0.01, and ***P ≤ 0.001.

References

    1. Siegel RL, Miller KD, Jemal A. Cancer statistics, 2018. CA Cancer J Clin. (2018) 68:7–30. 10.3322/caac.21442 - DOI - PubMed
    1. Pinho SS, Reis CA. Glycosylation in cancer: mechanisms and clinical implications. Nat Rev Cancer. (2015) 15:540–55. 10.1038/nrc3982 - DOI - PubMed
    1. Engle DD, Tiriac H, Rivera KD, Pommier A, Whalen S, Oni TE, et al. . The glycan CA19–9 promotes pancreatitis and pancreatic cancer in mice. Science. (2019) 364:1156–62. 10.1158/1538-7445.PANCA19-PR12 - DOI - PMC - PubMed
    1. Munkley J. The glycosylation landscape of pancreatic cancer. Oncol Lett. (2019) 17:2569–75. 10.3892/ol.2019.9885 - DOI - PMC - PubMed
    1. Wang M, Zhu J, Lubman DM, Gao C. Aberrant glycosylation and cancer biomarker discovery: a promising and thorny journey. Clin Chem Lab Med. (2019) 57:407–16. 10.1515/cclm-2018-0379 - DOI - PMC - PubMed