. 2020 Jun 4:8:363.
doi: 10.3389/fcell.2020.00363. eCollection 2020.

Characterization of Human Colon Organoids From Inflammatory Bowel Disease Patients

Affiliations

Characterization of Human Colon Organoids From Inflammatory Bowel Disease Patients

Emilie d'Aldebert et al. Front Cell Dev Biol. .

Abstract

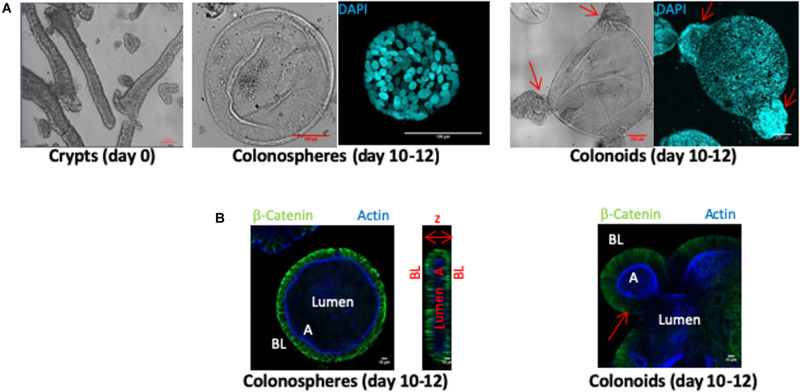
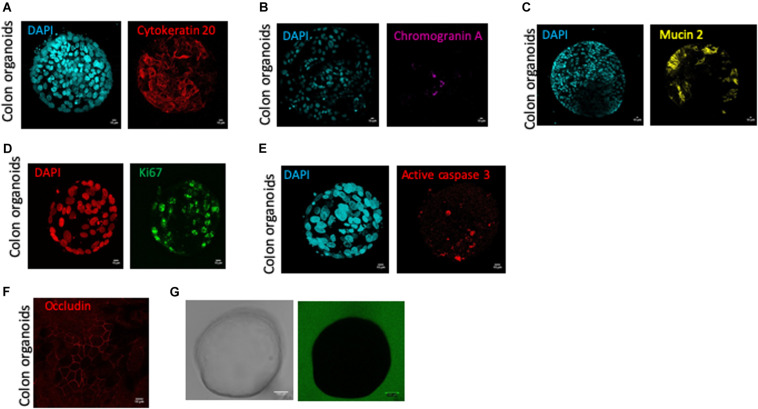
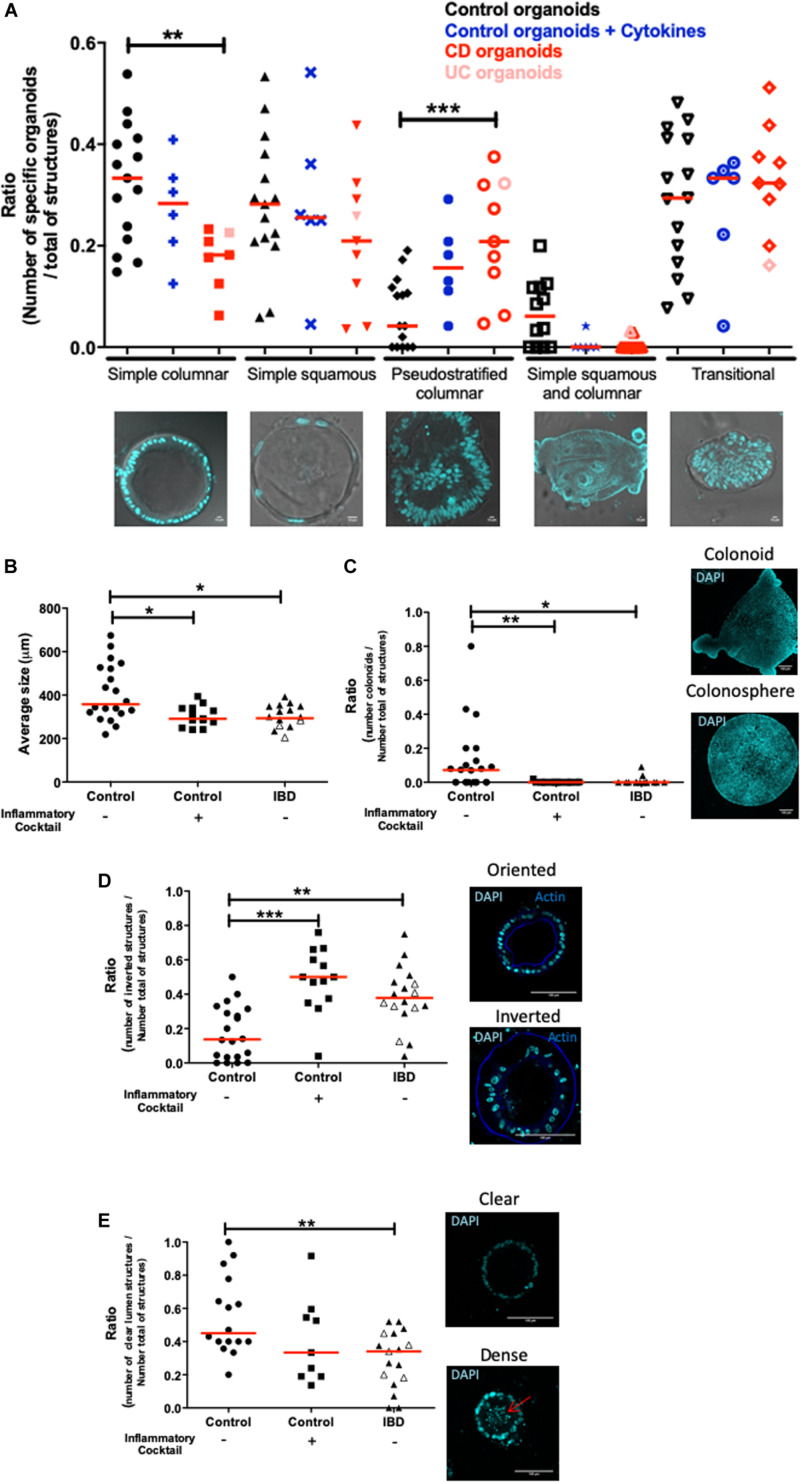
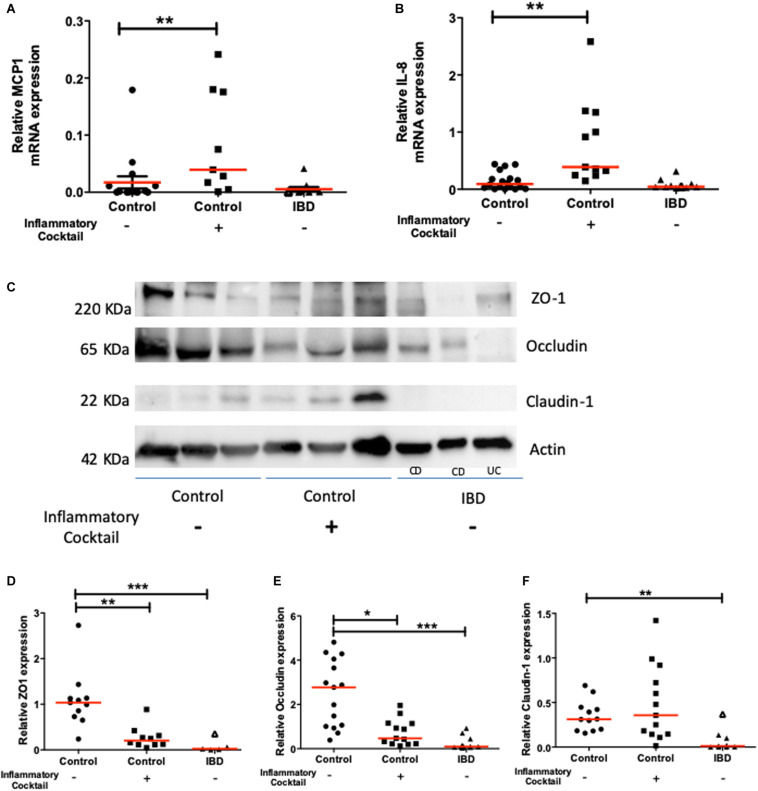
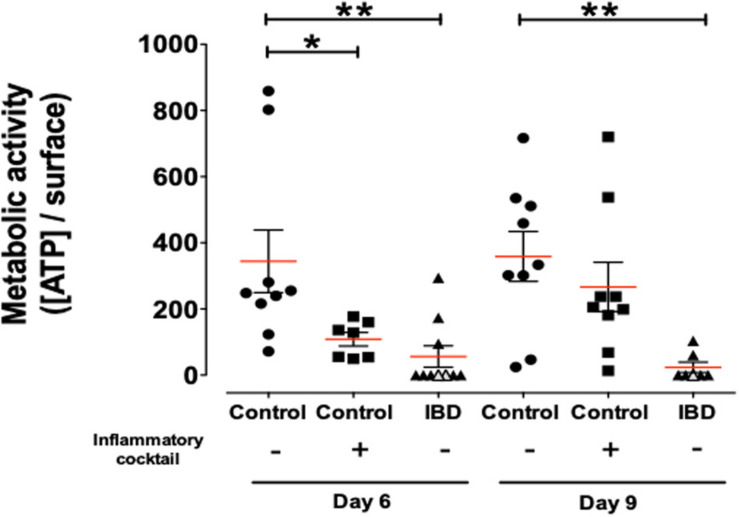
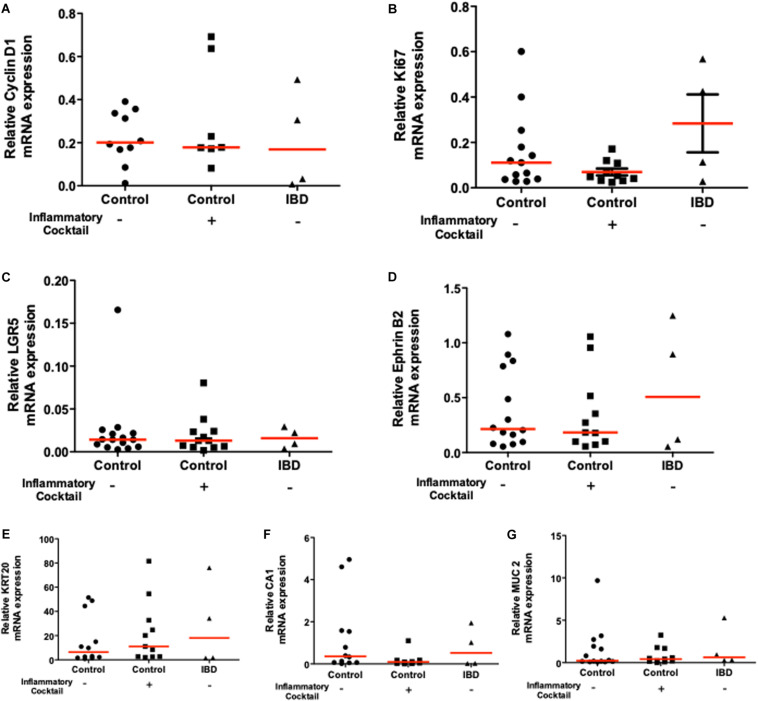
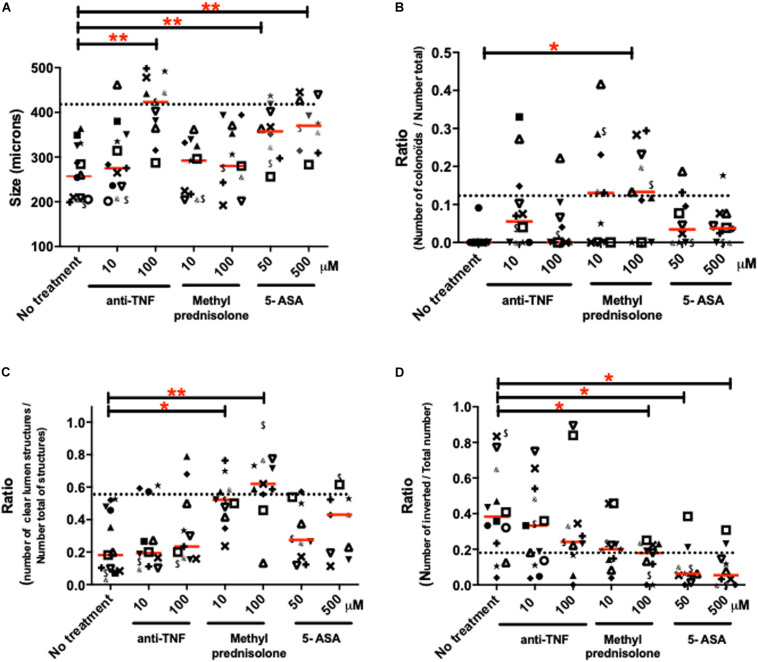
Inflammatory Bowel Diseases (IBD) are chronic inflammatory disorders, where epithelial defects drive, at least in part, some of the pathology. We reconstituted human intestinal epithelial organ, by using three-dimension culture of human colon organoids. Our aim was to characterize morphological and functional phenotypes of control (non-IBD) organoids, compared to inflamed organoids from IBD patients. The results generated describe the epithelial defects associated with IBD in primary organoid cultures, and evaluate the use of this model for pharmacological testing of anti-inflammatory approaches. Human colonic tissues were obtained from either surgical resections or biopsies, all harvested in non-inflammatory zones. Crypts were isolated from controls (non-IBD) and IBD patients and were cultured up to 12-days. Morphological (size, budding formation, polarization, luminal content), cell composition (proliferation, differentiation, immaturity markers expression), and functional (chemokine and tight junction protein expression) parameters were measured by immunohistochemistry, RT-qPCR or western-blot. The effects of inflammatory cocktail or anti-inflammatory treatments were studied in controls and IBD organoid cultures respectively. Organoid cultures from controls or IBD patients had the same cell composition after 10 to 12-days of culture, but IBD organoid cultures showed an inflammatory phenotype with decreased size and budding capacity, increased cell death, luminal debris, and inverted polarization. Tight junction proteins were also significantly decreased in IBD organoid cultures. Inflammatory cytokine cocktail reproduced this inflammatory phenotype in non-IBD organoids. Clinically used treatments (5-ASA, glucocorticoids, anti-TNF) reduced some, but not all parameters. Inflammatory phenotype is associated with IBD epithelium, and can be studied in organoid cultures. This model constitutes a reliable human pre-clinical model to investigate new strategies targeting epithelial repair.

Keywords: Crohn’s disease; inflammation; intestine; organoid; ulcerative colitis.


Figures

FIGURE 1
FIGURE 1
Ex vivo culture of human colon crypts from control patients. All images were acquired with SP8 confocal microscope at 20X and 63X objectives and analyzed by Image J software. (A) Isolated colon crypts at day 0 (left panel), and after 10–12 days of culture (middle and right panels) (scale bar 100 μm). Colored confocal pictures shows DAPI nuclei labeling (cyan) in a 3D reconstruction. Ten to twelve-days cultures showed either perfectly rounded structures called colonospheres (middle panel), or budding structures called colonoids (right panels). (B) β-catenin labeling (green) stained basolateral side (BL) and actin labeling (blue) stained apical side (A) of organoid epithelial cell monolayers, defining a central lumen, in cross section of colonospheres (left panel) and colonoids (right panel) (scale bar 10 μm). Arrows indicated buds.
FIGURE 2
FIGURE 2
Human colon organoid cell type composition and organoid sealing observation. Colonosphere cross sections are shown for each staining, and all images were acquired with SP8 confocal microscope at 63X objectives and analyzed by Image J software, after 10 days of culture of control organoids. Scale bar 10 μm (A–G). (A) DAPI nucleus (cyan) and cytokeratin 20 (red) staining for colonocytes, (B) DAPI nucleus (cyan) and chromogranin A (pink) staining for enteroendocrine cells, (C) DAPI nucleus (cyan), mucin 2 (yellow) staining for goblet cells, (D) DAPI nucleus (red) and ki67 (green) staining for proliferative cells, (E) DAPI nucleus (cyan) and active caspase 3 (red) staining for apoptotic cells, (F) Occludin staining (red) for tight junction labeling (G) One colonosphere cultivated in the presence of FITC-4 KDa (green) in bright field (left) or fluorescence (right) microscopy.
FIGURE 3
FIGURE 3
Morphological differences between control and inflamed colon organoids. All images were acquired with SP8 confocal microscope at 20X and 63X objectives and analyzed by Image J software. Red lines on graphs represented medians. P-value < 0.05 for *, <0.01 for **, and <0.005 for *** (One-way Anova, (Kruskal Wallis, and Dunns). (A) Morphological classification of cultured organoids in subgroups: simple columnar, simple squamous, pseudostratified columnar, simple squamous and columnar, and transitional. Control organoids derived from non-IBD patients were represented by black signs, blue signs represented control organoids treated with an inflammatory cocktail (IL-1β, TNF-α, and IL-6, at 10 ng/ml) from day 3 to day 10. Organoids derived from IBD patient tissues were represented in red: light red for Ulcerative Colitis, dark red for Crohn’s disease. An average of 20 organoids per patient was imaged and analyzed. Medians were represented by red lines. P-value < 0.05 (One way anova, Kruskal–Wallis, and Dunns). For (B–E), control organoids cultured from non-IBD patient tissues were represented by circles, square signs represented control organoids treated with an inflammatory cocktail (IL-1β, TNF-α, and IL-6, at 10 ng/ml) from day 3 to day 10, and organoids derived from IBD patient tissues were represented by triangles: open symbols for Ulcerative Colitis and closed symbols for Crohn’s disease. (B) Average size of organoids (μm). (C) The number of colonoids (budding structures) per total number of organoids (colonospheres plus colonoids each represented on right panel). (D) DAPI nucleus (cyan) and actin (blue) labeling were used in cross sections of organoid cultures (right panels) to visualize oriented (actin labeling toward the lumen) (right upper panel) and inverted organoids (actin labeling outwards the lumen) (right bottom panel) (scale bar 100 μm). On the left panel, the number of inverted organoids per total number of organoids (oriented plus inverted) was represented. (E) Nuclei labeling in cross sections of organoids to visualize clear (right upper panel) and dense (right bottom panel) lumen, the arrow showed the presence of debris in the lumen. The number of organoids with “clear” empty lumen per total number of organoids (empty, dense and without lumen) was represented.)
FIGURE 4
FIGURE 4
Chemokine (MCP-1 and CXCL-8) and tight junction molecule (ZO-1, Occludin and Claudin-1) mRNA and protein expression respectively, in controls (circles), controls exposed to an inflammatory cocktail (IL-1β, TNF-α, and IL-6, at 10 ng/ml) from day 3 to day 10 (squares) and organoids from IBD patients (triangles): ulcerative colitis (UC) patients (opened triangles) and Crohn’s disease (CD) patients (closed triangles). mRNA or proteins were extracted from organoids after 10 days of culture and data were normalized by GAPDH or actin expression respectively. Red lines represented medians. P-value < 0.05 for *, <0.01 for **, and <0.005 for ***(One-way Anova, Kruskal Wallis, and Dunns). (A) MCP1 mRNA expression. (B) IL-8 mRNA expression. (C) Representative Western-blot of the ZO-1, Occludin, Claudin-1 and Actin protein expression in tissues from 3 representative samples from controls (non-IBD), and IBD (Crohn’s disease: CD, and ulcerative colitis: UC) patients. (D) Quantification of ZO-1 relative protein expression. (E) Quantification of Occludin relative protein expression. (F) Quantification of Claudin relative protein expression.
FIGURE 5
FIGURE 5
Concentration of ATP release per surface of total organoids as a measure of metabolic activity/cell survival in organoids cultured for 6 and 9-days and harvested from control (non-IBD) patients (circles), control (non-IBD) organoids exposed to inflammatory cocktail (IL-1β, TNF-α, and IL-6, at 10 ng/ml) from day 3 to day 10 (squares) and organoids from IBD patients (triangles): ulcerative colitis (UC) patients (opened triangles) and Crohn’s disease (CD) patients (closed triangles). Red lines represented medians. P-value < 0.05 for * and <0.01 for ** (One-way Anova, Kruskal Wallis, and Dunns).
FIGURE 6
FIGURE 6
mRNA expression of proliferation markers [Cyclin D1 and Ki67 (A) and (B) respectively], immaturity markers [LGR5 and Ephrin B2 (C) and (D) respectively], and differentiation markers [Carbonic Anhydrase-1: CA1, Cytokeratine-20: KRT20 (E), Carbonic Anhydrase-1: CA1 (F), and Mucin 2: MUC2 (G)] in 10 days cultured organoids from controls (circles), control organoids exposed to inflammatory cocktail (IL-1β, TNF-α, and IL-6, at 10 ng/ml) from day 3 to day 10 of cultures (squares) and organoids from IBD patients (triangles): ulcerative colitis (UC) patients (opened triangles) and Crohn’s disease (CD) patients (closed triangles). Data were normalized to GAPDH. Red lines in graphs represented medians. No statistical significant difference was observed.
FIGURE 7
FIGURE 7
Effects of different treatments used in clinics on the morphological characteristics of IBD organoids. IBD organoids were derived from IBD patients. Crohn’s disease (CD) patient organoids were represented with closed symbols and keyboard symbols, while ulcerative colitis (UC) patient organoids were represented by opened symbols. One patient was represented by the same symbol in all figure panels. IBD organoids were treated from day 0 to day 10 with anti-TNF (Remicade) at 1, 10, and 100 μM, or methyl-prednisolone (Solupred) at 10 and 100 μM, or 5-ASA (Pentasa) at 50 and 500 μM. Where possible, an average of 20 organoids was studied per condition per patient. Medians were represented by red lines on graphs. Doted lines represented for each criteria, the median measured for this criteria in control (non-IBD), non-treated organoid cultures. Statistics were not performed on these graphs due to the low n number in some groups. (A) Average size of organoids (μm) (B) Number of colonoids (budding structures) per total number of organoids (colonospheres plus colonoïds) (C) Number of organoids with empty lumen per total number of organoids (empty, dense and without lumen). (D) Number of inverted organoids per total number of organoids (oriented plus inverted).

References

    1. Panaccione R., Ferraz J. G., Beck P. (2005). Advances in medical therapy of inflammatory bowel disease. Curr.Opin.Pharmacol. 5 566–572. - PubMed
    1. Neurath M. F. (2017). Current and emerging therapeutic targets for IBD. Nat Rev Gastroenterol Hepatol 14 269–278. 10.1038/nrgastro.2016.208 - DOI - PubMed
    1. Dave M., Loftus E. V. (2012). Mucosal healing in inflammatory bowel disease-a true paradigm of success? Gastroenterol Hepatol (N Y) 8 29–38. - PMC - PubMed
    1. Burisch J., Jess T., Martinato M., Lakatos P. L., EpiCom E. (2013). The burden of inflammatory bowel disease in Europe. J Crohns Colitis 7 322–337. 10.1016/j.crohns.2013.01.010 - DOI - PubMed
    1. Peyrin-Biroulet L., Ferrante M., Magro F., Campbell S., Franchimont D., Fidder H., et al. (2011). Results from the 2nd Scientific Workshop of the ECCO. I: Impact of mucosal healing on the course of inflammatory bowel disease. J Crohns Colitis 5 477–483. 10.1016/j.crohns.2011.06.009 - DOI - PubMed

LinkOut - more resources