. 2020 Jun 2:7:307.
doi: 10.3389/fvets.2020.00307. eCollection 2020.

A Novel Microchip Flow Chamber (Total Thrombus Analysis System) to Assess Canine Hemostasis

Affiliations

A Novel Microchip Flow Chamber (Total Thrombus Analysis System) to Assess Canine Hemostasis

Tomoko Iwanaga et al. Front Vet Sci. .

Abstract

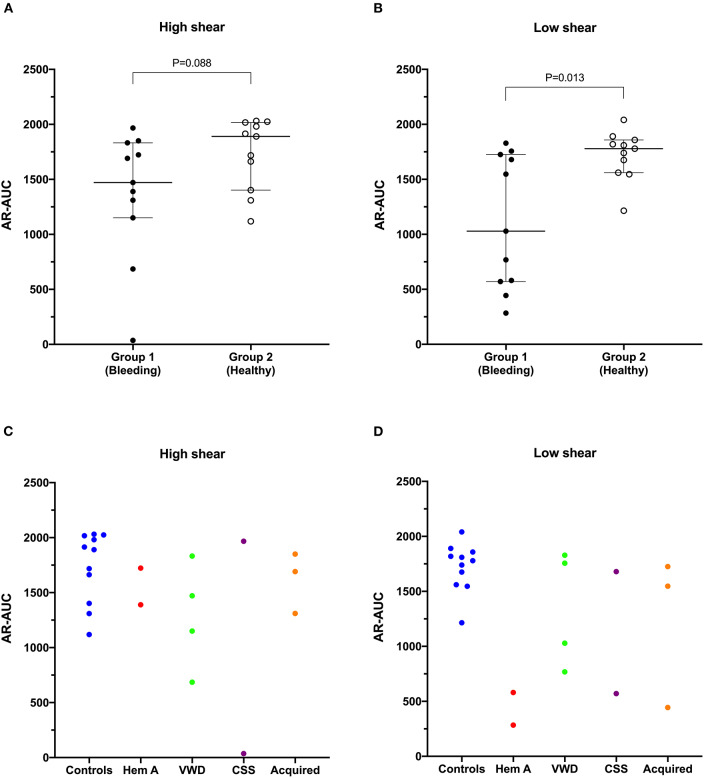
Hemorrhagic diseases are common in dogs. Current coagulation assays do not model all aspects of in vivo hemostasis and may not predict bleeding risk. The Total-Thrombus Analysis System (T-TAS) is a novel hemostasis assay system in which whole blood flows through microfluidic channels at defined shear rates to provide qualitative and quantitative evaluation of platelet function (PL-chip) and coagulation function (AR-chip). The present study evaluated the T-TAS in dogs with hereditary bleeding disorders and with acquired hemorrhagic syndromes (Group 1), and healthy controls (Group 2). Hereditary defects included von Willebrand's disease (VWD; n = 4), hemophilia A (n = 2), and canine Scott syndrome (n = 2). Acquired hemorrhagic disorders included neoplastic hemoperitoneum (n = 2) and acute hemorrhagic diarrhea syndrome (n = 1). Citrate anticoagulated samples were collected from diseased dogs (Group 1, n = 11) and controls (Group 2, n = 11) for coagulation screening tests, fibrinogen analyses, D-dimer concentration, antithrombin activity, von Willebrand Factor antigen, PFA-100 closure time (PFA-CT), and thromboelastography (TEG). Citrate and hirudin anticoagulated samples were used for T-TAS analyses at two shear rates. Qualitative thrombus formation in each chip was recorded using the T-TAS video camera. Numeric parameters, derived from the instrument software, included occlusion start time (OST; time to 10 kPa), occlusion time (OT; time to 60 kPa (PL-chip) or 80 kPa (AR-chip)), and area under the pressure curve (AUC). Correlations between continuous variables were evaluated by Spearman's rank. Continuous variables were compared between groups by Student's t-test or the Mann-Whitney U-test. Alpha was set at 0.05. In combined analyses of all dogs, significant correlations were identified between T-TAS variables, between the PFA-CT and PL-chip parameters and between TEG variables and AR-chip parameters. The prothrombin time correlated with the AR-chip AUC at both shear rates. In Group 1 dogs, the AR-chip AUC at low shear was significantly reduced compared with Group 2 dogs. Aberrant thrombus formation was seen in video images recorded from dogs with VWD and hemophilia A. The T-TAS AR-chip analysis distinguished dogs with bleeding risk compared to healthy controls. Initial evaluations of the T-TAS suggest it may aid characterization of hemostasis in patients at-risk of bleeding and assist with delineating bleeding phenotypes.

Keywords: Scott syndrome; bleeding; canine; flow chamber; hemophilia; platelets; von Willebrand's disease.


Figures

Figure 1
Figure 1
Dot plots comparing the prothrombin time (PT) (A) and activated partial thromboplastin time (aPTT) (B) values of Group 1 (bleeding risk) dogs with those of Group 2 (healthy control) dogs. Values for PT and aPTT in Group 1 were significantly longer than those in Group 2 (Student's t-test). Coagulation times from individual dogs are also plotted according to health status or disease process (C,D). CSS, canine Scott syndrome; Hem A, hemophilia A; VWD, von Willebrand's disease.
Figure 2
Figure 2
Scatterplots comparing key thromboelastography (TEG) and thrombin generation (TG) parameters among dogs in Group 1. (A) Reaction times (R-time) from the citrate recalcified (native) TEG assay. (B) Elastic shear modulus or clot strength values (F) from the citrate recalcified (native) TEG assay. (C) Reaction times from the tissue factor (TF) activated TEG assay. (D) Peak thrombin from the thrombin generation (TG) assay. (E) Endogenous thrombin potential (ETP) derived from the TG assay. CSS, canine Scott syndrome; Hem A, hemophilia A; VWD, von Willebrand's disease.
Figure 3
Figure 3
The area under the curve value derived from the AR-chip T-TAS assay was not significantly reduced in dogs in Group 1 compared to Group 2 at high shear (A). However, under low shear conditions (B), the area under the curve parameter from the AR-chip assay was significantly reduced in dogs at-risk of bleeding, compared to healthy controls (Mann-Whitney U-test). This suggests the low-shear assay may be more sensitive to the types of bleeding disorders present in the dogs in the study population than is the high-shear assay. Area under the curve values from individual dogs are also plotted according to health status or disease process (C,D). AUC, area the under the curve; CSS, canine Scott syndrome; Hem A, hemophilia A; VWD, von Willebrand's disease.
Figure 4
Figure 4
The T-TAS assay profiles and visualizations of thrombus formation in dogs with von Willebrand's disease (Type 1 carrier (normal VWF:Ag), Type 1 (low VWF:Ag), Type 3 (absent VWF:Ag)). (A) Pressure-time graphs from AR-chip and PL-chip assays of a healthy control and 3 dogs with VWD. In the AR-chip assays thrombus formation in dogs with type I VWD is delayed (graphs are right-shifted) particularly at high shear, and is incomplete in the dog with type 3 VWD at both high and low shear. The PL-chip profile from the type I VWD carrier dog was similar to that of the healthy control. In the PL-chip assay, the occlusion pressure failed to increase in VWF-deficient dogs (type 1 and type 3 VWD). (B) Representative images of thrombus formation within PL-chip microfluidic channels. Blood samples collected from healthy control dogs, a heterozygous carrier for a VWF mutation having normal VWF:Ag, and a dog lacking VWF protein (type 3 VWD) were flowed (from right to left) through the collagen coated microfluidic channels. Stable thrombi formed in samples from the control dog and VWD carrier resulting in occlusion of the microfluidic channels. In contrast, no thrombi formed within the PL-chip microchannels in the sample from the dog with type 3 VWD.
Figure 5
Figure 5
The T-TAS assay profiles and visualizations of thrombus formation in a dog with hemophilia A. (A) At high shear, the AR-chip occlusion profile was normal, while at low shear occlusion was delayed and the profile never reached the endpoint occlusion pressure. (B) Representative images of the single AR-chip flow channel with blood samples from a healthy control and a dog with hemophilia A flowed through the channel following activation by collagen and thromboplastin. The channel itself appears dark and the formed thrombi are white. Blood flow was from left to right. In these overview images of the whole AR-chip microchannel the thrombus build-up in the healthy control occurs early and causes complete occlusion. In contrast, in the dog with hemophilia A, thrombus formation can be seen only further down the flow channel and never became occlusive. This lack of occlusion occurred due to a residual flow path within the thrombus that developed due to ongoing blood flow through an unstable and incomplete blood clot.
Figure 6
Figure 6
Scatterplots of T-TAS parameters derived from platelet chip (PL-chip) assays against those derived from routine coagulation tests. (A,B) The closure time of the platelet function analyzer (PFA-CT) was negatively correlated with the PL-chip area under the curve (PL-AUC) at both low and mid-shear suggesting that long closure times are associated with limited platelet thrombus formation under flow conditions. (C,D) The endogenous thrombin potential (ETP) and the peak thrombin generation from the thrombin generation assay were both positively correlated with the area under the curve values from the PL-chip at medium shear (PLM-AUC) suggesting that thrombin generation contributes to thrombus formation in the T-TAS assay under these conditions.
Figure 7
Figure 7
Scatterplots of T-TAS parameters derived atherome chip (AR-chip) assays against those derived from routine coagulation tests. (A,B) The area under the curve (AR-AUC) was negatively correlated with the prothrombin time (PT) at both high and low shear suggesting that long clotting times are associated with reduced extent of thrombus formation under flow conditions. (C,D) The AR-AUC parameter also negatively correlated with the reaction time from the tissue factor and recalcification thromboelastography assays. (E,F) The endogenous thrombin potential (ETG) derived from the thrombin generation assay was negatively correlated with the occlusion start time, and positively correlated with the area under the curve suggesting that the rate and the extent of thrombus formation in the AR-chip assay are related to thrombin generation.

References

    1. Brainard BM, Brown AJ. Defects in coagulation encountered in small animal critical care. Vet Clin North Am Small Anim Pract. (2011) 41:783–803. 10.1016/j.cvsm.2011.04.001 - DOI - PubMed
    1. Brooks MB, Catalfamo JL. Current diagnostic trends in coagulation disorders among dogs and cats. Vet Clin North Am Small Anim Pract. (2013) 43:1349–72. 10.1016/j.cvsm.2013.07.003 - DOI - PubMed
    1. Hoffman M, Monroe DM, 3rd. A cell-based model of hemostasis. Thromb Haemost. (2001) 85:958–65. 10.1055/s-0037-1615947 - DOI - PubMed
    1. Brooks MB, Stokol T, Catalfamo JL. Comparative hemostasis: animal models and new hemostasis tests. Clin Lab Med. (2011) 31:139–59. 10.1016/j.cll.2010.10.009 - DOI - PubMed
    1. Herring J, McMichael M. Diagnostic approach to small animal bleeding disorders. Top Companion Anim Med. (2012) 27:73–80. 10.1053/j.tcam.2012.07.004 - DOI - PubMed