. 2019 Mar;1(2):180022.
doi: 10.1148/ryai.2019180022. Epub 2019 Mar 27.

Automated CT and MRI Liver Segmentation and Biometry Using a Generalized Convolutional Neural Network

Affiliations

Automated CT and MRI Liver Segmentation and Biometry Using a Generalized Convolutional Neural Network

Kang Wang et al. Radiol Artif Intell. 2019 Mar.

Abstract

Purpose: To assess feasibility of training a convolutional neural network (CNN) to automate liver segmentation across different imaging modalities and techniques used in clinical practice and apply this to enable automation of liver biometry.

Methods: We trained a 2D U-Net CNN for liver segmentation in two stages using 330 abdominal MRI and CT exams acquired at our institution. First, we trained the neural network with non-contrast multi-echo spoiled-gradient-echo (SGPR)images with 300 MRI exams to provide multiple signal-weightings. Then, we used transfer learning to generalize the CNN with additional images from 30 contrast-enhanced MRI and CT exams.We assessed the performance of the CNN using a distinct multi-institutional data set curated from multiple sources (n = 498 subjects). Segmentation accuracy was evaluated by computing Dice scores. Utilizing these segmentations, we computed liver volume from CT and T1-weighted (T1w) MRI exams, and estimated hepatic proton- density-fat-fraction (PDFF) from multi-echo T2*w MRI exams. We compared quantitative volumetry and PDFF estimates between automated and manual segmentation using Pearson correlation and Bland-Altman statistics.

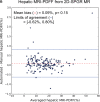
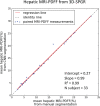
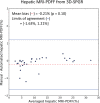
Results: Dice scores were 0.94 ± 0.06 for CT (n = 230), 0.95 ± 0.03 (n = 100) for T1w MR, and 0.92 ± 0.05 for T2*w MR (n = 169). Liver volume measured by manual and automated segmentation agreed closely for CT (95% limit-of-agreement (LoA) = [-298 mL, 180 mL]) and T1w MR (LoA = [-358 mL, 180 mL]). Hepatic PDFF measured by the two segmentations also agreed closely (LoA = [-0.62%, 0.80%]).

Conclusions: Utilizing a transfer-learning strategy, we have demonstrated the feasibility of a CNN to be generalized to perform liver segmentations across different imaging techniques and modalities. With further refinement and validation, CNNs may have broad applicability for multimodal liver volumetry and hepatic tissue characterization.


Conflict of interest statement

Disclosures of Conflicts of Interest: K.W. disclosed no relevant relationships. A.M. disclosed no relevant relationships. T.R. disclosed no relevant relationships. N.B. disclosed no relevant relationships. K.H. disclosed no relevant relationships. K.B. disclosed no relevant relationships. E.B. disclosed no relevant relationships. T.D. disclosed no relevant relationships. G.C. disclosed no relevant relationships. M.S.M. Activities related to the present article: disclosed no relevant relationships. Activities not related to the present article: is a consultant to Novo Nordisk; institution received a grant from Gilead; holds stock in Pfizer and divested stock in General Electric; travel and accommodations for meetings related to clinical trials are covered under lab services agreements with Gilead; is a consultant for Median and Kowa; institution has lab service agreements with Alexion, AstraZeneca, Bioclinica, Biomedical Systems, Bristol-Myers Squibb, Enanta, Galmed, General Electric, Genzyme, Gilead, Guerbet, Icon, Intercept, Janssen, NuSirt, Pfizer, Profil, Roche, Sanofi, Shire, Siemens, Synageva, Takeda, and Virtualscopics. Other relationships: disclosed no relevant relationships. R.L. Activities related to the present article: institution received grants from GE and Siemens. Activities not related to the present article: disclosed no relevant relationships. Other relationships: disclosed no relevant relationships. B.A.N. Activities related to the present article: disclosed no relevant relationships. Activities not related to the present article: is a consultant for Allergan, Arrowhead, Blade, Boehringer Ingleheim, BMS, Coherus, Consynance, Enanta, Gelesis, Gilead, Intercept, Lipocine, Madrigal, Medimmune, Merck, Metacrine, NGM, pHPharma, and Prometheus. Other relationships: disclosed no relevant relationships. C.B.S. Activities related to the present article: disclosed no relevant relationships. Activities not related to the present article: is on the advisory boards of AMRA, Guerbet, VirtualScopics, and Bristol Myers Squibb as a representative for the University of California board of regents; is a consultant for GE Healthcare, Bayer, AMRA, Fulcrum Therapeutics, IBM/Watson Health, and Exact Sciences as a representative for the University of California board of regents; institution received grants from of has grants pending with Gilead, GE Healthcare, Siemens, GE MRI, Bayer, GE Digital, GE US, ACR Innovation, Philips, and Celgene; University of California regents received money from GE Healthcare and Bayer for speaking services; received royalties from Wolters Kluwer; University of California regents received money from Medscape, Resoundant, and UpToDate Publishing for development of educational presentations or articles; institution has lab service agreements with Enanta, ICON Medical Imaging, Gilead, Shire, Virtualscopics, Intercept, Synageva, Takeda, Genzyme, Janssen, and NuSirt; has independent consulting contracts with Epigenomics and Arterys. Other relationships: disclosed no relevant relationships. A.H. Activities related to the present article: disclosed no relevant relationships. Activities not related to the present article: institution received a grant from GE Healthcare; is a founder, shareholder, and consultant for Arterys; is a speaker for and received grant funding from Bayer. Other relationships: disclosed no relevant relationships.

Figures

Figure 1:
Figure 1:
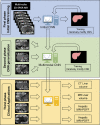
Overview of the study design, which comprised three phases. In the first phase, we trained with unenhanced low-flip-angle two-dimensional (2D) multiecho spoiled gradient-echo (SPGR) MR images with variable T2* weighting (n = 300) with multiple echo times (TEs) to be robust against different signal weightings. In the second phase, we used transfer learning to generalize our convolutional neural network (CNN) to other imaging modalities by using multimodal image data (30 2D SPGR MRI datasets, 10 contrast-enhanced CT datasets, 20 contrast-enhanced T1-weighted hepatobiliary phase MRI datasets). In the third phase, we assessed the accuracy of liver segmentation, liver volumetry, and hepatic proton density fat fraction (PDFF) estimation. 3D-SPGR = unenhanced low-flip-angle three-dimensional multiecho spoiled gradient-echo MRI with variable T2* weighting; CE/NC-CT = contrast-enhanced and unenhanced CT; HBP-T1w MR = contrast-enhanced T1-weighted MRI in the hepatobiliary phase performed about 20 minutes after injection of 0.025 mmol per kilogram of body weight gadoxetate disodium, a hepatobiliary agent.
Figure 2:
Figure 2:
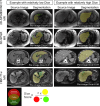
Examples of multimodal convolutional neural network (CNN) liver segmentation results for each imaging modality. Each row represents example images and resulting segmentation from a specific imaging modality. Two examples are shown for each modality, one with relatively low Dice score and one with relatively high Dice score. Segmentation results are color coded, as shown in the Venn diagram. The color-coded labels give a sense of what the numeric Dice score represents. The definition of Dice score between the automated and manual method is also shown. HBP-T1w-MRI = contrast-enhanced T1-weighted MRI in the hepatobiliary phase performed about 20 minutes after injection of 0.025 mmol/kg gadoxetate disodium, a hepatobiliary agent; CE/NC CT = contrast-enhanced or noncontrast CT; 3D-SPGR = unenhanced low-flip-angle three-dimensional multiecho spoiled gradient-echo MRI with variable T2* weighting; 2D-SPGR = unenhanced low-flip-angle two-dimensional multiecho spoiled gradient-echo MRI with variable T2* weighting.
Figure 3:
Figure 3:
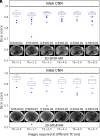
Liver segmentation accuracy of the initial convolutional neural network (CNN) on images with different technical parameters (ie, echo time [TE]) and MR techniques (unenhanced low-flip-angle two-dimensional multiecho spoiled gradient-echo MRI with variable T2* weighting [2D-SPGR] vs unenhanced low-flip-angle three-dimensional multiecho spoiled gradient-echo MRI with variable T2* weighting [3D-SPGR]). Each boxplot summarizes Dice scores on image series acquired with the same imaging technique and TE. Dices scores for image series acquired with 2D SPGR and 3D SPGR MRI sequences were plotted separately in, A, and, B, respectively. A representative MR image acquired by using each TE and MR technique is shown along with the mean Dice score ± standard deviation.
Figure 4a:
Figure 4a:
Liver segmentation accuracy for (a) the initial convolutional neural network (CNN) and (b) the multimodal CNN. (c) Segmentation accuracy for the multimodal CNN trained by using one to 10 CT image sets. (d) Segmentation accuracy for the multimodal CNN trained using one to 20 contrast-enhanced hepatobiliary phase T1-weighted MRI datasets (HBP-T1w-MRI). 3D-SPGR = unenhanced low-flip-angle three-dimensional multiecho spoiled gradient-echo MRI with variable T2* weighting; 2D-SPGR = unenhanced low-flip-angle two-dimensional multiecho spoiled gradient-echo MRI with variable T2* weighting; CE/NC-CT = contrast-enhanced or unenhanced CT.
Figure 4b:
Figure 4b:
Liver segmentation accuracy for (a) the initial convolutional neural network (CNN) and (b) the multimodal CNN. (c) Segmentation accuracy for the multimodal CNN trained by using one to 10 CT image sets. (d) Segmentation accuracy for the multimodal CNN trained using one to 20 contrast-enhanced hepatobiliary phase T1-weighted MRI datasets (HBP-T1w-MRI). 3D-SPGR = unenhanced low-flip-angle three-dimensional multiecho spoiled gradient-echo MRI with variable T2* weighting; 2D-SPGR = unenhanced low-flip-angle two-dimensional multiecho spoiled gradient-echo MRI with variable T2* weighting; CE/NC-CT = contrast-enhanced or unenhanced CT.
Figure 4c:
Figure 4c:
Liver segmentation accuracy for (a) the initial convolutional neural network (CNN) and (b) the multimodal CNN. (c) Segmentation accuracy for the multimodal CNN trained by using one to 10 CT image sets. (d) Segmentation accuracy for the multimodal CNN trained using one to 20 contrast-enhanced hepatobiliary phase T1-weighted MRI datasets (HBP-T1w-MRI). 3D-SPGR = unenhanced low-flip-angle three-dimensional multiecho spoiled gradient-echo MRI with variable T2* weighting; 2D-SPGR = unenhanced low-flip-angle two-dimensional multiecho spoiled gradient-echo MRI with variable T2* weighting; CE/NC-CT = contrast-enhanced or unenhanced CT.
Figure 4d:
Figure 4d:
Liver segmentation accuracy for (a) the initial convolutional neural network (CNN) and (b) the multimodal CNN. (c) Segmentation accuracy for the multimodal CNN trained by using one to 10 CT image sets. (d) Segmentation accuracy for the multimodal CNN trained using one to 20 contrast-enhanced hepatobiliary phase T1-weighted MRI datasets (HBP-T1w-MRI). 3D-SPGR = unenhanced low-flip-angle three-dimensional multiecho spoiled gradient-echo MRI with variable T2* weighting; 2D-SPGR = unenhanced low-flip-angle two-dimensional multiecho spoiled gradient-echo MRI with variable T2* weighting; CE/NC-CT = contrast-enhanced or unenhanced CT.
Figure 5a:
Figure 5a:
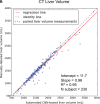
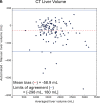
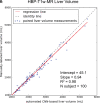
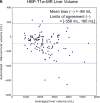
Agreement of liver volume assessments between convolutional neural network (CNN)−predicted and manual liver segmentation (third phase and clinical applications are shown in Fig 1). (a) Linear regression and (b) Bland-Altman analysis of liver volume assessments from contrast-enhanced and unenhanced CT. (c) Linear regression and (d) Bland-Altman analysis of liver volume estimates from contrast-enhanced hepatobiliary phase T1-weighted MRI (HBP-T1w-MRI). There are a few outliers for both CT and HBP-T1w-MR. These represent cases in which the multimodal CNN failed to automatically recognize and segment a portion of the liver; thus, the automated liver volume measurements are significantly lower than the manual liver volume measurements. A few cases of failed segmentation are shown in Figure E2 (supplement).
Figure 5b:
Figure 5b:
Agreement of liver volume assessments between convolutional neural network (CNN)−predicted and manual liver segmentation (third phase and clinical applications are shown in Fig 1). (a) Linear regression and (b) Bland-Altman analysis of liver volume assessments from contrast-enhanced and unenhanced CT. (c) Linear regression and (d) Bland-Altman analysis of liver volume estimates from contrast-enhanced hepatobiliary phase T1-weighted MRI (HBP-T1w-MRI). There are a few outliers for both CT and HBP-T1w-MR. These represent cases in which the multimodal CNN failed to automatically recognize and segment a portion of the liver; thus, the automated liver volume measurements are significantly lower than the manual liver volume measurements. A few cases of failed segmentation are shown in Figure E2 (supplement).
Figure 5c:
Figure 5c:
Agreement of liver volume assessments between convolutional neural network (CNN)−predicted and manual liver segmentation (third phase and clinical applications are shown in Fig 1). (a) Linear regression and (b) Bland-Altman analysis of liver volume assessments from contrast-enhanced and unenhanced CT. (c) Linear regression and (d) Bland-Altman analysis of liver volume estimates from contrast-enhanced hepatobiliary phase T1-weighted MRI (HBP-T1w-MRI). There are a few outliers for both CT and HBP-T1w-MR. These represent cases in which the multimodal CNN failed to automatically recognize and segment a portion of the liver; thus, the automated liver volume measurements are significantly lower than the manual liver volume measurements. A few cases of failed segmentation are shown in Figure E2 (supplement).
Figure 5d:
Figure 5d:
Agreement of liver volume assessments between convolutional neural network (CNN)−predicted and manual liver segmentation (third phase and clinical applications are shown in Fig 1). (a) Linear regression and (b) Bland-Altman analysis of liver volume assessments from contrast-enhanced and unenhanced CT. (c) Linear regression and (d) Bland-Altman analysis of liver volume estimates from contrast-enhanced hepatobiliary phase T1-weighted MRI (HBP-T1w-MRI). There are a few outliers for both CT and HBP-T1w-MR. These represent cases in which the multimodal CNN failed to automatically recognize and segment a portion of the liver; thus, the automated liver volume measurements are significantly lower than the manual liver volume measurements. A few cases of failed segmentation are shown in Figure E2 (supplement).
Figure 6a:
Figure 6a:
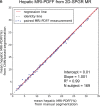
Agreement of hepatic proton density fat fraction (PDFF) assessments between convolutional neural network (CNN)−predicted and manual liver segmentation. (a) Linear regression and (b) Bland-Altman analysis of hepatic PDFF estimations computed from multiecho unenhanced low-flip-angle two-dimensional multiecho spoiled gradient-echo MRI with variable T2* weighting (2D-SPGR) MR images. (c) Linear regression and (d) Bland-Altman analysis of hepatic PDFF estimations from multiecho unenhanced low-flip-angle three-dimensional multiecho spoiled gradient-echo MRI with variable T2* weighting (3D-SPGR) MR images.
Figure 6b:
Figure 6b:
Agreement of hepatic proton density fat fraction (PDFF) assessments between convolutional neural network (CNN)−predicted and manual liver segmentation. (a) Linear regression and (b) Bland-Altman analysis of hepatic PDFF estimations computed from multiecho unenhanced low-flip-angle two-dimensional multiecho spoiled gradient-echo MRI with variable T2* weighting (2D-SPGR) MR images. (c) Linear regression and (d) Bland-Altman analysis of hepatic PDFF estimations from multiecho unenhanced low-flip-angle three-dimensional multiecho spoiled gradient-echo MRI with variable T2* weighting (3D-SPGR) MR images.
Figure 6c:
Figure 6c:
Agreement of hepatic proton density fat fraction (PDFF) assessments between convolutional neural network (CNN)−predicted and manual liver segmentation. (a) Linear regression and (b) Bland-Altman analysis of hepatic PDFF estimations computed from multiecho unenhanced low-flip-angle two-dimensional multiecho spoiled gradient-echo MRI with variable T2* weighting (2D-SPGR) MR images. (c) Linear regression and (d) Bland-Altman analysis of hepatic PDFF estimations from multiecho unenhanced low-flip-angle three-dimensional multiecho spoiled gradient-echo MRI with variable T2* weighting (3D-SPGR) MR images.
Figure 6d:
Figure 6d:
Agreement of hepatic proton density fat fraction (PDFF) assessments between convolutional neural network (CNN)−predicted and manual liver segmentation. (a) Linear regression and (b) Bland-Altman analysis of hepatic PDFF estimations computed from multiecho unenhanced low-flip-angle two-dimensional multiecho spoiled gradient-echo MRI with variable T2* weighting (2D-SPGR) MR images. (c) Linear regression and (d) Bland-Altman analysis of hepatic PDFF estimations from multiecho unenhanced low-flip-angle three-dimensional multiecho spoiled gradient-echo MRI with variable T2* weighting (3D-SPGR) MR images.

Similar articles

Cited by

References

    1. Kessler LG, Barnhart HX, Buckler AJ, et al. . The emerging science of quantitative imaging biomarkers terminology and definitions for scientific studies and regulatory submissions. Stat Methods Med Res 2015;24(1):9–26. - PubMed
    1. Summers RM. Progress in Fully automated abdominal CT interpretation. AJR Am J Roentgenol 2016;207(1):67–79. - PMC - PubMed
    1. Joo S, Yang YS, Moon WK, Kim HC. Computer-aided diagnosis of solid breast nodules: use of an artificial neural network based on multiple sonographic features. IEEE Trans Med Imaging 2004;23(10):1292–1300. - PubMed
    1. Doi K. Computer-aided diagnosis in medical imaging: historical review, current status and future potential. Comput Med Imaging Graph 2007;31(4-5):198–211. - PMC - PubMed
    1. Farraher SW, Jara H, Chang KJ, Hou A, Soto JA. Liver and spleen volumetry with quantitative MR imaging and dual-space clustering segmentation. Radiology 2005;237(1):322–328. - PubMed