. 2020 Oct 9;45(7):533-539.
doi: 10.1093/chemse/bjaa044.

Optogenetic Activation of Type III Taste Cells Modulates Taste Responses

Affiliations

Optogenetic Activation of Type III Taste Cells Modulates Taste Responses

Aurelie Vandenbeuch et al. Chem Senses. .

Abstract

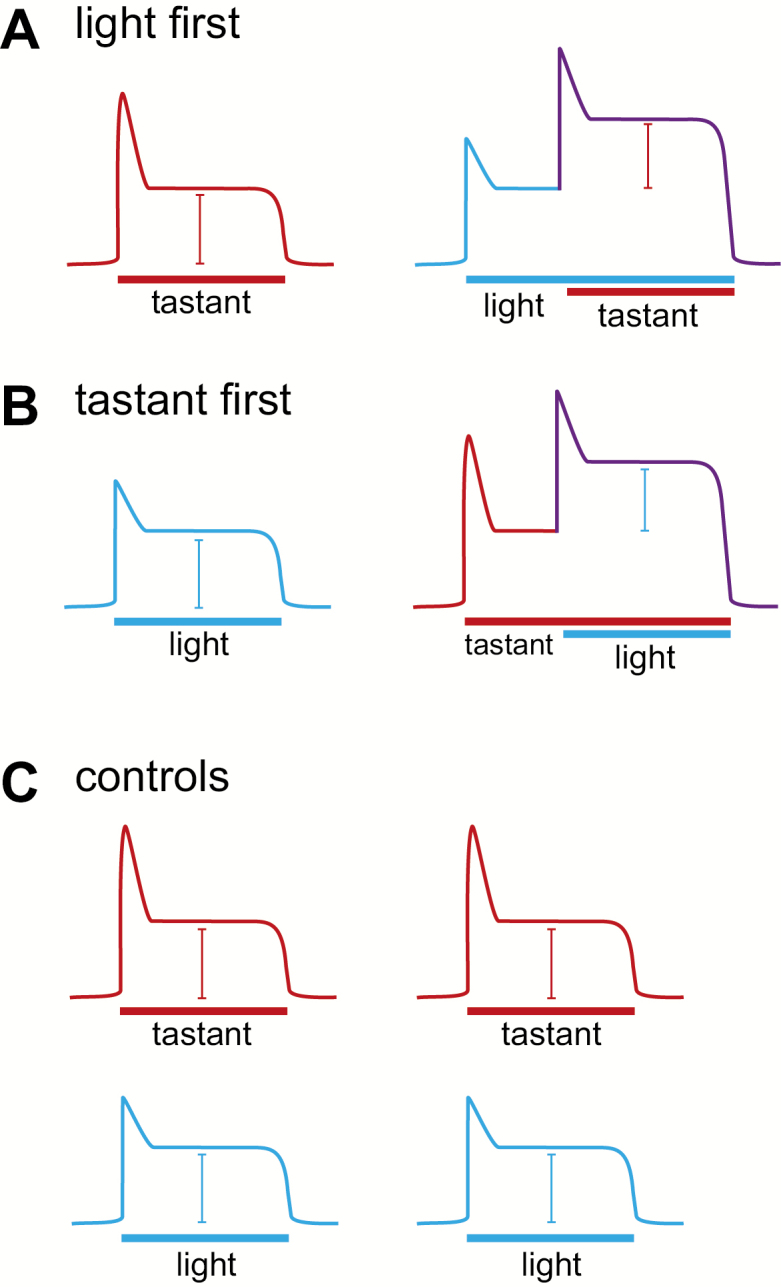
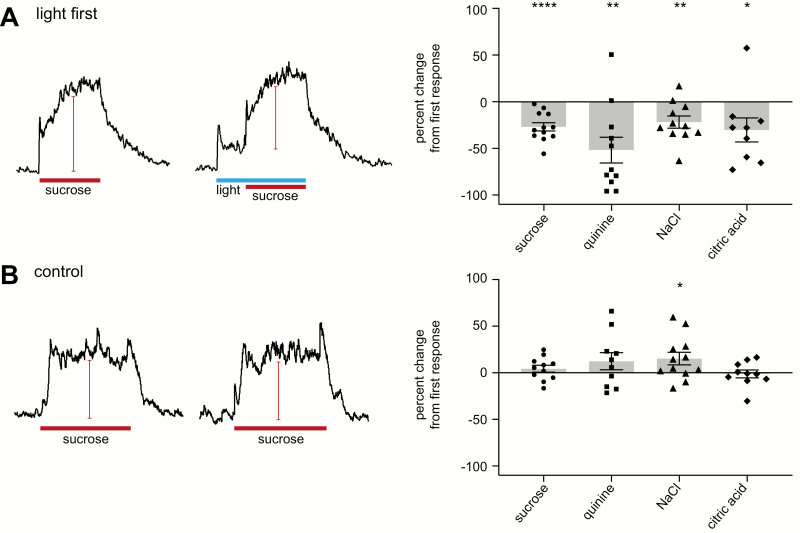
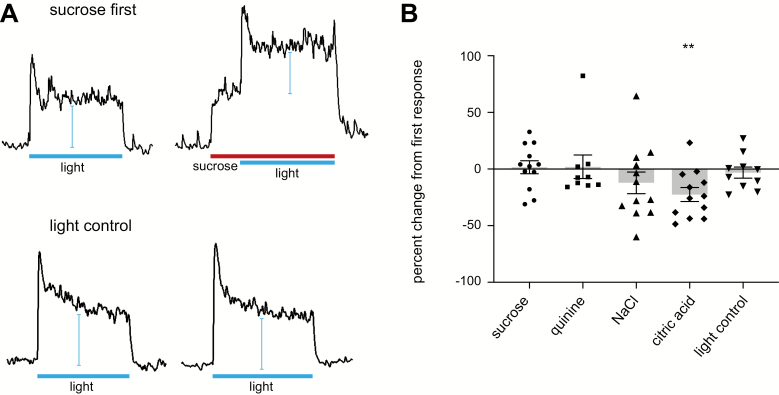
Studies have suggested that communication between taste cells shapes the gustatory signal before transmission to the brain. To further explore the possibility of intragemmal signal modulation, we adopted an optogenetic approach to stimulate sour-sensitive (Type III) taste cells using mice expressing Cre recombinase under a specific Type III cell promoter, Pkd2l1 (polycystic kidney disease-2-like 1), crossed with mice expressing Cre-dependent channelrhodopsin (ChR2). The application of blue light onto the tongue allowed for the specific stimulation of Type III cells and circumvented the nonspecific effects of chemical stimulation. To understand whether taste modality information is preprocessed in the taste bud before transmission to the sensory nerves, we recorded chorda tympani nerve activity during light and/or chemical tastant application to the tongue. To assess intragemmal modulation, we compared nerve responses to various tastants with or without concurrent light-induced activation of the Type III cells. Our results show that light significantly decreased taste responses to sweet, bitter, salty, and acidic stimuli. On the contrary, the light response was not consistently affected by sweet or bitter stimuli, suggesting that activation of Type II cells does not affect nerve responses to stimuli that activate Type III cells.

Keywords: ATP; channelrhodopsin; chorda tympani; mice; serotonin; taste buds.


Figures

Figure 1.
Figure 1.
Stimulation paradigms. (A) Experiment 1: a tastant was first applied on the tongue. The same tastant was reapplied after the light was turned on for 10 s. The light was kept on while the tastant was applied. The amplitude of the tastant responses was compared in the absence or presence of light. (B) Experiment 2: the light was first applied on the tongue. The same light was reapplied after a tastant was applied on the tongue for 10 s. The amplitude of the light responses was compared in the absence or presence of a tastant. (C) Control experiment: the same tastant or light were applied repeatedly on the tongue. Response amplitudes were compared.
Figure 2.
Figure 2.
Effect of light on taste responses. (A) Representative integrated chorda tympani response to sucrose 500 mM in the absence or presence of light in the same animal. Bars for sucrose application represent 30 s. Bar for light application represents 40 s. Graph displays the percentage change between taste responses with or without light for sucrose 500 mM, quinine 10 mM, NaCl 100 mM, and citric acid 10 mM (right). (B) Representative integrated chorda tympani response to sucrose 500 mM repeated on the same animal. Bars for sucrose application represent 30 s. Graph shows percentage change between taste responses repeated during the experiment (right). For both (A) and (B) graphs, each dot represents a different animal for each tastant. Bars represent averaged response ± standard error of the mean. All responses were normalized to responses to NH4Cl 100 mM. Asterisks represent statistical significance levels based on a one-sample t-tests: *P < 0.05; **P < 0.01; ***P < 0.001.
Figure 3.
Figure 3.
Effect of tastants on light responses. (A) Representative integrated chorda tympani response to light in the absence or presence of sucrose 500 mM in the same animal (above), and chorda tympani responses to light repeated on the same animal (below). Bars for light application represent 30 s, bar for sucrose application represents 40 s. (B) Percentage change between light responses preceded by sucrose 500 mM, quinine 10 mM, NaCl 100 mM, citric acid 10 mM, and no tastant. Each dot represents a different animal for each tastant. Bars represent averaged percentage change ± standard error of the mean. Responses were normalized to NH4Cl 100 mM. Asterisks represent statistical significance levels based on a one-sample t-tests: **P < 0.01.

References

    1. Bystrova MF, Yatzenko YE, Fedorov IV, Rogachevskaja OA, Kolesnikov SS. 2006. P2Y isoforms operative in mouse taste cells. Cell Tissue Res. 323(3):377–382. - PubMed
    1. Cao Y, Zhao FL, Kolli T, Hivley R, Herness S. 2009. GABA expression in the mammalian taste bud functions as a route of inhibitory cell-to-cell communication. Proc Natl Acad Sci USA. 106(10):4006–4011. - PMC - PubMed
    1. Dvoryanchikov G, Huang YA, Barro-Soria R, Chaudhari N, Roper SD. 2011. GABA, its receptors, and GABAergic inhibition in mouse taste buds. J Neurosci. 31(15):5782–5791. - PMC - PubMed
    1. Finger TE, Danilova V, Barrows J, Bartel DL, Vigers AJ, Stone L, Hellekant G, Kinnamon SC. 2005. ATP signaling is crucial for communication from taste buds to gustatory nerves. Science. 310(5753):1495–1499. - PubMed
    1. Formaker BK, Lin H, Hettinger TP, Frank ME. 2009. Responses of the hamster chorda tympani nerve to sucrose+acid and sucrose+citrate taste mixtures. Chem Senses. 34(7):607–616. - PMC - PubMed

Publication types

MeSH terms

LinkOut - more resources