. 2020 Sep;44(3):849-862.
doi: 10.3892/or.2020.7659. Epub 2020 Jun 24.

E2F7, regulated by miR‑30c, inhibits apoptosis and promotes cell cycle of prostate cancer cells

Affiliations

E2F7, regulated by miR‑30c, inhibits apoptosis and promotes cell cycle of prostate cancer cells

Ying Wang et al. Oncol Rep. 2020 Sep.

Abstract

Prostate cancer (PCa) remains a leading cause of mortality among men in the United States and Western Europe. The molecular mechanism of PCa pathogenesis has not been fully elucidated. In the present study, the expression profile of E2F transcription factor 7 (E2F7) in PCa was examined using immunohistochemistry and reverse transcription‑quantitative PCR, whilst cell cycle progression and apoptosis were determined using fluorescent cell activated sorting techniques. Cell viability was measured using Cell Counting Kit‑8 in loss‑ and gain‑of‑function studies. Dual‑luciferase reporter assay was used to verify if E2F7 was one of the potential targets of miR‑30c. The staining score of E2F7 of PCa tissues was found to be notably higher compared with that of adjacent normal tissues. Suppression of E2F7 expression in PCa cell lines led to significantly reduced proliferation rates, increased proportion of cells in the G1 phase of the cell cycle and higher apoptotic rates compared with those in negative control groups. Dual‑luciferase reporter assay revealed E2F7 to be one of the binding targets of microRNA (miR)‑30c. In addition, transfection of miR‑30c mimics into PCa cells resulted in reduced cell viability, increased proportion of cells in the G1 phase and higher apoptotic rates. By contrast, transfection with the miR‑30c inhibitor led to lower apoptosis rates of PCa cells compared with negative control groups, whilst E2F7 siRNA co‑transfection reversed stimulatory effects of miR‑30c inhibitors on cell viability. In addition, the expression of cyclin‑dependent kinase inhibitor p21 were found to be upregulated by transfection with either E2F7 siRNA or miR‑30c mimics into PCa cells. In conclusion, the present study suggested that E2F7 may be positively associated with PCa cell proliferation by inhibiting p21, whereas E2F7 is in turn under regulation by miR‑30c. These observations suggest the miR‑30c/E2F7/p21 axis to be a viable therapeutic target for PCa.

Keywords: prostate cancer; microRNA‑30c; E2F transcription factor 7; cell cycle; apoptosis; proliferation.


Figures

Figure 1.
Figure 1.
Comparison of E2F7 expression levels between prostate cancer and normal prostate tissues and cell lines. (A) Representative immunohistochemical staining images of E2F7 in prostate cancer and adjacent normal tissues microarrays. Red arrows, nuclei staining; yellow arrows, cytoplasm staining. M: moderately differentiated; P: poorly differentiated. (B) Staining scores of E2F7 expression in PCa (n=93) and adjacent normal prostate tissue arrays (n=45). ***P<0.0001. (C) Staining scores of E2F7 expression in paired prostate cancer (n=45) and matched adjacent non-cancerous tissues (n=45). ***P<0.0001. (D) Comparison of E2F7 mRNA expression in prostate cancer cell lines DU145 and PC3 cells and in the normal prostate cell line RWPE1 cells. ***P<0.0001. (E) Comparison of E2F7 protein expression in prostate cancer cell lines DU145 and PC3 cells, and in the normal prostate cell line RWPE1. **P<0.01 and ***P<0.0001. The values represent the mean ± SD from three experimental repeats. M, moderately differentiated; P, poorly differentiated; NS, not significant.
Figure 2.
Figure 2.
Verification of the potential predicted interaction between E2F7 and miR-30c. (A) The schematic diagram of the construction of the psiCHECK-2 vector encoding E2F7 3′UTR and E2F7 3′Mut UTR. Both Luc- E2F7 3′UTR and Luc- E2F7 3′mutant UTR were cloned into a psiCHECK-2 plasmid downstream of the firefly luciferase coding region between the XhoI and NotI sites. (B) DU145 cells and (C) PC3 cells were co-transfected with psiCHECK-2 constructs encoding either E2F7 wild-type 3′UTR or E2F7 mutant 3′UTR and either the miR-30c mimics for 48 h, following which their respective luciferase activities were measured. (D) Sequencing data of wild-type E2F7 3′UTR and mutant E2F7 3′UTR. The values represent the mean ± SD from three experimental repeats. ***P<0.0001. miR, microRNA; 3′UTR, 3′untranslated region; NS, not significant; MUT or mt, mutant; WT, wild-type; NC, negative control.
Figure 3.
Figure 3.
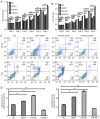
Effects of E2F7 knockdown, miR-30c overexpression and miR-30c inhibition on prostate cancer cell viability and apoptosis. CCK-8 assay results of (A) DU145 and (B) PC3 cells, where cell viability was measured every 24 h over 5 days following their respective transfections. (C) Representative flow cytometry dot plots showing that transfection with the miR-30c mimics or E2F7 siRNA increased the apoptotic rates of DU145 and PC3 cells compared with the those transfected with NC, whilst transfection with the miR-30c inhibitor resulted in the opposite effect. (D) Quantified data using cell counts from the Q2 and Q3 quadrants (C). The values represent the mean ± SD from three experimental repeats. *P<0.05, **P<0.01 and ***P<0.0001. miR, microRNA; siRNA, small interfering RNA; miR-30c, miR-30c mimics; miR-30c I, miR-30c inhibitor; siE2F7, E2F7 siRNA; OD, optical density; NS, not significant.
Figure 4.
Figure 4.
Effects of E2F7 knockdown, miR-30c overexpression and miR-30c knockdown on prostate cancer cell cycle progression. (A) Representative histograms showing the proportion of Du145 and PC3 cells in the G1, S and G2 phases of the cell cycle following transfection with either NC, miR-30c mimics, E2F7 siRNA or miR-30c inhibitors. Dark red indicates cells in G1 phase; Light red indicates cells in G2 phase; Teal indicates apoptotic cells; Blue indicates cells in S phase. (B) Transfection with the miR-30c mimic and E2F7-siRNA increased the percentage of DU145 and PC3 cells in the G1 phase of the cell cycle whilst transfection with the miR-30c inhibitor resulted in the opposite effect. No significant difference was observed in the G1 phase ratio between miR-30c inhibitor transfection group and the NC group in PC3 cells. Transfection with miR-30c mimics and E2F7-siRNA reduced the percentage of DU145 and PC3 cells in the S phase of the cell cycle whilst transfection with the miR-30c inhibitor resulted in the opposite effect. The values represent the mean ± SD from three experimental repeats. **P<0.01 and ***P<0.0001, NS, not significant. miR, microRNA; miR-30c, miR-30c mimics; miR-30c I, miR-30c inhibitor; NC, negative control.
Figure 5.
Figure 5.
Investigation into the functional relationship between of E2F7 and miR-30c. Cell Counting kit-8 assay of (A) DU145 and (B) PC3 cells following transfection with miR-30c mimic, miR-30c inhibitor, siE2F7 or NC, or co-transfected with miR-30c inhibitor and siE2F7. miR-30c expression levels as measured in (C) DU145 and (D) PC3 cells following transfection with miR-30c mimic, miR-30c inhibitor, siE2F7 or NC or co-transfected with miR-30c inhibitor and siE2F7. The E2F7 expression levels in (E) DU145 and (F) PC3 cells following transfection with miR-30c mimic, miR-30c inhibitor, siE2F7 or NC, or co-transfected with miR-30c inhibitor and siE2F7. The values represent the mean ± SD from three experimental repeats. *P<0.05, **P<0.01 and ***P<0.0001. OD, optical density; miR, microRNA; siRNA, small interfering RNA; miR-30c, miR-30c mimics; miR-30c i, miR-30c inhibitor; siE2F7, E2F7 siRNA; NC, negative control; NS, not significant.
Figure 6.
Figure 6.
Effect of E2F7 on miR-30c function. According to the results from EdU assay, miR-30c knockdown significantly promoted EdU uptake in (A) DU145 and (B) PC3 cell lines, which was reversed by co-transfection with E2F7 siRNA. Western blotting experiments showed that upregulation and downregulation of miR-30c resulted in the downregulation and upregulation of E2F7 expression in (C) DU145 and (D) PC3 cell lines, respectively. The values represent the mean ± SD from three experimental repeats of (E) DU145 and (F) PC3 cell lines. *P<0.05, **P<0.01 and ***P<0.0001. Scale bar, 100 µm. EdU, 5-Ethynyl-2′-deoxyuridine; miR, microRNA; miR-30c, miR-30c mimics; miR-30c i, miR-30c inhibitor; siE2F7, E2F7 siRNA.
Figure 7.
Figure 7.
Effect of miR-30c and E2F7 on p21 expression in PCa cells. p21 mRNA expression in (A) DU145 and (B) PC3 cells following transfection with miR-30c mimics, miR-30c inhibitors, NC or siE2F7 or co-transfection with siE2F7 and miR-30c inhibitors. p21 protein expression in (C) DU145 and (D) PC3 cells following transfection with miR-30c mimics, miR-30c inhibitors, NC or siE2F7 or co-transfection with siE2F7 and miR-30c inhibitors. The values represent the mean ± SD from three experimental repeats of (E) DU145 and (F) PC3 cell lines. **P<0.01 and ***P<0.0001. miR, microRNA; NC, negative control; miR-30c, miR-30c mimics; miR-30c I, miR-30c inhibitor; siE2F7, E2F7 siRNA.
Figure 8.
Figure 8.
Schematic diagram of the miR-30c/E2F7/p21 pathway. The hypothesis of the mechanism underlying prostate cancer tumorigenesis in the present study is the negative regulation of p21 by E2F7, which is in turn negatively regulated by miR-30c.

References

    1. Siegel RL, Miller KD, Jemal A. Cancer statistics, 2018. CA Cancer J Clin. 2018;60:277–300. - PubMed
    1. Nelson WG, De Marzo AM, Isaacs WB. Prostate cancer. N Engl J Med. 2003;349:366–681. doi: 10.1056/NEJMra021562. - DOI - PubMed
    1. Nevins JR. The Rb/E2F pathway and cancer. Human Mol Genet. 2001;10:699–703. doi: 10.1093/hmg/10.7.699. - DOI - PubMed
    1. Dyson N. The regulation of E2F by pRB-family proteins. Genes Dev. 1998;12:2245–2262. doi: 10.1101/gad.12.15.2245. - DOI - PubMed
    1. Thwaites MJ, Cecchini MJ, Dick FA. Analyzing RB and E2F during the G1-S transition. Methods Mol Biol. 2014;1170:449–461. doi: 10.1007/978-1-4939-0888-2_24. - DOI - PubMed

MeSH terms