. 2020 Sep;161(1):66-79.
doi: 10.1111/imm.13229. Epub 2020 Jul 14.

Complement activation by human IgG antibodies to galactose-α-1,3-galactose

Affiliations

Complement activation by human IgG antibodies to galactose-α-1,3-galactose

Jens Magnus Bernth Jensen et al. Immunology. 2020 Sep.

Abstract

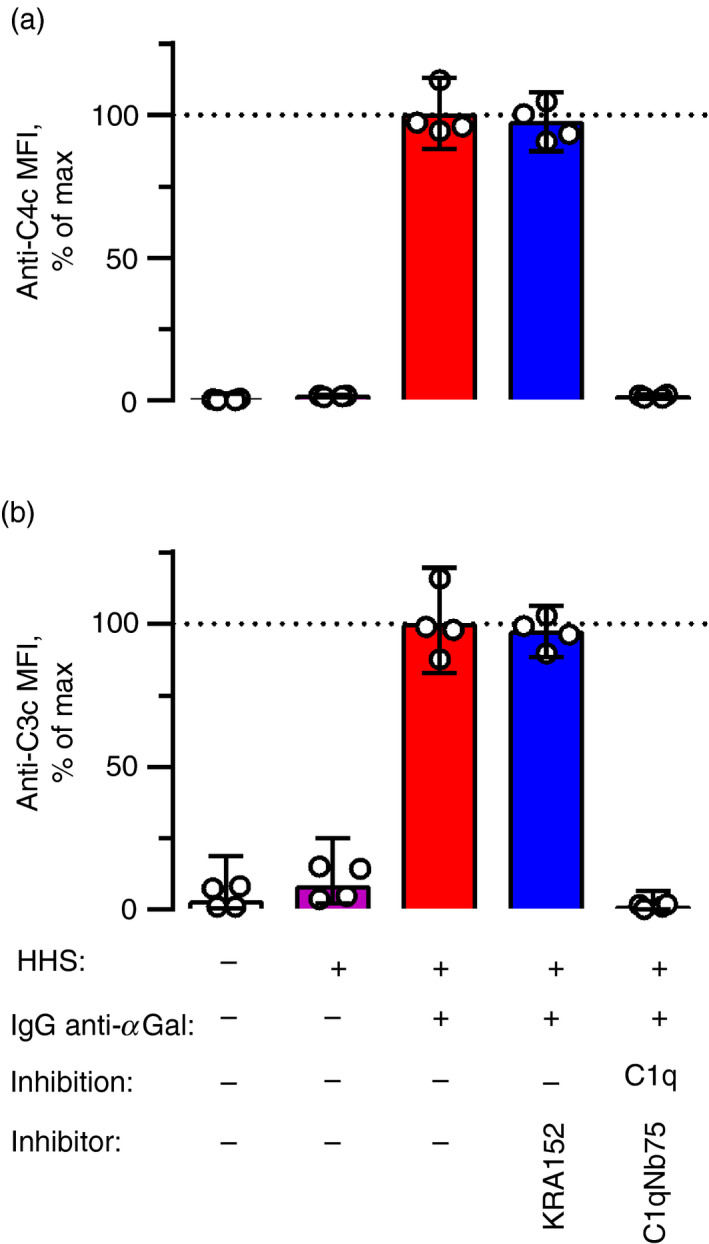
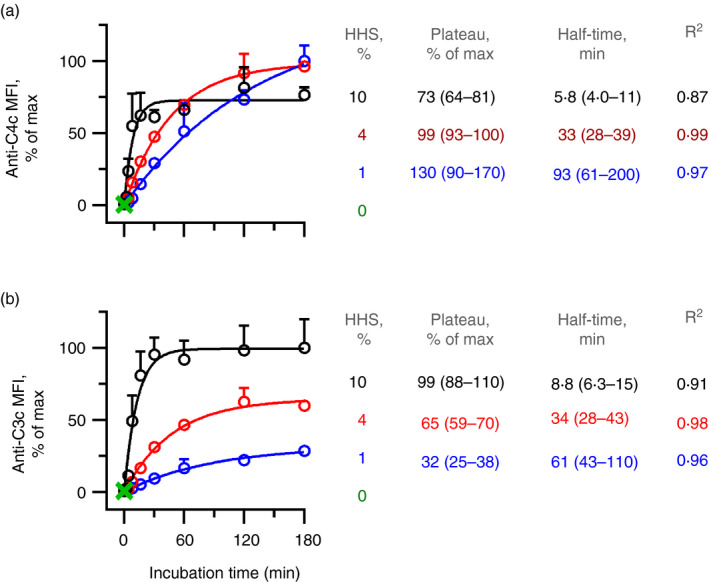
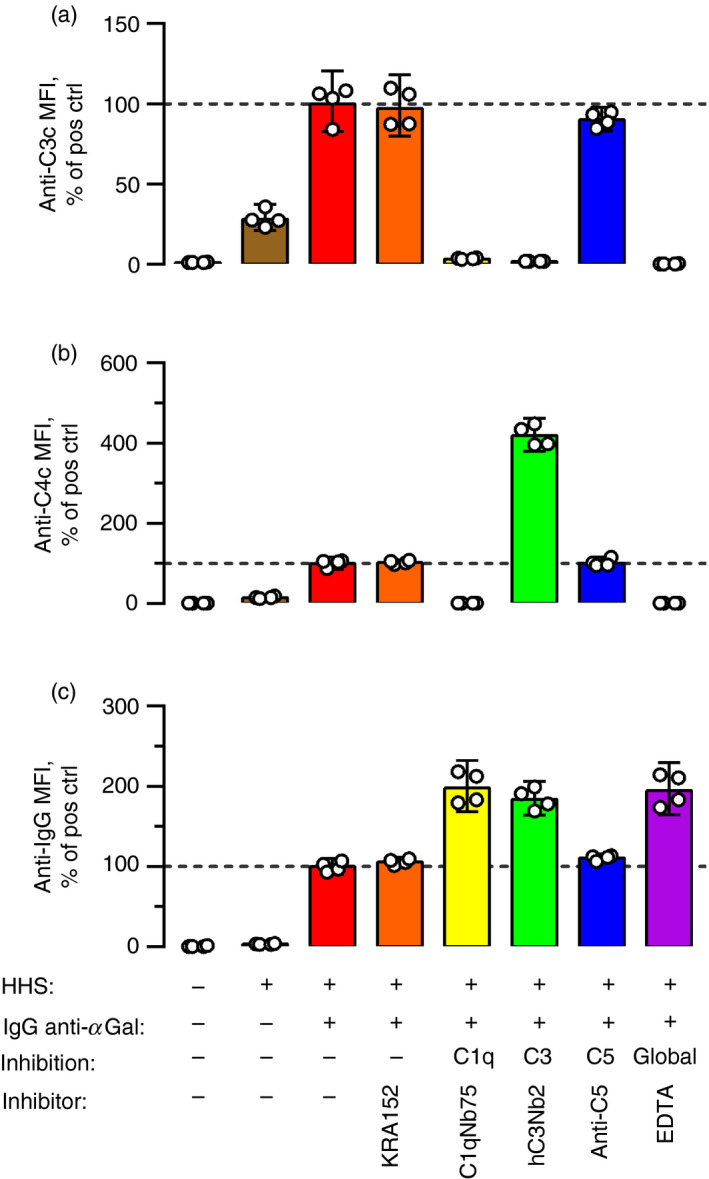
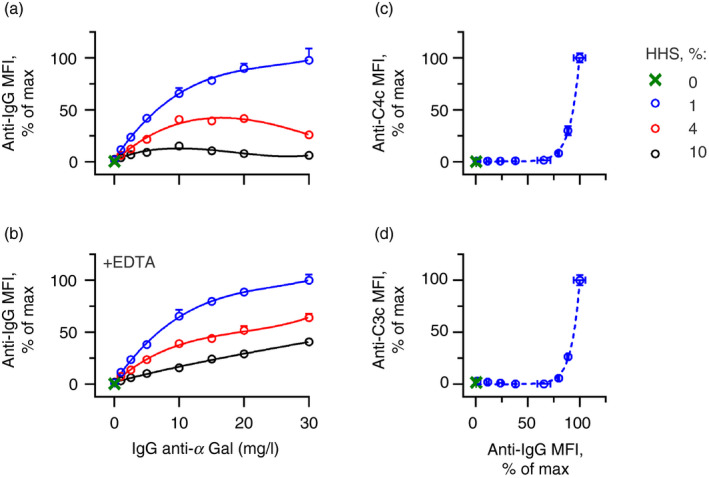
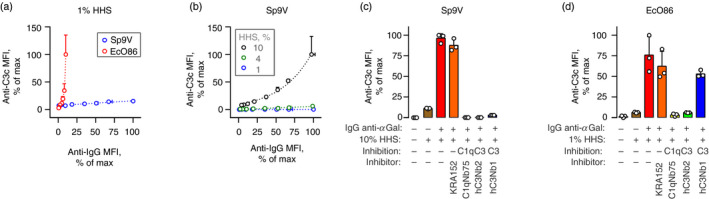
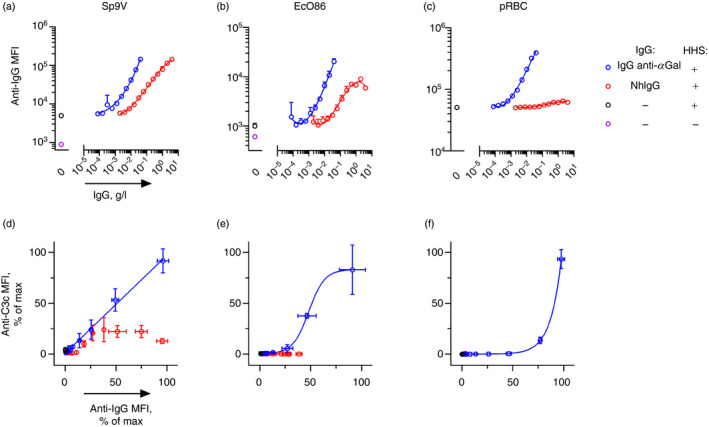
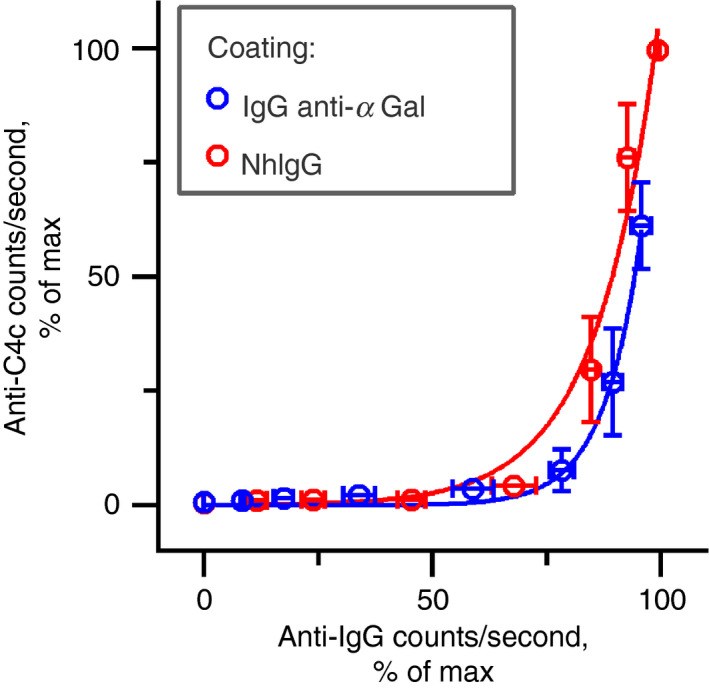
Some human antibodies may paradoxically inhibit complement activation on bacteria and enhance pathogen survival in humans. This property was also claimed for IgG antibodies reacting with terminal galactose-α-1,3-galactose (Galα3Gal; IgG anti-αGal), a naturally occurring and abundant antibody in human plasma that targets numerous different pathogens. To reinvestigate these effects, we used IgG anti-αGal affinity isolated from a pool of normal human IgG and human hypogammaglobulinaemia serum as a complement source. Flow cytometry was performed to examine antibody binding and complement deposition on pig erythrocytes, Escherichia coli O86 and Streptococcus pneumoniae serotype 9V. Specific nanobodies were used to block the effect of single complement factors and to delineate the complement pathways involved. IgG anti-αGal was capable of activating the classical complement pathway on all the tested target cells. The degree of activation was exponentially related to the density of bound antibody on E. coli O86 and pig erythrocytes, but more linearly on S. pneumoniae 9V. The alternative pathway of complement amplified complement deposition. Deposited C3 fragments covered the activating IgG anti-αGal, obstructing its detection and highlighting this as a likely general caveat in studies of antibody density and complement deposition. The inherent capacity for complement activation by the purified carbohydrate reactive IgG anti-αGal was similar to that of normal human IgG. We propose that the previously reported complement inhibition by IgG anti-αGal relates to suboptimal assay configurations, in contrast to the complement activating property of the antibodies demonstrated in this paper.

Keywords: alpha-galactosyl epitope; antibodies; antigens/peptides/epitopes; complement; human.


Conflict of interest statement

The authors declare no competing interests.

Figures

Figure 1
Figure 1
IgG anti‐αGal activates the classical pathway on pig red blood cells (pRBCs). Complement deposition on fixed pRBCs measured by flow cytometry using detection antibodies against C4c (which recognize C4b and iC4b fragments) (a) or C3c (which recognize C3b and iC3b fragments) (b). The pRBCs were incubated for 2 hr at 37° in 1% hypogammaglobulinaemia human serum (HHS) as the complement source supplemented with IgG anti‐αGal at 20 mg/l and inhibitors as indicated. Inhibitors were C1qNb75 or KRA152 nanobody. C1qNb75 targets the globular heads of C1q, thereby blocking C1q docking to immunoglobulin and inhibiting the classical pathway of complement. KRA152 possess irrelevant specificity and was included as a control. MFI, median fluorescence intensity. The columns represent the mean of four separate experiments (each represented by a dot) and error bars are 95% confidence intervals.
Figure 2
Figure 2
Complement deposition increases with time and complement concentration. Complement deposition on pig red blood cells (pRBCs) was measured by flow cytometry using detection antibodies against C4c (a) or C3c (b). The pRBCs were incubated for various times at 37° in increasing concentrations (1%, 4% or 10%) of hypogammaglobulinaemia human serum (HHS) as the complement source with IgG anti‐αGal at 20 mg/l. The data are expressed as the mean and standard deviation of two independent experiments. Curve fitting was performed using one‐phase association modelling.
Figure 3
Figure 3
Deposited C3 fragments conceal proximal complement factors and initiating antibodies. Complement deposition and antibody binding on pig red blood cells (pRBCs) were measured by flow cytometry using detection antibodies against C3c (a), C4c (b), or IgG (c). The pRBCs were incubated for 2 hr at 37° in 10% hypogammaglobulinaemia human serum (HHS) as the complement source supplemented with IgG anti‐αGal at 20 mg/l and complement inhibitors as indicated. KRA152 (control nanobody) at 90 mg/l; C1qNb75 (inhibiting C1q docking) at 12 mg/l; hC3Nb2 (binds C3 and blocks the action of the C3 convertases of both classical and alternative pathway) at 90 mg/l, anti‐C5 (eculizumab, binds C5 and blocks the action of the C5 convertases of both classical and alternative pathway) at 50 mg/l, and EDTA at 10 mm. ‘% of pos ctrl’ on the y‐axis denotes experiments containing HHS and IgG anti‐αGal, but no inhibitor. The columns represent the mean of four separate experiments (each represented by a dot). The error bars are 95% confidence intervals. The figure shows that inhibition of C3 cleavage increased the detection of C4b and IgG. IgG detection was also increased by global complement inhibition and inhibition of C1q docking.
Figure 4
Figure 4
Relation of IgG anti‐αGal density and complement deposition on pig red blood cells (pRBCs). Complement deposition and antibody binding on pRBCs were measured by flow cytometry using detection antibodies against IgG (a and b), C4c (c), or C3c (d). (a) Antibody binding on pRBCs as a function of IgG anti‐αGal concentration are shown for different concentrations of hypogammaglobulinaemia human serum (HHS) as the complement source. (b) As in the previous panel (conducted in parallel) except that the experiments contained 10 mm EDTA. The data are expressed as the mean and standard deviation of two independent experiments. Curve fittings were performed in a third‐order polynomial model. (c and d) Complement deposition as a function of the level of bound IgG anti‐αGal for experiments performed with 1% HHS [antibody binding data from panel (b), blue curve]. Curve fitting was done in an exponential model ((c) P = 6·2 [95% CI 5·8–6·8), R 2 = 1·0; (d) P = 5·6 (95% CI 5·2–6·2), R 2 = 1·0].
Figure 5
Figure 5
IgG anti‐αGal activates the classical pathway on bacteria. (a) Complement deposition on bacteria as function of the level of IgG anti‐αGal bound on the bacteria measured by flow cytometry (‘anti‐IgG MFI’). Bacteria, Streptococcus pneumonia serotype 9V (Sp9V) or Escherichia coli O86 (EcO86), were incubated in 1% hypogammaglobulinaemia human serum (HHS) as the complement source supplemented with IgG anti‐αGal at 0, 0·1, 1, 2·5, 5, 10, 15, 20 or 30 mg/l. The data are expressed as the mean and standard deviation of two independent experiments. Curve fittings were performed using a linear regression model for Sp9V (R 2 = 0·94) and an exponential model for EcO86 (doubling‐percentage, P = 1·5% (95% CI 1·3%–1·8%), R 2 = 0·99). P represents the increase in IgG binding signal associated with doubling of the complement deposition signal. (b) As in the previous panel but experiments were conducted for Sp9V in 1%, 4% or 10% HHS. Curve fitting was performed using linear regression models for 1% HHS (slope 0·00; 95% CI 0·0017–0·0028; R 2 = 0·95) and 4% HHS (slope 0·052; 95% CI 0·040–0·064; R 2 = 0·95) but in an exponential model for 10% HHS (P = 29% (95% CI 26%–32%), R 2 = 0·99). (c) Sp9V, IgG anti‐αGal at 20 mg/l and 10% HHS were incubated at 37° with or without nanobodies: KRA152 (irrelevant specificity), C1qNb75 (inhibits C1q docking to Ig), hC3Nb2 (inhibits C3 cleavage by CP and AP) and hC3Nb1 (inhibits C3 cleavage by AP). Complement deposition on bacteria was detected by flow cytometry. The data are expressed as the mean (bars) of three separate experiments (each represented by a dot) and standard deviation (error bars). (d) As in the previous panel, but for EcO86 in 1% HHS.
Figure 6
Figure 6
Binding and complement activation on cells by IgG anti‐αGal compared with normal human IgG. (a–c) Cell‐bound IgG as a function of IgG concentration examined by flow cytometry. IgG used in the experiments was either purified IgG anti‐αGal or was the source material for the purified IgG anti‐αGal (normal human IgG, nhIgG). Experiments contained 10 mm EDTA and hypogammaglobulinaemia human serum (HHS) (concentration in (a), 0% (−) or 10% (+); and in (b and c), 0% (−) or 4% (+)). The data are expressed as the mean and standard deviation of two independent experiments. Curve fitting was done by third‐order polynomial approximation. (d–f) Deposited C3 fragments as a function of cell‐bound IgG were examined by flow cytometry. Complement deposition was assayed in parallel and equivalent experiments as in panels (a–c) but without EDTA. The data for cell‐bound IgG were from panels (a–c). Curve fittings for IgG anti‐αGal‐associated data were performed in a linear model (d, R 2 = 1·00), a sigmoid model (e, R 2 = 1·00) and an exponential model (f, R 2 = 1·00).
Figure 7
Figure 7
IgG anti‐αGal and normal human IgG display similar inherent ability to activate the classical complement pathway. Complement deposition as a function of IgG density determined by solid‐phase immunoassay. Microtitre wells were coated with purified IgG anti‐αGal or nhIgG (normal human IgG used as the starting material for purification of the IgG anti‐αGal). The complement source [1% normal human serum (NHS)] was added, the plate was incubated at 37°, and the deposited complement was measured with anti‐C4c. The level of coated IgG was measured with anti‐IgG in parallel experiments that were identical, except for the lack of NHS. The data are expressed as the mean with 95% confidence intervals of four independent experiments.

Similar articles

Cited by

References

    1. Halstead SB, O'Rourke EJ. Dengue viruses and mononuclear phagocytes. I. infection enhancement by non‐neutralizing antibody. J Exp Med 1977; 146:201–17. - PMC - PubMed
    1. Guttman RM, Waisbren BA. Bacterial blocking activity of specific IgG in chronic Pseudomonas aeruginosa infection. Clin Exp Immunol 1975; 19:121–30. - PMC - PubMed
    1. Rice PA, Vayo HE, Tam MR, Blake MS. Immunoglobulin G antibodies directed against protein III block killing of serum‐resistant Neisseria gonorrhoeae by immune serum. J Exp Med 1986; 164:1735–48. - PMC - PubMed
    1. Hamadeh RM, Jarvis GA, Galili U, Mandrell RE, Zhou P, Griffiss JM. Human natural anti‐gal IgG regulates alternative complement pathway activation on bacterial surfaces. J Clin Invest 1992; 89:1223–35. - PMC - PubMed
    1. Ray TD, Lewis LA, Gulati S, Rice PA, Ram S. Novel blocking human IgG directed against the pentapeptide repeat motifs of Neisseria meningitidis Lip/H.8 and laz lipoproteins. J Immunol 2011; 186:4881–94. - PMC - PubMed

Publication types

MeSH terms

LinkOut - more resources