. 2020 Aug 1;31(17):1835-1845.
doi: 10.1091/mbc.E18-09-0556. Epub 2020 Jun 17.

Roles for a lipid phosphatase in the activation of its opposing lipid kinase

Affiliations

Roles for a lipid phosphatase in the activation of its opposing lipid kinase

Bethany S Strunk et al. Mol Biol Cell. .

Abstract

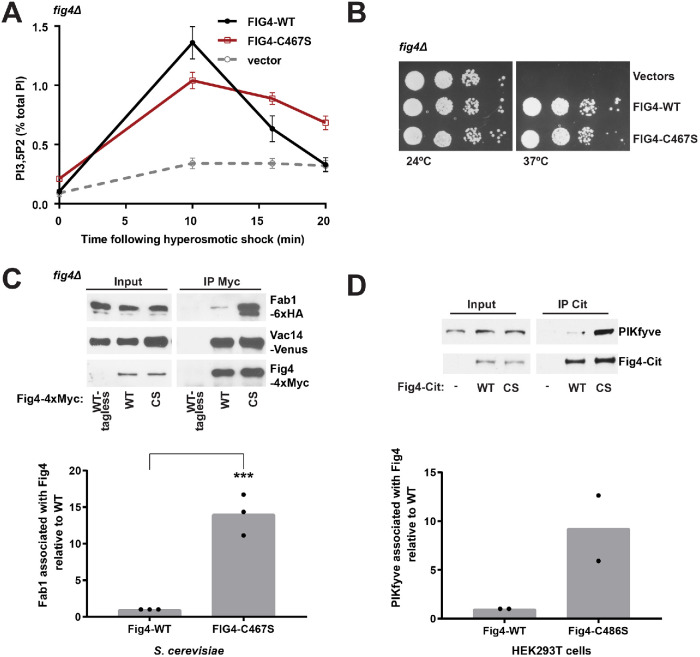
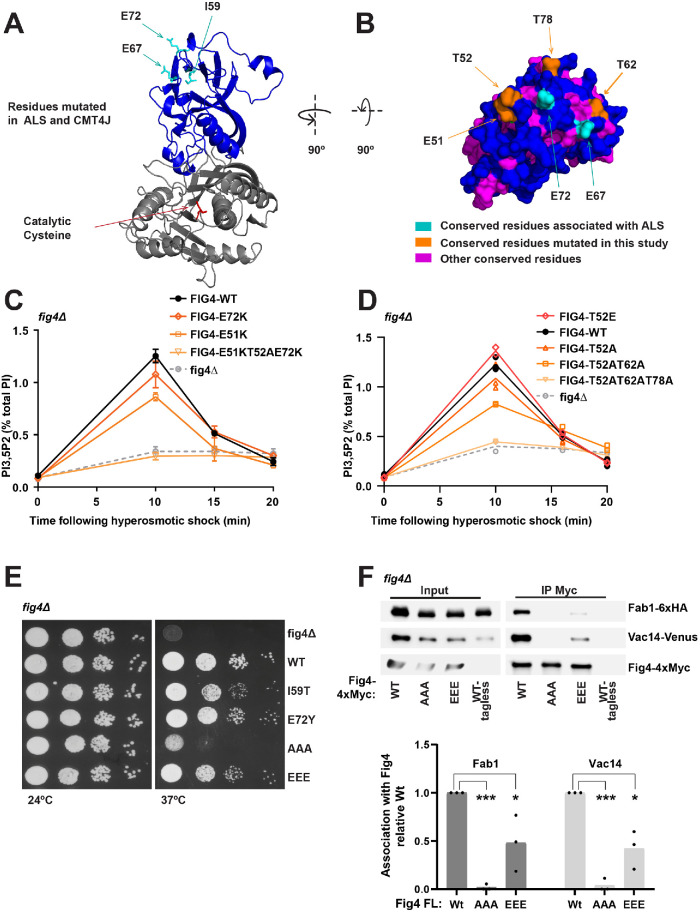
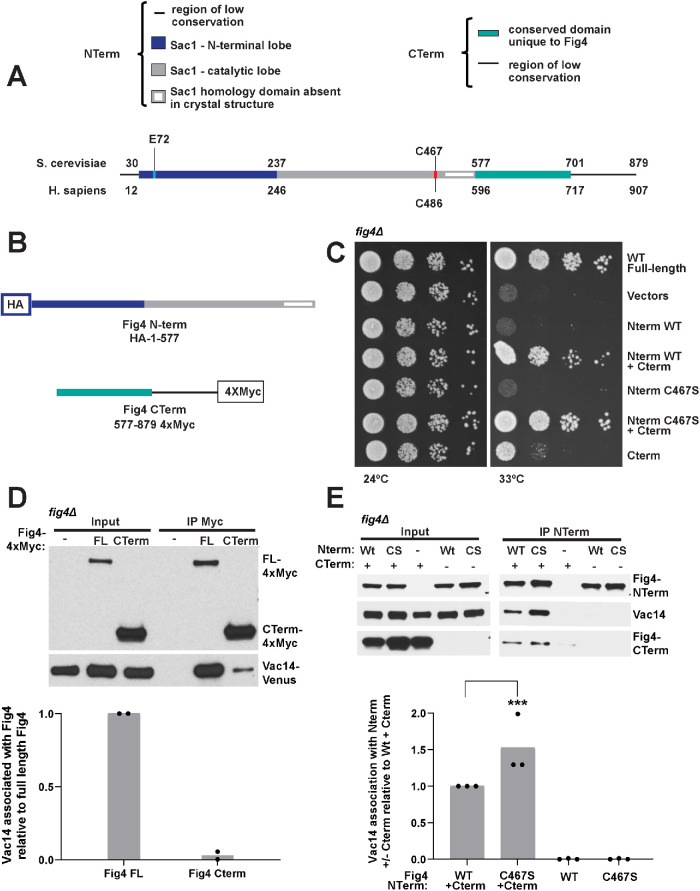
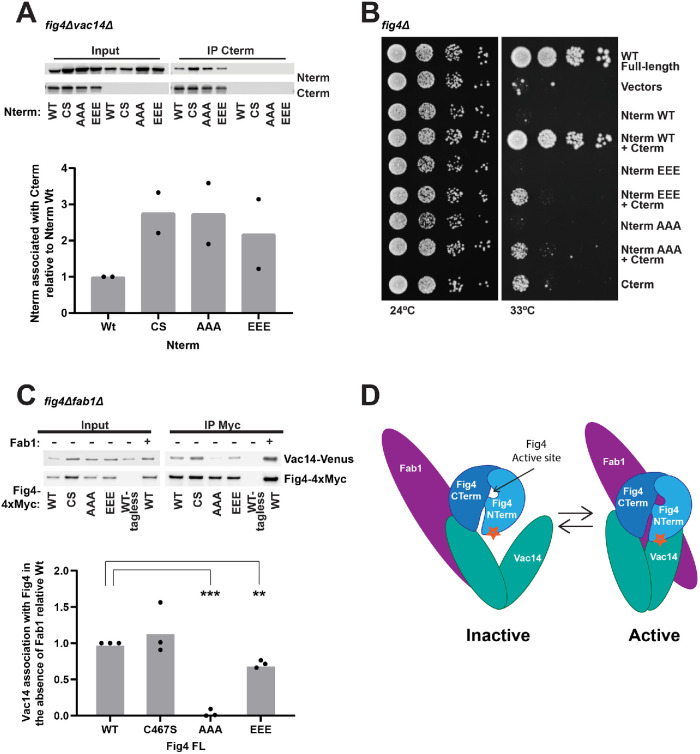
Fig4 is a phosphoinositide phosphatase that converts PI3,5P2 to PI3P. Paradoxically, mutation of Fig4 results in lower PI3,5P2, indicating that Fig4 is also required for PI3,5P2 production. Fig4 promotes elevation of PI3,5P2, in part, through stabilization of a protein complex that includes its opposing lipid kinase, Fab1, and the scaffold protein Vac14. Here we show that multiple regions of Fig4 contribute to its roles in the elevation of PI3,5P2: its catalytic site, an N-terminal disease-related surface, and a C-terminal region. We show that mutation of the Fig4 catalytic site enhances the formation of the Fab1-Vac14-Fig4 complex, and reduces the ability to elevate PI3,5P2. This suggests that independent of its lipid phosphatase function, the active site plays a role in the Fab1-Vac14-Fig4 complex. We also show that the N-terminal disease-related surface contributes to the elevation of PI3,5P2 and promotes Fig4 association with Vac14 in a manner that requires the Fig4 C-terminus. We find that the Fig4 C-terminus alone interacts with Vac14 in vivo and retains some functions of full-length Fig4. Thus, a subset of Fig4 functions are independent of its phosphatase domain and at least three regions of Fig4 play roles in the function of the Fab1-Vac14-Fig4 complex.


Figures

FIGURE 1:
FIGURE 1:
Catalytically impaired Fig4 supports partial Fig4 function. (A) PI3,5P2 was analyzed by HPLC from fig4Δ cells labeled with [3H]inositol. NaCl (0.9 M) was added to the media at 0 time. The hyperosmotic shock–induced rise in PI3,5P2 (10 min levels minus basal levels) is decreased by 33 ± 1% in Fig4-C467S compared with Fig4-WT (p = 0.0022, two-tailed t test). Basal levels of PI3,5P2 are 2.1± 0.4-fold higher in Fig4-C467S relative to wild type (p = 0.0082, two-tailed t test). Mean of four independent experiments. Error bars: SD. (B) Catalytically impaired Fig4 substitutes for wild-type Fig4 to support growth at 37°C in a fig4Δ Vac14-Venus Fab1-TAP strain. Cells expressing no Fig4, Fig4-wild-type (WT), or catalytically impaired Fig4 (C467S) from a plasmid were grown on selective SC–leu plates at 24° and 37°C. (C) Western blot of proteins immunoprecipitated with anti-Myc antibody from a fig4Δ strain expressing Fig4-4xMyc wild-type (WT-Myc), C467S (CS-Myc), or untagged Fig4 wild-type (WT-tagless) from a plasmid with native 5′ and 3′ UTR. Vac14-Venus and Fab1-6xHA expressed from endogenous loci. (D) Western blot of proteins immunoprecipitated with anti-Citrine antibody from HEK293T cells transfected with Fig4-Citrine, Fig4-C486S-Citrine, or Citrine alone. Bar graphs show quantification of Western blots in C and D. In yeast, Fab1 association with Fig4 C467S is 14.06 ± 2.81 times higher than wild-type Fig4, normalized to Fig4. Data points and mean of three independent experiments (** p = 0.0006, two-tailed t test). In HEK293T cells, PIKfyve association with Fig4 C486S is 9.27 ± 4.75-fold higher relative to wild-type Fig4. Data points and mean from two independent experiments.
FIGURE 2:
FIGURE 2:
A conserved N-terminal surface of Fig4 is required for the activation of Fab1 and for Fig4 binding to Fab1 and Vac14. (A, B) Predicted structure of the Fig4 phosphatase domain (amino acids 32–529) using Phyre2 (Kelley et al., 2015), based on homology with Sac1 (Manford et al., 2010). (A) Cartoon representation of the N-terminal lobe (blue) and catalytic region (gray) of the Fig4 phosphatase domain. ALS and CMT4J mutations (cyan) and the catalytic cysteine (red) are shown as sticks. I59 corresponds to human CMT4J mutation I41T. E67 and E72 correspond to ALS mutations D48G and D53Y, respectively. (B) Surface representation of a top-down view of the predicted Fig4 N-terminal surface. (C, D) PI3,5P2 was analyzed by HPLC from cells labeled with [3H]inositol. NaCl (0.9 M) was added to the media at 0 time. (C) Mean of three independent experiments. The 10 min level decreased relative to WT in E51K (p = 0.0008, two-tailed t test) and T52AE51KE72K (p = 0.0003, two-tailed t test). The change was not statistically significant for E72K (p = 0.0986, two-tailed t test). (D) Mean of two independent experiments with individual data points shown. (E) Growth defects in Fig4 mutants in fig4Δ Vac14-Venus Fab1-TAP at 37°C correlate with corresponding defects in elevation of PI3,5P2. Cells expressing no Fig4, Fig4-wild-type (WT), or indicated Fig4 mutants from a plasmid were grown on selective Sc–leu plates at 24° and 37°C. (F) Western blot of proteins immunoprecipitated with anti-Myc antibody from a fig4Δ strain expressing Fig4-4xMyc from a plasmid with native 5′ and 3′ UTR, and Vac14-Venus and Fab1-6xHA expressed from their corresponding endogenous loci. Bar graph shows quantification of band densities in Western blot, relative to wild type, normalized to Fig4-Myc, with data points and mean from three independent experiments (* p < 0.01, *** p < 0.0001, by two-tailed t test). Fig4 mutants analyzed: E72K, E72Y, E51K, triple mutant T52AE51KE72K, T52E, T52A, double mutant T52AT62A, triple mutant T52ET62ET72E (EEE), and triple mutant T52AT62AT72A (AAA).
FIGURE 3:
FIGURE 3:
Synergistic function of the Fig4 C- and N-termini depends on association of the Fig4 C-terminus with Vac14. (A) Linear representation of the Fig4 primary sequence. (B) N-terminal HA-tagged Fig4 phosphatase domain (Fig4-NTerm) (amino acids 1–577) and 4xMyc-tagged Fig4 C-terminal tail (Fig4-CTerm) (amino acids 577–879). (C) The Fig4-Cterm, but not the Fig4-Nterm, supports partial growth in fig4Δ Vac14-Venus Fab1-TAP at 33°C. The Fig4 Nterm contributes to and complements full Fig4 function only in the presence of the Fig4-Cterm. Cells expressing no Fig4, Fig4-wild-type (WT), or overexpressing the indicated Nterm and Cterm constructs from plasmids were grown on selective Sc–his–leu plates at 24° and 33°C. (D, E) Western blot of proteins immunoprecipitated with anti-Myc antibody (D) or anti-HA beads (E) from a fig4Δ strain expressing Vac14-Venus from its endogenous locus and expressing either no Fig4, Fig4-4xMyc from a plasmid with native 5′ and 3′ UTR, or overexpression (via an ADH promoter) of Fig4-Nterm and/or Fig4-CTerm. Bar graph shows quantification of band densities in Western blot (D) relative to full-length Fig4, normalized to Fig4-Myc, with data points and mean from two independent experiments and (E) relative to Nterm-WT+Cterm, normalized to NTerm, with data points and mean from three independent experiments (*** p < 0.0001, by two-tailed t test).
FIGURE 4:
FIGURE 4:
The Fig4 N-terminal and C-terminal domains mediate Fab1-Vac14-Fig4 complex assembly and function through contacts on Vac14. (A) Western blot of proteins immunoprecipitated with anti-Myc antibody from a fig4Δvac14Δ strain overexpressing the Fig4 C-terminus (CTerm-4xMyc) and/or the wild-type (WT), C467S (CS), T52AT62AT78A (AAA), or T52ET62ET78E (EEE) Fig4 phosphatase domain (HA-N-term) via an ADH promoter. Bar graph shows quantification of band densities in Western blot, relative to wild type, normalized to Cterm-Myc with data points and mean from two independent experiments. (B) In contrast to wild type, Fig4-Nterm AAA and Nterm-EEE do not support growth in the presence of the Fig4-Cterm in fig4Δ Vac14-Venus Fab1-TAP at 33°C. Cells expressing no Fig4, Fig4-wild-type (WT), or overexpressing the indicated Nterm and Cterm constructs from plasmids were grown on selective Sc–his–leu plates at 24° and 33°C. (C) Western blot of proteins immunoprecipitated with anti-Myc antibody from a fig4Δfab1Δ expressing Fig4-WT, Fig4-CS, Fig4-AAA, or Fig4-EEE. Vac14-Venus expressed from endogenous locus. Bar graph shows quantification of band densities in Western blot, relative to wild type, normalized to Fig4-Myc, with data points and mean from three independent experiments (*** p < 0.0001, ** p < 0.001, two-tailed t test). (D) Model for regulation of the Fab1-Vac14-Fig4 complex. The Fig4 C-terminus and an N-terminal surface (star) both contribute to its association with Vac14 within the Fab1-Vac14-Fig4 complex. The Fig4 catalytic site is also required for the full activation of Fab1.

References

    1. Albuquerque CP, Smolka MB, Payne SH, Bafna V, Eng J, Zhou H. (2008). A multidimensional chromatography technology for in-depth phosphoproteome analysis. Mol Cell Proteomics , 1389–1396. - PMC - PubMed
    1. Alonso A, Nunes-Xavier CE, Bayon Y, Pulido R. (2016). The extended family of protein tyrosine phosphatases. Methods Mol Biol , 1–23. - PubMed
    1. Amoasii L, Bertazzi DL, Tronchere H, Hnia K, Chicanne G, Rinaldi B, Cowling BS, Ferry A, Klaholz B, Payrastre B, et al. (2012). Phosphatase-dead myotubularin ameliorates X-linked centronuclear myopathy phenotypes in mice. PLoS Genet , e1002965. - PMC - PubMed
    1. Berger P, Berger I, Schaffitzel C, Tersar K, Volkmer B, Suter U. (2006). Multi-level regulation of myotubularin-related protein-2 phosphatase activity by myotubularin-related protein-13/set-binding factor-2. Hum Mol Genet , 569–579. - PubMed
    1. Bharadwaj R, Cunningham KM, Zhang K, Lloyd TE. (2016). FIG4 regulates lysosome membrane homeostasis independent of phosphatase function. Hum Mol Genet , 681–692. - PMC - PubMed

Publication types

MeSH terms

Substances

LinkOut - more resources