. 2020 Oct 1;30(11):5988-6003.
doi: 10.1093/cercor/bhaa173.

Diverse Temporal Dynamics of Repetition Suppression Revealed by Intracranial Recordings in the Human Ventral Temporal Cortex

Affiliations

Diverse Temporal Dynamics of Repetition Suppression Revealed by Intracranial Recordings in the Human Ventral Temporal Cortex

Vinitha Rangarajan et al. Cereb Cortex. .

Abstract

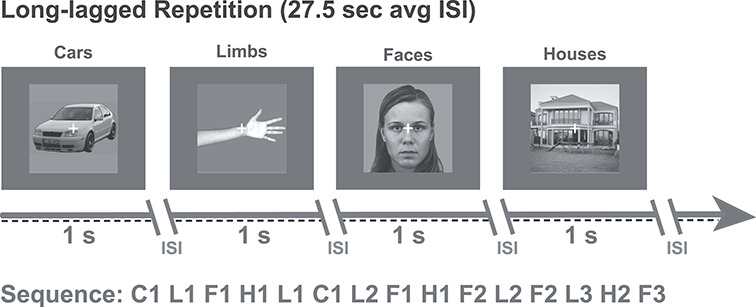
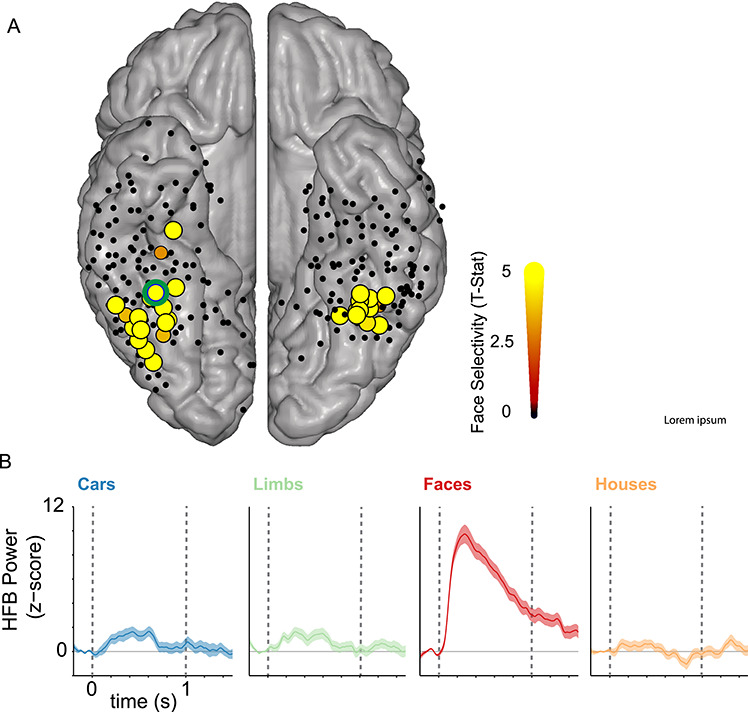
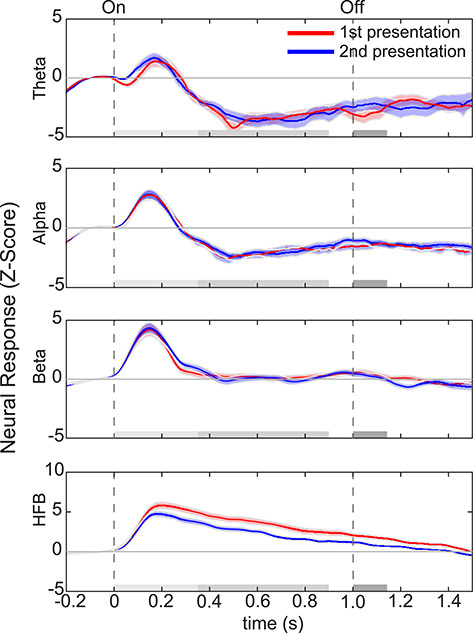
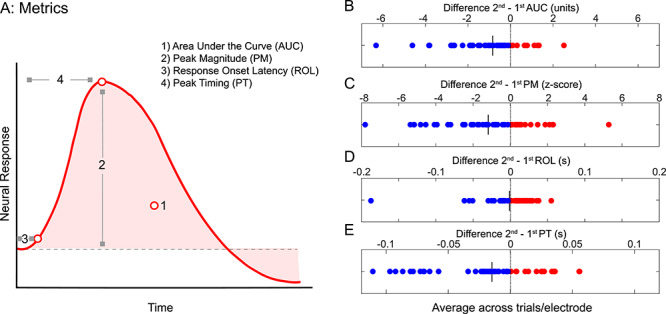
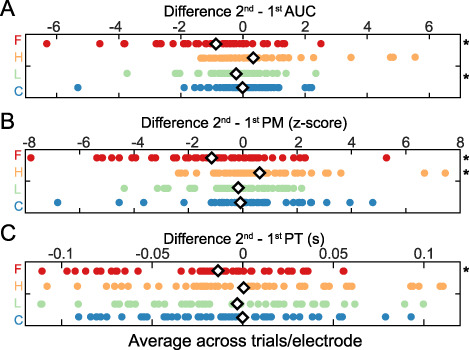
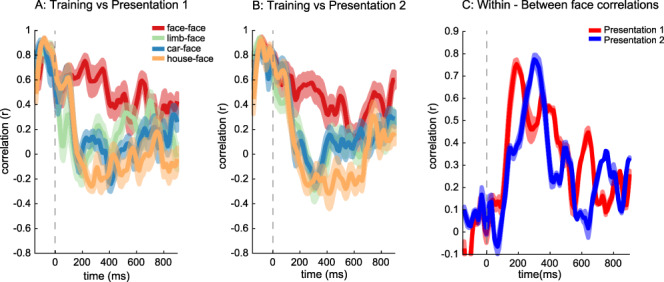
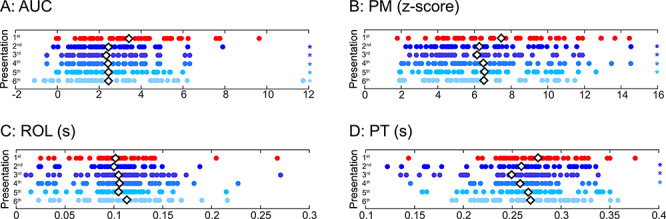
Repeated stimulus presentations commonly produce decreased neural responses-a phenomenon known as repetition suppression (RS) or adaptation-in ventral temporal cortex (VTC) of humans and nonhuman primates. However, the temporal features of RS in human VTC are not well understood. To fill this gap in knowledge, we utilized the precise spatial localization and high temporal resolution of electrocorticography (ECoG) from nine human subjects implanted with intracranial electrodes in the VTC. The subjects viewed nonrepeated and repeated images of faces with long-lagged intervals and many intervening stimuli between repeats. We report three main findings: 1) robust RS occurs in VTC for activity in high-frequency broadband (HFB), but not lower-frequency bands; 2) RS of the HFB signal is associated with lower peak magnitude (PM), lower total responses, and earlier peak responses; and 3) RS effects occur early within initial stages of stimulus processing and persist for the entire stimulus duration. We discuss these findings in the context of early and late components of visual perception, as well as theoretical models of repetition suppression.

Keywords: adaptation; electrocorticography; perception; repetition suppression; temporal dynamics.


Figures

Figure 1
Figure 1
Design of RS long-lagged experiment. All nine participants viewed images of cars, limbs, faces, and houses. Images were presented for 1 s each with a randomized interstimulus interval (ISI) ranging between 600 and 1400 ms. The average time between repeats of the same image was 27.5 ± 8.59 s. Task: participants were instructed to fixate on a central cross and press a button on a keypad when it changed color from white to red. Example image sequences are shown for each experiment with letters indicating the stimulus category; F, faces; L, limbs; C, cars; H, houses. Numbers indicate the exemplar identity (e.g., F1 is face exemplar number 1).
Figure 2
Figure 2
Face-selective electrodes in the VTC. (A) All electrodes from the VTC were projected into MNI space and illustrated on the Colin brain cortical surface. The color and size of the electrode indicate the degree of face selectivity, measured in the high-frequency broadband (70–150 Hz) range. That is, larger size and brighter color indicate larger face selectivity (see color bar). Face selectivity was determined in each electrode by comparing the average magnitude of HFB response for faces versus non-faces during a time interval of 0–0.5 s. This selectivity was determined using independent trials during the long-lagged experiment which contained stimuli that appeared only once during the experiment. Yellow electrodes showed significantly higher HFB responses to faces than non-faces (t-value, FDR corrected P < 0.05). Black electrodes did not show significant preference to faces. We identified a total of 48 face-selective electrodes in VTC, which were anatomically positioned on the FG and occipitotemporal sulcus (OTS) across the nine subjects. On average, there were 6 ± 4 face-selective electrodes per subject. All subjects had at least one face-selective electrode. Some electrodes are not visible in the group average due to spatial overlap. (B) Average HFB responses across items of a category in an example electrode (green outline in A) located near the mid-fusiform sulcus (MFS). Dashed vertical lines: stimulus onset and offset, respectively.
Figure 3
Figure 3
RS in human VTC occurs in HFB, but not lower-frequency bands. Average responses to first (red) versus second (blue) presentations of faces across all face-selective electrodes. Each row shows neural responses in a different frequency band. From top to bottom, frequencies are theta (Θ, 4–8 Hz), alpha (α, 8–13 Hz), beta (β, 16–30 Hz), and high-frequency broadband (HFB, 70–150 Hz). Shaded region: standard error of the mean across 48 face-selective electrodes. Dashed vertical lines: stimulus onset and offset, respectively. Gray horizontal bars illustrate the following time windows of interest: 1) light gray, 0–350 ms (evoked response); 2) medium gray, 350–900 ms (later response); 3) light and medium gray, 0–900 ms (stimulus duration); and 4) dark gray, 1000–1150 ms (post trial activity).
Figure 4
Figure 4
Quantifying the effect of repetition on the magnitude and timing of HFB responses. (A) Schematic illustration of four metrics of the HFB signal that were calculated for each of the 48 face-selective electrodes: 1) Total HFB response, which is the area under the curve (AUC) from 0 to 900 ms (light red), 2) Peak magnitude (PM), 3) Response onset latency (ROL), and 4) Peak timing (PT). (B) Difference in total response, area under curve: AUC (second presentation)—AUC (first presentation) for faces. (C) Difference in peak magnitude: PT (second presentation)—PT (first presentation) averaged over a 10-ms window surrounding the peak. (D) Difference in response onset latency: ROL (second presentation)—ROL (first presentation). (E) Difference in peak timing: PM (second presentation)—PM (first presentation). In BE, each point is an electrode. Blue: negative values indicate decrements. Red: positive values indicate increments. Vertical black line: mean value across electrodes.
Figure 5
Figure 5
Repetition effects for non-preferred categories in face-selective electrodes. The mean difference between second and first presentations for (A) AUC, (B) PM, and (C) PT. Each dot indicates a single electrode value. Red, F, faces; orange, H, houses; green, L, limbs; blue, C, cars. Asterisk: significant difference (P < 0.05, t-test) between first and second presentations, FDR corrected across electrodes. White diamond: mean value for each category.
Figure 6
Figure 6
Analysis of distributed responses to the four categories (face, limb, car, house) over time and repetitions. The correlation between the distributed responses of training images (nonrepeated faces) and each of the testing sets across 42 electrodes: (A) first and (B) second face and non-preferred categories. Color indicates the categories that are correlated: red, face-face; orange, houses-face; green, limbs-face; blue, cars-face correlations. (C) Within-face correlation minus between mean face and non-face correlations for first and second presentations are plotted over time; dashed vertical lines: stimulus onset. Error bars: indicate standard error across bootstraps.
Figure 7
Figure 7
The effects of repetition on the magnitude and timing across multiple repetitions. The mean (A) AUC, (B) PM, (C) ROL, and (D) PT per electrode shown for the first through sixth repetition of faces. Colored asterisk: a significant difference (P < 0.05, t-test) between that presentation number and the first presentation. White diamond: mean value for each presentation number.

Similar articles

Cited by

References

    1. Aarts E, Verhage M, Veenvliet JV, Dolan CV, van der Sluis S. 2014. A solution to dependency: using multilevel analysis to accommodate nested data. Nat Neurosci. 17:491–496. - PubMed
    1. Alink A, Abdulrahman H, Henson RN. 2018. Forward models demonstrate that repetition suppression is best modelled by local neural scaling. Nat Commun. 9:3854. - PMC - PubMed
    1. Allison T, Puce A, Spencer DD, McCarthy G. 1999. Electrophysiological studies of human face perception. I: potentials generated in occipitotemporal cortex by face and non-face stimuli. Cereb Cortex. 9:415–430. - PubMed
    1. Anderson B, Mruczek RE, Kawasaki K, Sheinberg D. 2008. Effects of familiarity on neural activity in monkey inferior temporal lobe. Cereb Cortex. 18:2540–2552. - PMC - PubMed
    1. Benjamini Y, Drai D, Elmer G, Kafkafi N, Golani I. 2001. Controlling the false discovery rate in behavior genetics research. Behav Brain Res. 125:279–284. - PubMed

Publication types