. 2020 Oct;88(4):771-784.
doi: 10.1002/ana.25831. Epub 2020 Aug 7.

Anti-migraine Calcitonin Gene-Related Peptide Receptor Antagonists Worsen Cerebral Ischemic Outcome in Mice

Affiliations

Anti-migraine Calcitonin Gene-Related Peptide Receptor Antagonists Worsen Cerebral Ischemic Outcome in Mice

Inge A Mulder et al. Ann Neurol. 2020 Oct.

Abstract

Objective: Calcitonin gene-related peptide (CGRP) pathway inhibitors are emerging treatments for migraine. CGRP-mediated vasodilation is, however, a critical rescue mechanism in ischemia. We, therefore, investigated whether gepants, small molecule CGRP receptor antagonists, worsen cerebral ischemia.

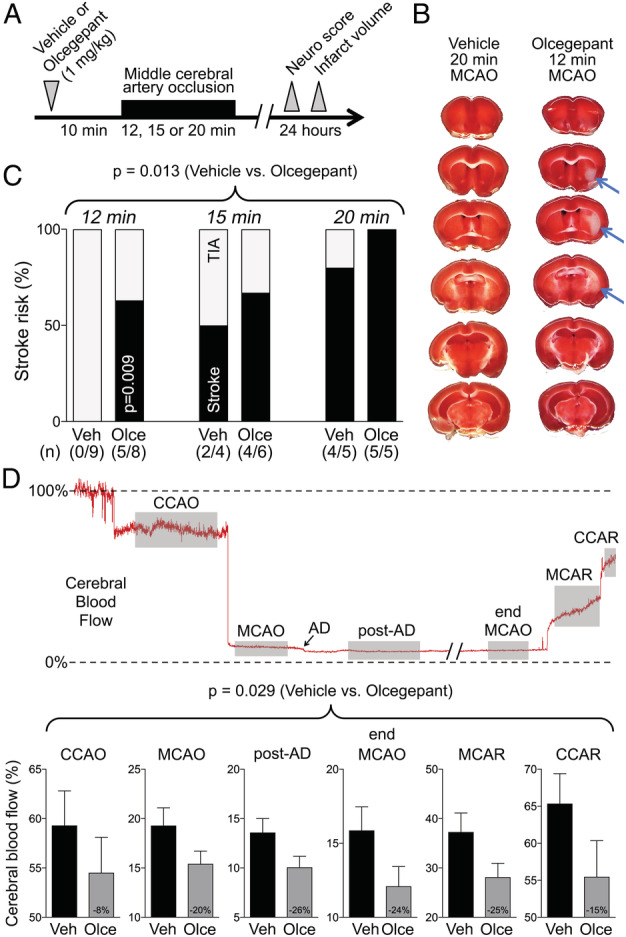
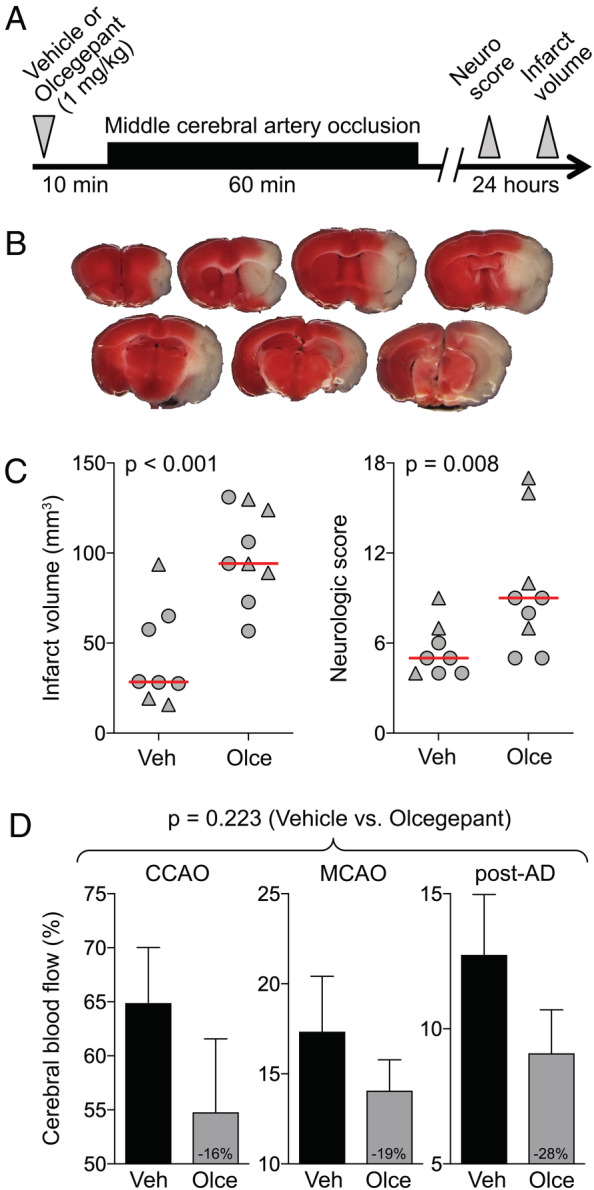
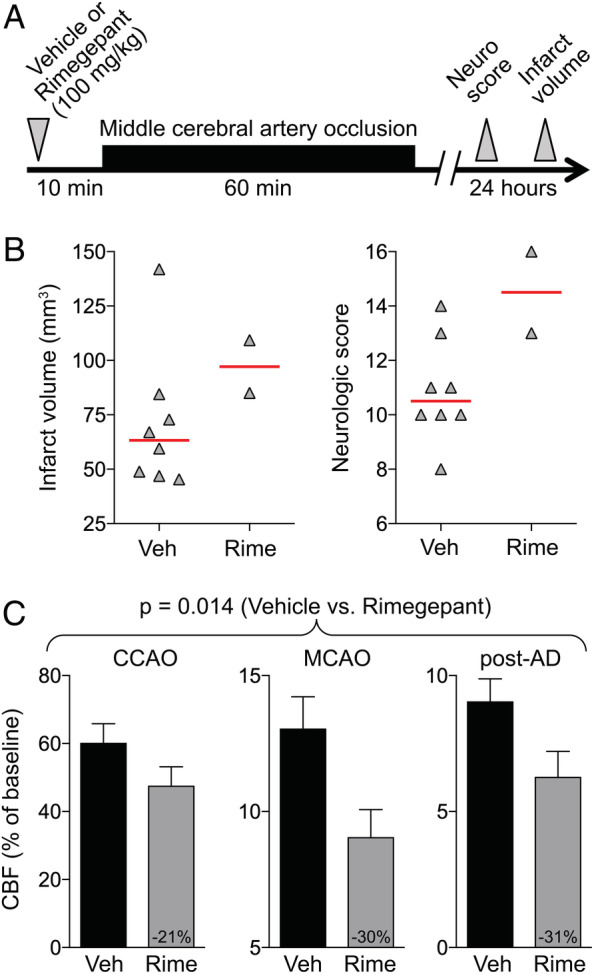
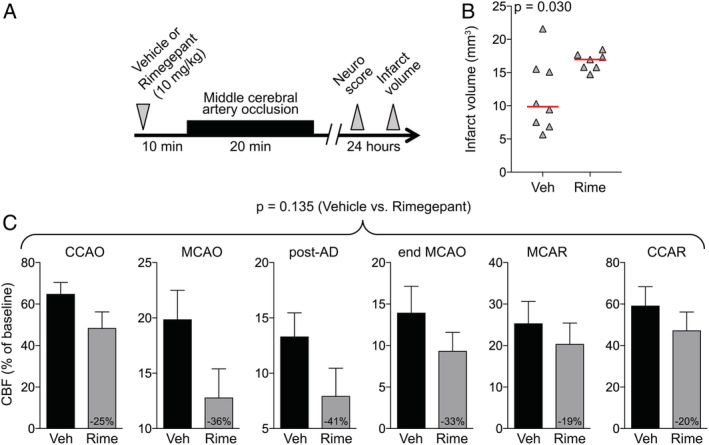
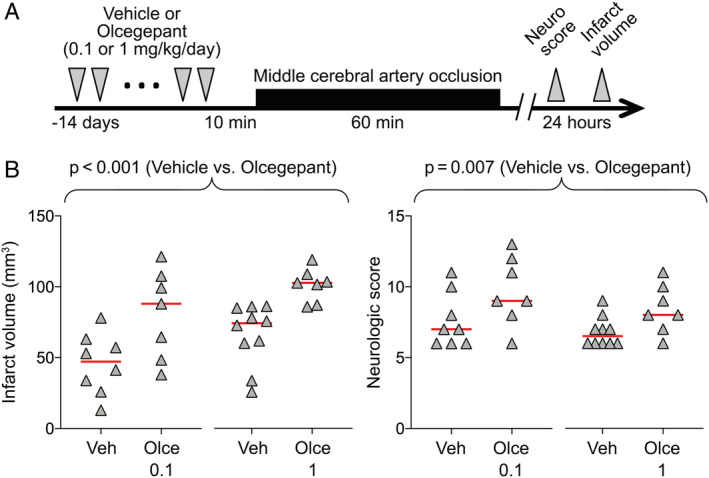
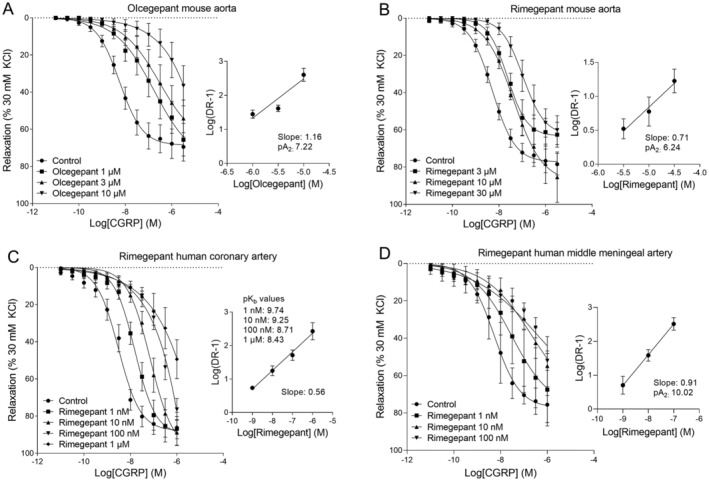
Methods: Middle cerebral artery was occluded for 12 to 60 minutes in mice. We compared infarct risk and volumes, collateral flow, and neurological deficits after pretreatment with olcegepant (single or 10 daily doses of 0.1-1mg/kg) or rimegepant (single doses of 10-100mg/kg) versus vehicle. We also determined their potency on CGRP-induced relaxations in mouse and human vessels, in vitro.

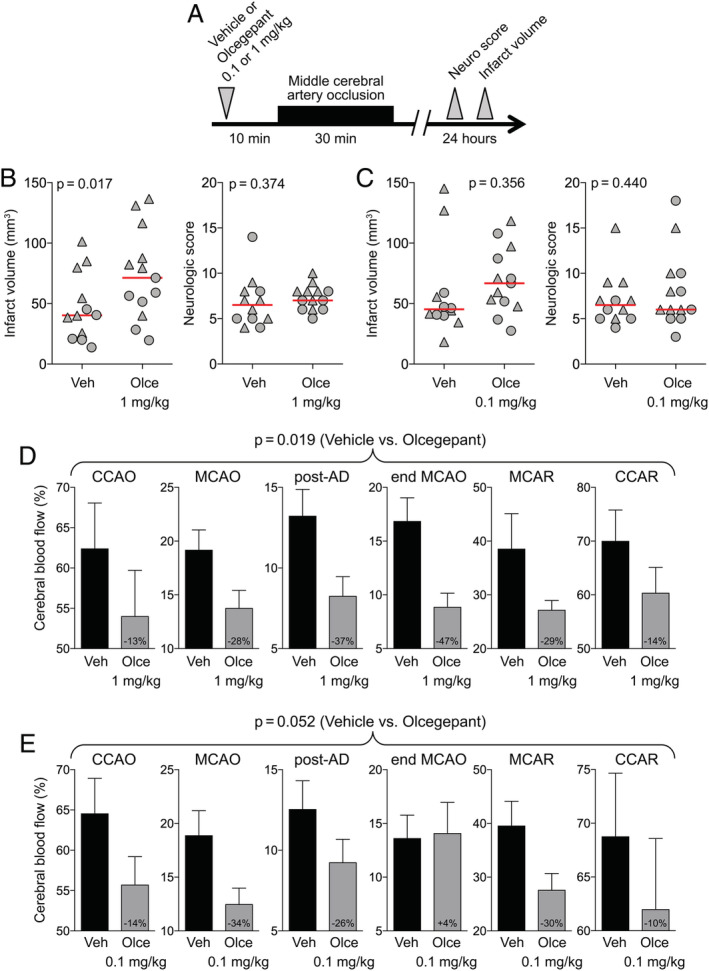
Results: Olcegepant (1mg/kg, single dose) increased infarct risk after 12- to 20-minute occlusions mimicking transient ischemic attacks (14/19 vs 6/18 with vehicle, relative risk = 2.21, p < 0.022), and doubled infarct volumes (p < 0.001) and worsened neurological deficits (median score = 9 vs 5 with vehicle, p = 0.008) after 60-minute occlusion. Ten daily doses of 0.1 to 1mg/kg olcegepant yielded similar results. Rimegepant 10mg/kg increased infarct volumes by 60% after 20-minute ischemia (p = 0.03); 100mg/kg caused 75% mortality after 60-minute occlusion. In familial hemiplegic migraine type 1 mice, olcegepant 1mg/kg increased infarct size after 30-minute occlusion (1.6-fold, p = 0.017). Both gepants consistently diminished collateral flow and reduced reperfusion success. Olcegepant was 10-fold more potent than rimegepant on CGRP-induced relaxations in mouse aorta.

Interpretation: Gepants worsened ischemic stroke in mice via collateral dysfunction. CGRP pathway blockers might thus aggravate coincidental cerebral ischemic events. The cerebrovascular safety of these agents must therefore be better delineated, especially in patients at increased risk of ischemic events or on prophylactic CGRP inhibition. ANN NEUROL 2020;88:771-784.


Conflict of interest statement

A.M. has received research grants and/or consultant fees from Amgen/Novartis, Lilly, and Teva, which develop anti‐CGRP and/or antimigraine therapeutics. C.A. has received research grants from electroCore, which develops an antimigraine neuromodulation device. M.D.F. receives consultant fees from Company Medtronic, Novartis, Lilly, and Teva, which develop anti‐CGRP and/or antimigraine therapeutics. All companies listed above may be affected by the study.

Figures

FIGURE 1
FIGURE 1
Olcegepant worsens the cerebral blood flow deficit and outcome of 12‐, 15‐, or 20‐minute focal cerebral ischemia. (A) Experimental timeline. (B) 2,3,5‐Triphenyltetrazolium chloride–stained coronal brain sections showing the infarct (blue arrows) after 12‐minute middle cerebral artery occlusion (MCAO) after pretreatment with a single dose of olcegepant (1mg/kg), and normal brain 20‐minute MCAO with vehicle injection. (C) Stroke risk (%) in vehicle (Veh) and olcegepant (Olce) groups after 12‐, 15‐, and 20‐minute MCAO. Data represent the percentage of infarct absence (transient ischemic attack [TIA], gray portion) or presence (stroke, black portion). Actual numbers of stroke/total are also provided in parentheses under the bars. Data were analyzed using multiple logistic regression (independent variables: treatment, ischemia duration; dependent variable: infarct presence) for the entire cohort, as well as using Fisher exact test in the 12‐minute MCAO group. (D) Representative cerebral blood flow tracing during MCAO and reperfusion measured by laser Doppler flowmetry. Gray shades represent typical time segments used to quantify the CBF during ischemia and after reperfusion. Lower panel shows the residual CBF (% of baseline) during different stages of MCAO in vehicle (n = 18) and olcegepant (1mg/kg, n = 19) arms (p = 0.029, 2‐way repeated measures analysis of variance). Data are from pooled 12‐, 15‐, and 20‐minute MCAO experiments. Numbers within the gray bars represent the relative difference between treatment arms calculated as (CBFOlce/CBFVeh) − 1. AD = anoxic depolarization; CCAO = common carotid artery occlusion; CCAR = common carotid artery reperfusion; MCAR = middle cerebral artery reperfusion. Seven mice in the vehicle arm and 1 mouse in the olcegepant arm were excluded from analyses based on predetermined criteria (see Materials and Methods). There was no mortality.
FIGURE 2
FIGURE 2
Olcegepant worsens the outcomes after 60‐minute focal cerebral ischemia. (A) Experimental timeline. (B) 2,3,5‐Triphenyltetrazolium chloride–stained coronal brain sections showing a typical infarct (unstained tissue) after 60‐minute middle cerebral artery occlusion (MCAO). (C) Infarct volume (mm3) and neurologic deficit score (p = 0.001 and p = 0.011, respectively, 2‐way analysis of variance [ANOVA]). Data from individual animals are shown (triangles = male; circles = female) along with their group median (red lines). Mean ages were 5.3 ± 1.4 and 5.7 ± 1.5 months in the vehicle (Veh) and olcegepant (Olce; 1mg/kg) groups, respectively (all wild type; mean ± standard deviation). (D) Residual cerebral blood flow (CBF; % of baseline) during MCAO (p = 0.223, 2‐way repeated measures ANOVA). Numbers within the gray bars represent the relative difference between treatment arms calculated as (CBFOlce/CBFVeh) − 1. Two mice in the vehicle arm and 1 mouse in the olcegepant arm were excluded from analyses based on predetermined criteria (see Materials and Methods). There was no mortality.
FIGURE 3
FIGURE 3
Rimegepant worsens the outcomes after 60‐minute focal cerebral ischemia. (A) Experimental timeline. (B) Infarct volume (mm3) and neurologic deficit scores. Data from individual animals are shown along with their group median (red lines). Mean ages were 2.2 ± 0.2 and 2.3 ± 0.3 months in vehicle (Veh) and rimegepant (Rime; 100mg/kg) groups, respectively (all male, wild type; mean ± standard deviation). (C) Residual cerebral blood flow (CBF; % of baseline) during middle cerebral artery occlusion (MCAO; p = 0.014, 2‐way repeated measures analysis of variance). Numbers within the gray bars represent the relative difference between treatment arms calculated as (CBFOlce/CBFVeh) − 1. One mouse each in the vehicle and rimegepant arms were excluded from analyses based on predetermined criteria (see Materials and Methods). Six mice died prior to outcome assessments in the rimegepant arm. AD = anoxic depolarization; CCAO = common carotid artery occlusion. [Color figure can be viewed at www.annalsofneurology.org]
FIGURE 4
FIGURE 4
Rimegepant worsens the outcomes after 20‐minute focal cerebral ischemia. (A) Experimental timeline. (B) Infarct volume (mm3; p = 0.030, t test). Data from individual animals are shown along with their group median (red lines). Mean ages were 2.5 ± 0.3 and 2.4 ± 0.2 months in vehicle (Veh) and rimegepant (Rime; 10mg/kg) groups, respectively (all male, wild type; mean ± standard deviation). (C) Residual cerebral blood flow (CBF; % of baseline) during middle cerebral artery occlusion (MCAO; p = 0.135, 2‐way repeated measures analysis of variance). Numbers within the gray bars represent the relative difference between treatment arms calculated as (CBFOlce/CBFVeh) − 1. There was no mortality. AD = anoxic depolarization; CCAO = common carotid artery occlusion; CCAR = common carotid artery reperfusion; MCAR = middle cerebral artery reperfusion. [Color figure can be viewed at www.annalsofneurology.org]
FIGURE 5
FIGURE 5
Prolonged treatment with olcegepant worsens the outcomes after 60‐minute focal cerebral ischemia. (A) Experimental timeline. (B) Infarct volume (mm3) and neurologic deficit scores (p < 0.001 and p = 0.007, respectively, 2‐way analysis of variance). Data from individual animals are shown along with their group mean for infarct and median for neurologic score (red lines). All mice were 2 months old, male, and wild type. Two mice in the vehicle (Veh) and 3 mice in the olcegepant (Olce) 0.1mg/kg and olcegepant 1mg/kg arms died prior to outcome assessments. There were no exclusions. [Color figure can be viewed at www.annalsofneurology.org]
FIGURE 6
FIGURE 6
Stroke outcome in familial hemiplegic migraine type 1 (FHM1) mice after a single dose of olcegepant. (A) Experimental timeline. (B) Infarct volume (mm3) and neurologic deficit scores in experiment testing olcegepant 1mg/kg (p = 0.017 and p = 0.374, respectively, 2‐way analysis of variance [ANOVA]). Data from individual animals are shown (triangles = male; circles = female) along with their group median (red lines). Mean ages were 6.4 ± 4.5 and 7.0 ± 6.5 months in vehicle (Veh) and olcegepant (Olce) groups, respectively (all FHM1 mutants; mean ± standard deviation [SD]). (C) Infarct volume (mm3) and neurologic deficit scores in experiment testing olcegepant 0.1mg/kg (p = 0.356 and p = 0.440, respectively, 2‐way ANOVA). Data from individual animals are shown (triangles = male; circles = female) along with their group median (red lines). (D) Residual cerebral blood flow (CBF; % of baseline) during middle cerebral artery occlusion (MCAO; p = 0.019, 2‐way repeated measures ANOVA). Mean ages were 13.2 ± 3.9 and 12.3 ± 2.3 months in the vehicle and olcegepant (1mg/kg) groups, respectively (all FHM1 mutants; mean ± SD). (E) Residual CBF (% of baseline) during MCAO (p = 0.052, 2‐way repeated measures ANOVA). Numbers within the gray bars represent the relative difference between treatment arms calculated as (CBFOlce/CBFVeh) − 1. Seven mice in the vehicle, 3 mice in the olcegepant 0.1mg/kg, and 6 in the olcegepant 1mg/kg arms were excluded from analyses based on predetermined criteria (see Materials and Methods). Two mice in the vehicle, 1 in olcegepant 0.1mg/kg, and 2 in the olcegepant 1mg/kg arms died prior to outcome assessments. AD = anoxic depolarization; CCAO = common carotid artery occlusion; CCAR = common carotid artery reperfusion; MCAR = middle cerebral artery reperfusion. [Color figure can be viewed at www.annalsofneurology.org]
FIGURE 7
FIGURE 7
Baseline hemodynamic parameters in young male wild‐type mice after a single dose of olcegepant. Baseline blood pressure (BP; p = 0.177), heart rate (HR; p = 0.917), and cerebral blood flow (CBF; p = 0.441) were measured over a period of 30 minutes after vehicle or olcegepant (1mg/kg) treatment (both groups: 2.6 ± 0.2 months of age, all male, wild‐type mice). Two‐way repeated measures analysis of variance, n = 5 per group. BPM = beats per minute.
FIGURE 8
FIGURE 8
Pharmacological characterization of olcegepant and rimegepant in mouse aortas, human coronary arteries, and human middle meningeal arteries. (A) Concentration–response curves to rat α–calcitonin gene–related peptide (CGRP) in mouse aortas in the absence or presence of olcegepant (1μM, 3μM, and 10μM; 3–6 females and 3–5 males) with the corresponding Schild plot (pA2 = 7.22, 2 females and 3 males). (B) Concentration–response curves to rat α‐CGRP in mouse aortas in the absence or presence of rimegepant (3μM, 10μM, 30μM; 2–5 females and 2–4 males) with the corresponding Schild plot (pA2 = 6.24, 3 females and 4 males). (C) Concentration–response curves to human α‐CGRP in human coronary arteries in the absence or presence of rimegepant (1nM, 10nM, 100nM, 1μM; 2–3 females and 3–4 males) with the corresponding Schild plot and pKb values (3 females and 4 males). (D) Concentration–response curves to human α‐CGRP in human middle meningeal arteries in the absence or presence of rimegepant (1nM, 10nM, 100nM; 2 females and 1–2 males) with the corresponding Schild plot (pA2 = 10.02; 2 females and 2 males). All data are represented as mean ± standard error of the mean. DR‐1 = Dose Ratio–1; KCL = kaliumchloride; M = Molar

References

    1. Iyengar S, Johnson KW, Ossipov MH, Aurora SK. CGRP and the trigeminal system in migraine. Headache 2019;59:659–681. - PMC - PubMed
    1. Edvinsson L, Haanes KA, Warfvinge K, Krause DN. CGRP as the target of new migraine therapies—successful translation from bench to clinic. Nat Rev Neurol 2018;14:338–350. - PubMed
    1. Sparrow AM, Searles JW. The market for migraine drugs. Nat Rev (2019). - PubMed
    1. Russell FA, King R, Smillie SJ, et al. Calcitonin gene‐related peptide: physiology and pathophysiology. Physiol Rev 2014;94:1099–1142. - PMC - PubMed
    1. Hong KW, Pyo KM, Lee WS, et al. Pharmacological evidence that calcitonin gene‐related peptide is implicated in cerebral autoregulation. Am J Physiol 1994;266(pt 2:H11–H16. - PubMed

Publication types