. 2020 Sep 7;217(9):e20191537.
doi: 10.1084/jem.20191537.

Cbl and Cbl-b control the germinal center reaction by facilitating naive B cell antigen processing

Affiliations

Cbl and Cbl-b control the germinal center reaction by facilitating naive B cell antigen processing

Xin Li et al. J Exp Med. .

Abstract

Antigen uptake and presentation by naive and germinal center (GC) B cells are different, with the former expressing even low-affinity BCRs efficiently capture and present sufficient antigen to T cells, whereas the latter do so more efficiently after acquiring high-affinity BCRs. We show here that antigen uptake and processing by naive but not GC B cells depend on Cbl and Cbl-b (Cbls), which consequently control naive B and cognate T follicular helper (Tfh) cell interaction and initiation of the GC reaction. Cbls mediate CD79A and CD79B ubiquitination, which is required for BCR-mediated antigen endocytosis and postendocytic sorting to lysosomes, respectively. Blockade of CD79A or CD79B ubiquitination or Cbls ligase activity is sufficient to impede BCR-mediated antigen processing and GC development. Thus, Cbls act at the entry checkpoint of the GC reaction by promoting naive B cell antigen presentation. This regulation may facilitate recruitment of naive B cells with a low-affinity BCR into GCs to initiate the process of affinity maturation.


Conflict of interest statement

Disclosures: The authors declare no competing interests exist.

Figures

None
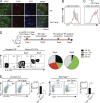
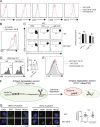
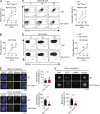
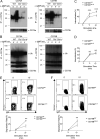
Graphical abstract
Figure S1.
Figure S1.
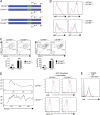
General development of Cbl−/−Cbl-b−/− B cells. (A) Western blot analysis of Cbls expression in different subsets of splenic B cells (n = 2). FO, follicular. (B) Western blot analysis of Cbls deletion in B cells from Cbl−/−Cbl-b−/− mice (n = 2). (C) Bone marrow B cells in Cbl−/−Cbl-b−/− mice. Shown are flow cytometric analysis of B220+ B cells in the bone marrow. Absolute numbers of B cells are shown as bar representations (n = 5). (D) B cell development in Cbl−/−Cbl-b−/− mice. Shown are flow cytometric analysis of splenic B cells stained with anti-CD21 and CD23. Immature transitional T1 and T2 cells and mature B1-b, follicular, and MZ B cells are schematically indicated (right). Absolute numbers of B cell in each subset are shown as bar representations (n = 5). (E) Immunofluorescent staining of spleen follicles. Shown are immunofluorescence image of B cell follicles stained with anti-IgD (green), anti-CD1d (red), or anti-Sign-R1 (pink). (G) ELISA analysis of serum type-I T cell–independent anti-NP responses (n = 4). (H) Immunofluorescent staining of spleen follicles from unimmunized mice. Shown are immunofluorescence image of B cell follicles stained with anti-IgD (green), anti-CD35 (red), and anti-CD3 (blue). Data are mean ± SEM of at least two independent experiments (C, D, and F). **, P < 0.01; ***, P < 0.001.
Figure 1.
Figure 1.
Impaired T cell–dependent antibody responses and GC development in Cbl−/−Cbl-b−/− mice. (A) The kinetics of total and high-affinity anti-NP responses of the IgG1 isotype in WT (Mb1-Cre Tg) and Cbl−/−Cbl-b−/− mice after NP-KLH immunization. Shown are ELISA results of serum titers of the total (anti-NP30) and high-affinity (anti-NP4) IgG1 antibodies (n = 6). (B) Flow cytometric analyses of splenic GC B cell development in WT (Mb1-Cre Tg) and Cbl−/−Cbl-b−/− mice after NP-KLH immunization. Shown are contour maps (top) and kinetics (bottom) of Fas+GL7hi GC B cells in the gated B220+IgD B cells (n = 5). (C) Immunofluorescent staining of GCs in the spleen of WT (Mb1-Cre tg) and Cbl−/−Cbl-b−/− mice at day 10 after NP-KLH immunization. Spleen sections were stained with peanut agglutinin (PNA; red), anti-CD3ε (blue), and anti-B220 (green). Shown are representative images of more than three independent experiments (n = 5). (D) Total numbers of splenic antibody-secreting cells (ASCs) against the total NP (NP30) or high-affinity NP (NP4) antigen (n = 5). (E) Flow cytometric analyses of splenic GC B cells in WT (C57BL/6), Cbl−/−, Cbl-b−/−, and Cbl−/−Cbl-b−/− mice at day 10 after SRBC immunization. Shown are FACS contour maps (left) and statistics (right) of Fas+GL7hi GC B cells in gated B220+IgD B cells (n = 5). Data are shown as means ± SD (A, B, D, and E) and from two independent experiments (A, D, and E) and three independent experiments (B and C). ***, P < 0.001 (A and D, unpaired Student’s t test; B, two-way ANOVA multiple comparison test; E, one-way ANOVA multiple comparison test).
Figure S2.
Figure S2.
Analyses of GC and Tfh cell development. (A) Immunofluorescent staining of FDCs in WT and Cbl−/−Cbl-b−/− mice. Shown are spleen sections of B cell follicles and FDCs stained with anti-B220 (green), anti-CD35 (red), and anti-CD3. (B and C) B cell proliferation assay. Shown are flow cytometric analyses of B cell proliferation after anti-IgM (B) or anti-CD40 (C) stimulation for three days. (D) System to examine Tfh cell development. Top: Scheme to examine Tfh cell development using IL4GFPIL21Kat OT-II T cell chimeric mice. Bottom: flow cytometric analyses of IL21Kat vs. IL4GFP expression in Tfh cells (left). Pie representations show the percentages of IL21+, IL4+ or IL21+IL4+ Tfh cells (n = 3). (E) Tfh and GC B cell development in WT and Cbl−/−Cbl-b−/− recipient mice transplanted with IL4GFPIL21Kat OT-II T cells after NP-KLH immunization. Shown are FACS contour maps of PD-1 vs. CXCR5 staining of Tfh cells (left) and Fas vs. GL7 staining of GC B cells (right). IL4GFPIL21Kat expression in gated Tfh cells is shown in Fig. 2 C (n = 6). Data are mean ± SEM of at least two independent experiments (E). **, P < 0.01; ***, P < 0.001.
Figure 2.
Figure 2.
Incapability of Cbl−/−Cbl-b−/− B cells in promoting Tfh cell maturation and receiving help from Tfh cells. (A) Flow cytometric analyses of splenic Tfh cells in SRBC immunized mice. Shown are FACS analysis (top) and statistics (bottom) of PD-1 vs. CXCR5 staining of splenic (PD-1hiCXCR5hi) Tfh cells among the gated CD4+ T cells (n = 5). (B) Expression of Bcl6 in Tfh cells from Cbl−/−Cbl-b−/− mice. Shown are a FACS analyses of CXCR5 vs. Bcl6 staining of Tfh cells in gated splenic CD4+ T cells from WT and Cbl−/−Cbl-b−/− mice after NP-KLH immunization (n = 5). (C) Impaired Tfh cell maturation in WT and Cbl−/−Cbl-b−/− OT-II IL21Kat IL4GFP reporter chimeric mice. IL21KatIL4GFP OT-II CD4+ reporter T cells were transferred into WT and Cbl−/−Cbl-b−/− recipient mice, respectively, immunized, and analyzed by FACS. Shown are FACS contour map (top left) and statistics (top right) of OT-II IL21Kat+ and IL4GFP+ Tfh cells and histogram comparison of IL21Kat+ Tfh cells (bottom) in WT and Cbl−/−Cbl-b−/− mice after NP-OVA immunization (n = 6). DN, IL-21IL-4double negative; DP, IL-21+IL-4+ double positive. (D) Immunofluorescent staining of IL21KatIL4GFP T cells in GCs of the immunized WT and Cbl−/−Cbl-b−/− mice (n = 3). (E and F) Flow cytometric analyses of GC B and Tfh cells in WT B6:SJL and Cbl−/−Cbl-b−/−:SJL BM chimeras. Shown are FACS contour maps (top) and statistics (bottom) of GC B cells (E) and Tfh cells (F) derived from SJL, WT B6, and Cbl−/−Cbl-b−/− donors, respectively (n = 5). Data are means ± SD (A–C, E, and F) and are from at two independent experiments (A–D) and three independent experiments (E and F). **, P < 0.01; ***, P < 0.001 (B, C, E, and F, unpaired Student’s t test; A, one-way ANOVA multiple comparison test).
Figure S3.
Figure S3.
BCR downmodulation and intracellular trafficking. (A) Expression of costimulatory ligands and receptors on WT and Cbl−/−Cbl-b−/− B cells. Shown are histogram analyses of IcosL, Cxcr4, CD40, CD86, and MHC-II expression on WT and Cbl−/−Cbl-b−/− GC B cells. (B) Cell surface IgM expression on 40LB culture–derived WT and Cbl−/−Cbl-b−/− iGC B cells. (C) OT-II T cell proliferation stimulated by OVA323–339 peptide or anti-IgM-OVA antigen–loaded iGC B cells. Proliferation of OT-II T cells was measured based on the dilution of CTV fluorescent intensity. Shown are contour maps (left) of CTV intensity and statistics (right) of the gated OT-II T cells (n = 4). (D) Expression of cell surface IgM on WT and Cbl−/−Cbl-b−/− GC B cells. Shown are histograms (left) and statistics (right) of cell surface IgM expression on gated GC B cells (n = 5). (E) In vivo presentation of antigen Eα-GFP by WT and Cbl−/−Cbl-b−/− GC B cells. Shown is a histogram of Eα pMHC-II Y-Ae expression on gated WT and Cbl−/−Cbl-b−/− GC cells (n = 3). (F) Scheme for generation and working principle of the lysosome degradation sensor. (G) BCR-mediated lysosome sensor degradation in WT and Cbl−/−Cbl-b−/− iGC B cells. Shown are confocal images (left) and statistics (right) of GC B cells staining with anti-BCR lysosome degradation sensor before (top panel) and after (bottom panel) 30-min incubation at 37°C. Data represent mean ± SEM of at least two independent experiments (C, D, and G).
Figure 3.
Figure 3.
Defective antigen presentation of naive Cbl−/−Cbl-b−/− B cells to cognate T cells. (A) OT-II T cell proliferation stimulated by OVA323–339 peptide or anti-IgM-OVA–loaded naive B cells. Proliferation of OT-II T cells are measured based on the dilution of CTV fluorescent intensity. Shown are contour maps (left) of CTV intensity and statistics (right) of the gated OT-II T cells (n = 4). (B) OT-II T cell proliferation stimulated by OVA323–339 peptide or anti-IgM-OVA loaded in vivo–generated GC B cells. Proliferation of OT-II T cells was measured based on the dilution of CTV fluorescent intensity. Shown are contour maps (left) of CTV intensity and statistics (right) of the gated OT-II T cells (n = 4). (C and D) Naive Cbl−/−Cbl-b−/− B cells are deficient in cognate interaction with T cells upon anti-IgM-OVA stimulation. Naive WT or Cbl−/−Cbl-b−/− B cells and OT-II T cells were labeled with CellTrace (red) and CFSE (green), respectively, and co-cultured in the presence of OVA323–339 (C) or anti-IgM-OVA (D). 5 h later, T–B cell conjugates were analyzed by flow cytometry. Shown are FACS analyses (left) and statistics (right) of T–B cell conjugates in the culture (n = 4). (E) FACS analyses of ex vivo antigen presentation of Eα52–68 peptide in naive B and GC B cells from WT and Cbl−/−Cbl-b−/− mice. Shown are histogram comparisons of Eα52–68 peptide on naive B (left) and GC B cells (right; n = 4). (F and G) Rescues of GC responses in Cbl−/−Cbl-b−/− mice by peptide antigen. Shown are FACS analyses (left) and statistics of GC B (F) and Tfh (G) cells in WT or Cbl−/−Cbl-b−/− mice with or without OVA323–339 peptide injection (n = 4). Data are shown as means ± SD (A–G) and from at two independent experiments (B–D, F, and G) and three independent experiments (A and E). *, P < 0.05; **, P < 0.01; ***, P < 0.001 (A–E, unpaired Student’s t test; F and G, one-way ANOVA multiple comparison test).
Figure 4.
Figure 4.
Impaired BCR-mediated antigen endocytosis and postendocytic sorting to lysosomes by Cbl−/−Cbl-b−/− B cells. (A and B) FACS analyses of BCR downmodulation in Cbl−/−Cbl-b−/− B cells. Naive B cells (A) or GC B cells (B) were stimulated with biotinylated anti-IgM (Fab)2 for various periods. Cell surface remaining IgM was stained by streptavidin-FITC and quantified by FACS. Shown are the statistics of IgM downmodulation on WT and Cbl−/−Cbl-b−/− naive (A) or GC (B) B cells (n = 3). (C) FACS analyses of BCR-mediated antigen degradation in naive B cells. Naive WT and Cbl−/−Cbl-b−/− B cells were stimulated with the lysosome sensor for various times. Percentages of Atto647N+ cells and the intensity of Atto647N signal in gated lysosome sensor degraded cells are determined by FACS analysis (n = 3). (D) FACS analyses of BCR-mediated antigen degradation in GC B cells. WT and Cbl−/−Cbl-b−/− GC B cells were stimulated with the lysosome sensor for various times. Percentages of Atto647N+ cells and the intensity of Atto647N signal in gated lysosome sensor degraded cells were determined by FACS analysis (n = 4). (E) Confocal microscopic analyses of BCR-endocytic trafficking. Shown are confocal microscopic images (left) of the BCR (green) vs. degraded lysosome sensor (red) and statistics (right) of BCR and lysosome colocalization before and after 30-min incubation at 37°C (n = 20). (F) Colocalization analysis of internalized BCR and lysosomes in Cbl−/−Cbl-b−/− B cells. Shown are confocal images (left) of BCR (green) vs. Lamp-1 staining and statistics (right) of BCR and lysosome colocalization in naive B cells (n = 20). Data are shown as means ± SD (A–F) and from three independent experiments (A–D and E) and two independent experiments (F). ***, P < 0.001 (E and F, unpaired Student’s t test; A–D, two-way ANOVA multiple comparison test).
Figure 5.
Figure 5.
Ubiquitination of CD79A and CD79B by Cbls and its relevance in BCR internalization and sorting to lysosomes. (A and B) Ubiquitination (Ub) of CD79A and CD79B in naive and iGC B cells. Naive or in vitro iGC B cells from WT and Cbl−/−Cbl-b−/− mice were stimulated with anti-IgM, respectively. Shown are the ubiquitination status of CD79A (left) and CD79B (right) in naive B cells (A) and iGC B cells (B), respectively (n = 2). IP, immunoprecipitation. (C and D) Blockade of CD79A but not CD79B ubiquitination reduces BCR downmodulation. Naive B cells expressing a WT or mutant CD79A (CD79A3K>R) or CD79B (CD79B3K>R) were stimulated with biotinylated anti-IgM (Fab)2 for various periods. Cell surface remaining IgM were visualized by streptavidin-FITC staining. Shown are the statistics comparisons of cell surface IgM downmodulation in WT vs. CD79A3K>R (C) or WT vs. CD79B3K>R (D) B cells (n = 3). (E and F) Blockade of CD79A or CD79B ubiquitination attenuates internalized BCR trafficking to lysosomes. WT or CD79A3K>R- or CD79B3K>R-expressing B cells were stimulated with the lysosome degradation sensor. The percentage of cells with the sensor degradation (Alexa Fluor 647+) was measured by FACS. Shown are FACS contour maps (top) and statistics (bottom) of lysosome sensor degradation in WT vs. CD79A3K>R (E) or WT vs. CD79B3K>R (F) B cells (n = 5). Data are shown as means ± SD and from two independent experiments (A–F). **, P < 0.01; ***, P < 0.001 (C–F, two-way ANOVA multiple comparison test).
Figure S4.
Figure S4.
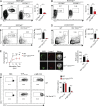
CD79A and CD79B mutagenesis studies. (A) Schematic of CD79A and CD79B mutations to block ubiquitination. (B) Histogram analyses of IgM and IgD staining of WT vs. CD79A3K>R or WT vs. CD79B3K>R splenic B cells from the corresponding BM chimeric mice (n = 3). (C) FACS analyses of CD21 vs. CD23 staining of B cell development in WT, CD79A3K>R, and CD79B3K>R BM chimeric mice (n = 3). (D) FACS analysis of BCR-induced signaling in WT and CD79A3K>R B cells. Shown are histograms of Ca2+ influx (left), pS6 (top right), and pErk1/2 (bottom right) in unstimulated and BCR-stimulated B cells (n = 3). (E) FACS analyses of IRF4 expression in WT and Cbl−/−Cbl-b−/− naive B cells (n = 3). Data are shown as mean ± SEM of two independent experiments (C–E).
Figure 6.
Figure 6.
Essential roles of Cbl ubiquitin ligase activity and CD79A or CD79B ubiquitination in GC reaction. (A and B) Blockade of CD79A or CD79B ubiquitination impairs GC development. Shown are FACS contour maps (left) and statistics (right) of GC B cells in WT and CD79A3K>R (A) or WT and CD79B3K>R (B) BM chimeric mice after NP-KLH immunization, respectively (n = 5). (C and D) Inactivation of Cbl ubiquitin ligase activity impairs GC reaction. Shown are FACS contour maps (left) and statistics (right) of GC B cells (C) or Tfh cells (D) in NP-KLH immunized WT and Cbl−/−Cbl-bC373A mice (n = 5). (E) FACS analyses of BCR downmodulation in Cbl−/−Cbl-bC373A B cells. Naive B cells were stimulated with biotinylated anti-IgM (Fab)2 for various periods. Cell surface remaining IgM was stained by streptavidin-FITC and quantified by FACS. Shown are the statistics of cell surface IgM dowmodulation of WT and Cbl−/−Cbl-bC373A naive B cells (n = 3). (F) Colocalization analysis of internalized BCR and lysosomes in Cbl−/−Cbl-bC373A B cells. Shown are confocal images (left) of BCR (green) vs. LAMP-1 (red) staining and statistical analysis (right) of BCR and lysosome colocalization in WT and Cbl−/−Cbl-bC373A naive B cells (n = 20). (G) OT-II T cell proliferation stimulated by OVA323–339 peptide or anti-IgM-OVA loaded naive Cbl−/−Cbl-bC373A B cells. Proliferation of OT-II T cells are measured based on the dilution of CTV fluorescent intensity. Shown are contour maps (left) of CTV intensity and statistics (right) of the gated OT-II T cells (n = 4). Data are shown as means ± SD (A–G) and from two independent experiments (C–F) and three independent experiments (A, B, and G). **, P < 0.01; ***, P < 0.001. (B–D, F, and G, unpaired Student’s t test; E, two-way ANOVA multiple comparison test).
Figure 7.
Figure 7.
Cbl−/−Cbl-b−/− mice are deficient in mounting anti-helminth antibody responses. (A and B) Reduced GC B and Tfh cells in Cbl−/−Cbl-b−/− mice relative to WT controls after Hpb infection. Shown are FACS contour maps of GC B cells (top panel) and Tfh cells (bottom panel) from draining LNs (A) and spleen (B) of Hpb-infected WT and Cbl−/−Cbl-b−/− mice (n = 8). (C) ELISA analysis of serum titers of anti-Hpb IgG1 after Hpb challenge (n = 9). (D) Egg counts/gram of feces from Hpb infected mice after Hpb challenge (n = 9). (E) Worm load (worms/mouse) in Hpb-infected mice after Hpb challenge (n = 9). Data are shown as means ± SD (A, B, D, and E) and are pooled results from two independent experiments; data in C are representative of two independent experiments with at least four mice/group for each experiment. *, P < 0.05; **, P < 0.01; ***, P < 0.001 (A and B, unpaired Student’s t test; C–E, one-way ANOVA multiple comparison test).

Comment in

  • Cbls boost B cells.
    Linterman MA. Linterman MA. J Exp Med. 2020 Sep 7;217(9):e20201105. doi: 10.1084/jem.20201105. J Exp Med. 2020. PMID: 32813871 Free PMC article.

Similar articles

Cited by

References

    1. Allen C.D., Okada T., and Cyster J.G.. 2007. Germinal-center organization and cellular dynamics. Immunity. 27:190–202. 10.1016/j.immuni.2007.07.009 - DOI - PMC - PubMed
    1. Avalos A.M., and Ploegh H.L.. 2014. Early BCR Events and Antigen Capture, Processing, and Loading on MHC Class II on B Cells. Front. Immunol. 5:92 10.3389/fimmu.2014.00092 - DOI - PMC - PubMed
    1. Batista F.D., and Harwood N.E.. 2009. The who, how and where of antigen presentation to B cells. Nat. Rev. Immunol. 9:15–27. 10.1038/nri2454 - DOI - PubMed
    1. Blum J.S., Wearsch P.A., and Cresswell P.. 2013. Pathways of antigen processing. Annu. Rev. Immunol. 31:443–473. 10.1146/annurev-immunol-032712-095910 - DOI - PMC - PubMed
    1. Chaturvedi A., Martz R., Dorward D., Waisberg M., and Pierce S.K.. 2011. Endocytosed BCRs sequentially regulate MAPK and Akt signaling pathways from intracellular compartments. Nat. Immunol. 12:1119–1126. 10.1038/ni.2116 - DOI - PMC - PubMed

Publication types

MeSH terms