

Translatome Analyses Using Conditional Ribosomal Tagging in GABAergic Interneurons and Other Sparse Cell Types
- PMID: 32584517
- PMCID: PMC7317066
- DOI: 10.1002/cpns.93
Translatome Analyses Using Conditional Ribosomal Tagging in GABAergic Interneurons and Other Sparse Cell Types
Abstract
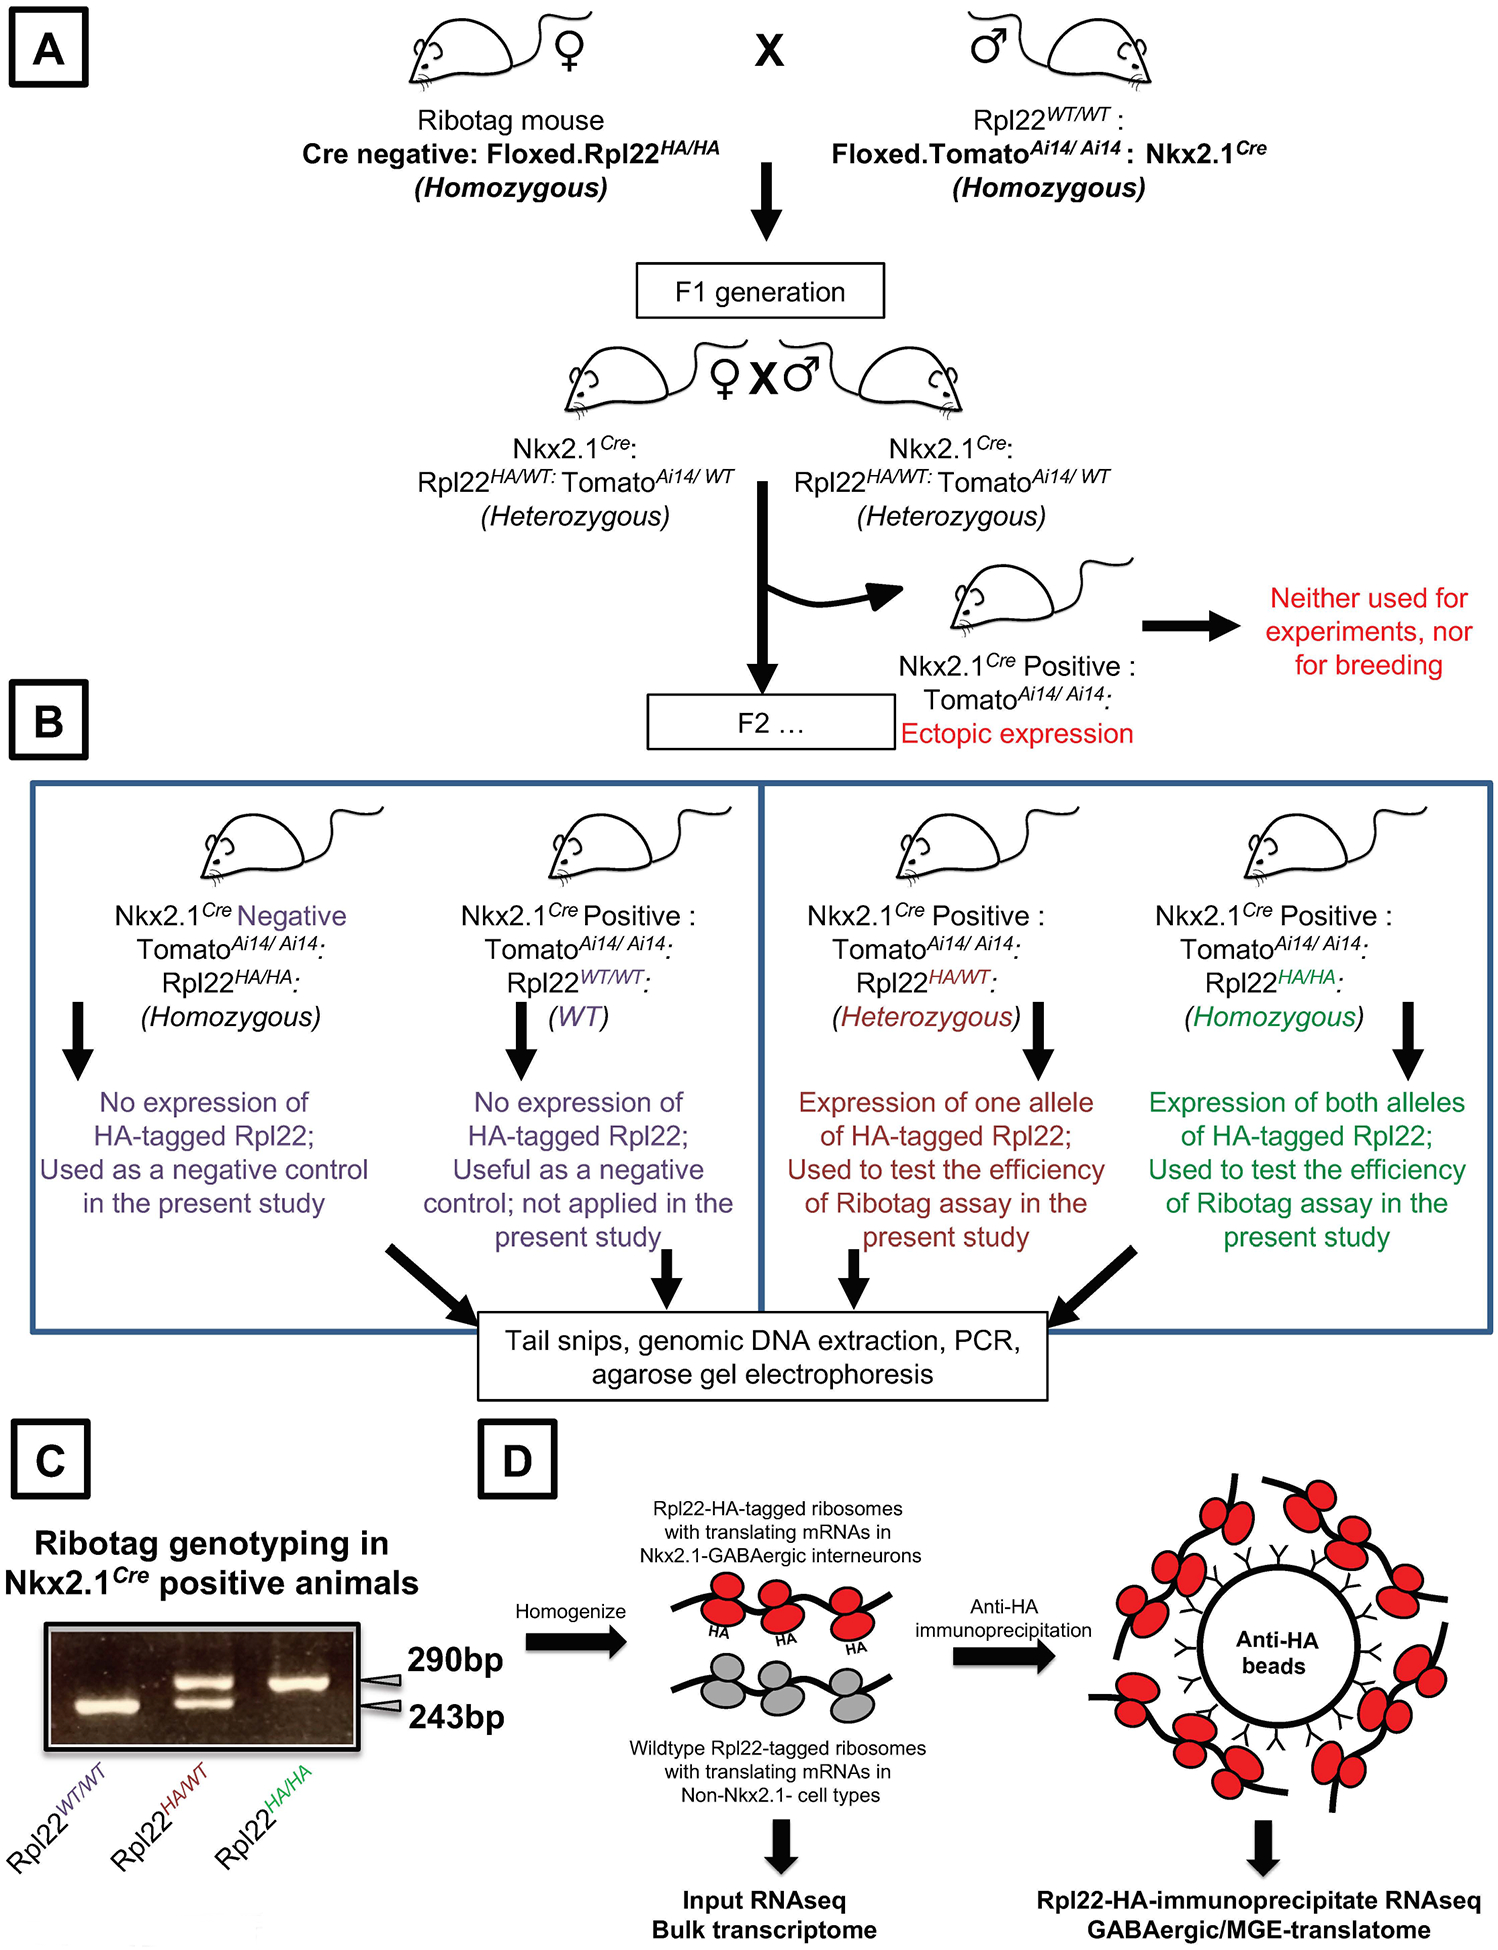
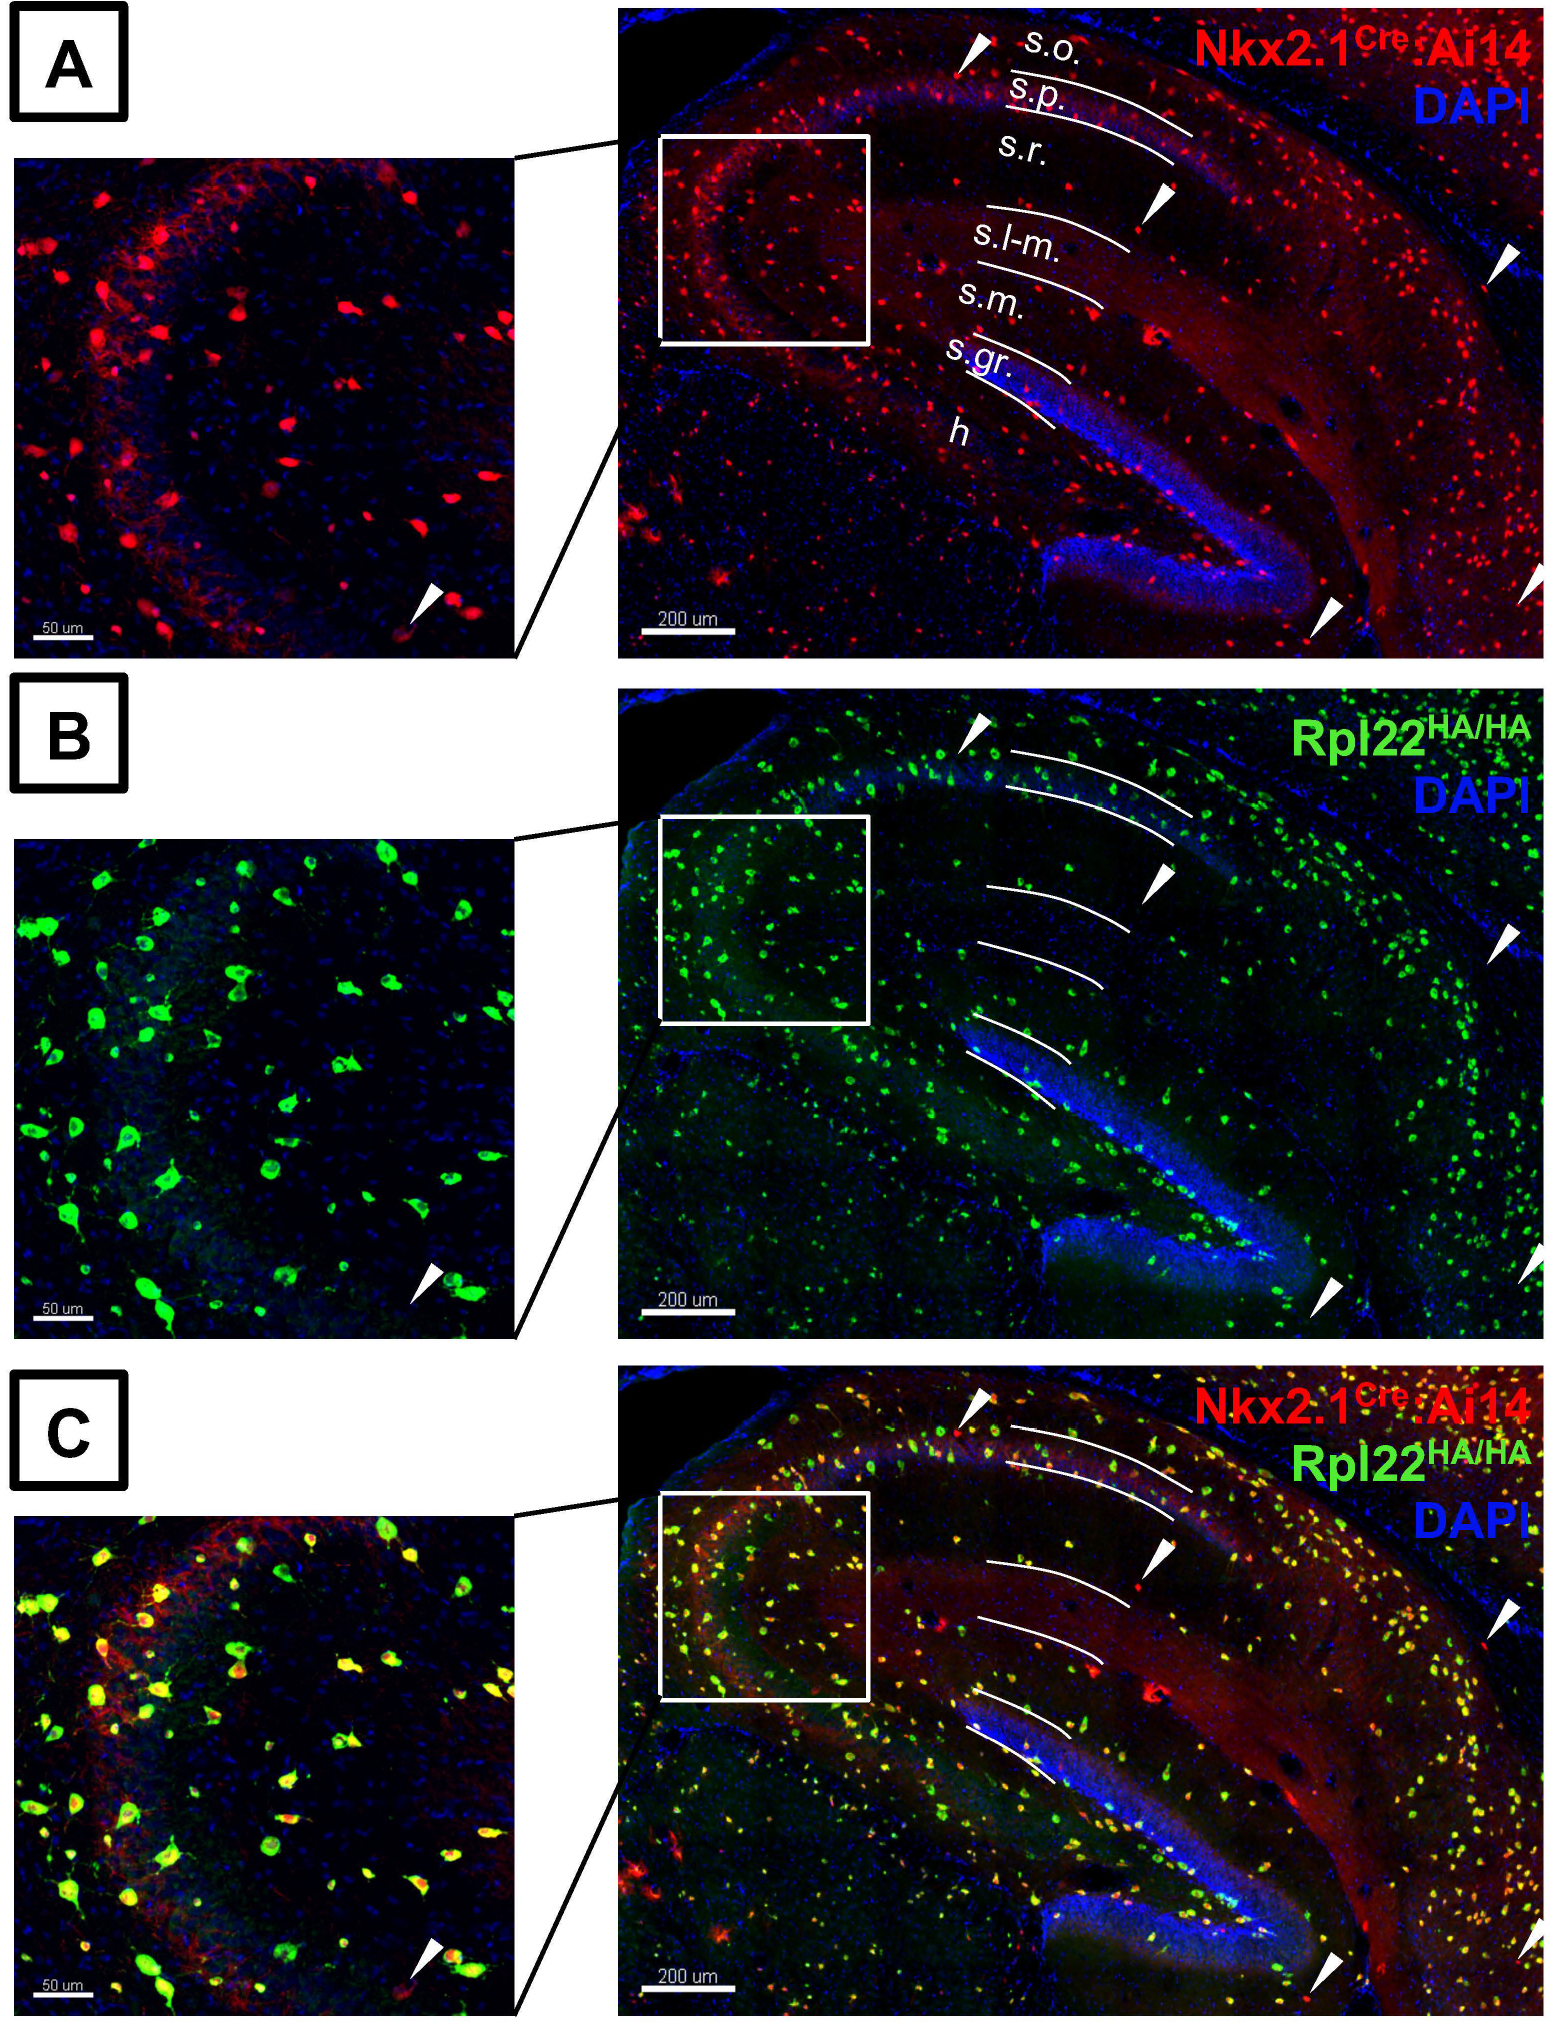
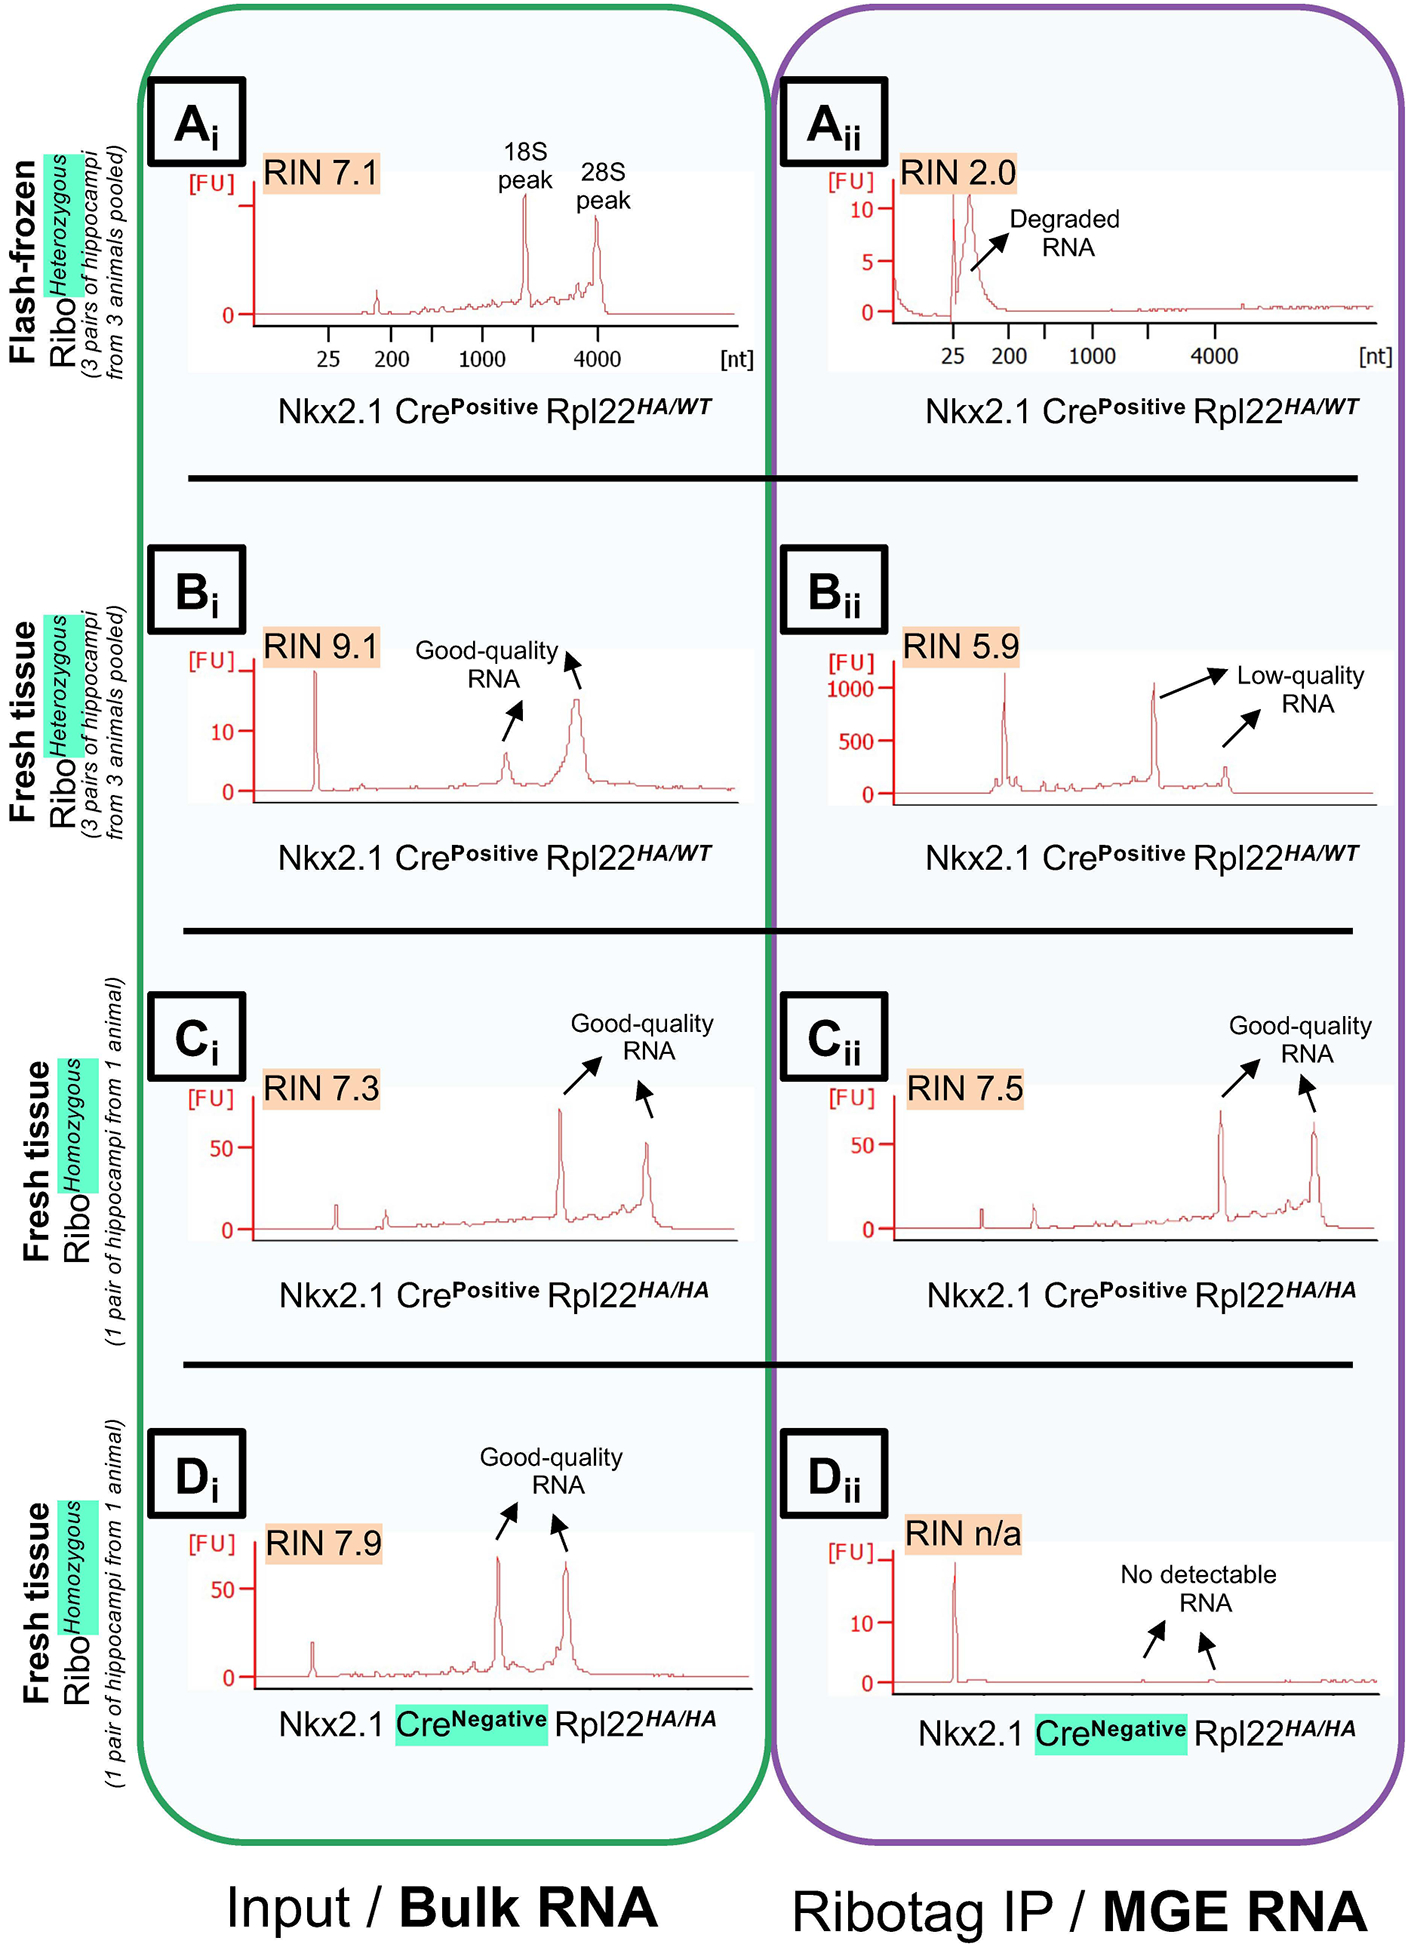
GABAergic interneurons comprise a small but diverse subset of neurons in the mammalian brain that tightly regulate neuronal circuit maturation and information flow and, ultimately, behavior. Because of their centrality in the etiology of numerous neurological disorders, examining the molecular architecture of these neurons under different physiological scenarios has piqued the interest of the broader neuroscience community. The last few years have seen an explosion in next-generation sequencing (NGS) approaches aimed at identifying genetic and state-dependent subtypes in neuronal diversity. Although several approaches are employed to address neuronal molecular diversity, ribosomal tagging has emerged at the forefront of identifying the translatomes of neuronal subtypes. This approach primarily relies on Cre recombinase-driven expression of hemagglutinin A (HA)-tagged RiboTag mice exclusively in the neuronal subtype of interest. This allows the immunoprecipitation of cell-type-specific, ribosome-engaged mRNA, expressed both in the soma and the neuronal processes, for targeted quantitative real-time PCR (qRT-PCR) or high-throughput RNA sequencing analyses. Here we detail the typical technical caveats associated with successful application of the RiboTag technique for analyzing GABAergic interneurons, and in theory other sparse cell types, in the central nervous system. Published 2020. U.S. Government. Basic Protocol 1: Breeding mice to obtain RiboTag homozygosity Support Protocol 1: Detection of ectopic Cre recombinase expression Basic Protocol 2: The RiboTag assay Support Protocol 2: Real-time quantitative PCR (qRT-PCR) assay of RiboTag-derived cell-type-specific RNA Support Protocol 3: Construction of cell-type-specific RNA-seq library Support Protocol 4: Secondary analyses of RiboTag-derived RNA-seq dataset.
Keywords: GABAergic; RiboTag; Translation affinity purification TRAP RNA-seq; immunoprecipitation; interneuron.
Published 2020. This article is a US Government work and is in the public domain in the USA.
Figures
Similar articles
-
RiboTag: Ribosomal Tagging Strategy to Analyze Cell-Type-Specific mRNA Expression In Vivo.Curr Protoc Neurosci. 2019 Jun;88(1):e77. doi: 10.1002/cpns.77. Curr Protoc Neurosci. 2019. PMID: 31216392 Free PMC article.
-
A comparative analysis of library prep approaches for sequencing low input translatome samples.BMC Genomics. 2018 Sep 21;19(1):696. doi: 10.1186/s12864-018-5066-2. BMC Genomics. 2018. PMID: 30241496 Free PMC article.
-
Cell-type-specific isolation of ribosome-associated mRNA from complex tissues.Proc Natl Acad Sci U S A. 2009 Aug 18;106(33):13939-44. doi: 10.1073/pnas.0907143106. Epub 2009 Aug 4. Proc Natl Acad Sci U S A. 2009. PMID: 19666516 Free PMC article.
-
Hippocampal GABAergic Inhibitory Interneurons.Physiol Rev. 2017 Oct 1;97(4):1619-1747. doi: 10.1152/physrev.00007.2017. Physiol Rev. 2017. PMID: 28954853 Free PMC article. Review.
-
Generation of cerebral cortical GABAergic interneurons from pluripotent stem cells.Stem Cells. 2020 Nov;38(11):1375-1386. doi: 10.1002/stem.3252. Epub 2020 Sep 2. Stem Cells. 2020. PMID: 32638460 Review.
Cited by
-
NMDARs Drive the Expression of Neuropsychiatric Disorder Risk Genes Within GABAergic Interneuron Subtypes in the Juvenile Brain.Front Mol Neurosci. 2021 Sep 14;14:712609. doi: 10.3389/fnmol.2021.712609. eCollection 2021. Front Mol Neurosci. 2021. PMID: 34630033 Free PMC article.
-
Divergent opioid-mediated suppression of inhibition between hippocampus and neocortex across species and development.bioRxiv [Preprint]. 2025 Jan 23:2024.01.20.576455. doi: 10.1101/2024.01.20.576455. bioRxiv. 2025. Update in: Neuron. 2025 Jun 4;113(11):1805-1822.e7. doi: 10.1016/j.neuron.2025.03.005. PMID: 38313283 Free PMC article. Updated. Preprint.
-
Divergent opioid-mediated suppression of inhibition between hippocampus and neocortex across species and development.Neuron. 2025 Jun 4;113(11):1805-1822.e7. doi: 10.1016/j.neuron.2025.03.005. Epub 2025 Mar 26. Neuron. 2025. PMID: 40147437
-
Improvement of sensory deficits in fragile X mice by increasing cortical interneuron activity after the critical period.Neuron. 2023 Sep 20;111(18):2863-2880.e6. doi: 10.1016/j.neuron.2023.06.009. Epub 2023 Jul 13. Neuron. 2023. PMID: 37451263 Free PMC article.
References
LITERATURE CITED:
-
- Bakken TE, Hodge RD, Miller JA, Yao Z, Nguyen TN, Aevermann B, Barkan E, Bertagnolli D, Casper T, Dee N, et al. 2018. Single-nucleus and single-cell transcriptomes compared in matched cortical cell types. PLOS ONE 13:e0209648 Available at: http://dx.plos.org/10.1371/journal.pone.0209648 [Accessed December 12, 2019]. - DOI - PMC - PubMed
-
- Biever A, Donlin-Asp PG, and Schuman EM 2019a. Local translation in neuronal processes. Current Opinion in Neurobiology 57:141–148. - PubMed
-
- Biever A, Glock C, Tushev G, Ciirdaeva E, Langer JD, and Schuman EM 2019b. Monosomes actively translate synaptic mRNAs in neuronal processes. bioRxiv:687475. Available at: - PubMed
-
- Caroni P 2015. Inhibitory microcircuit modules in hippocampal learning. Current Opinion in Neurobiology 35:66–73. Available at: http://www.sciencedirect.com/science/article/pii/S095943881500104X [Accessed May 25, 2016]. - PubMed
INTERNET RESOURCES:
-
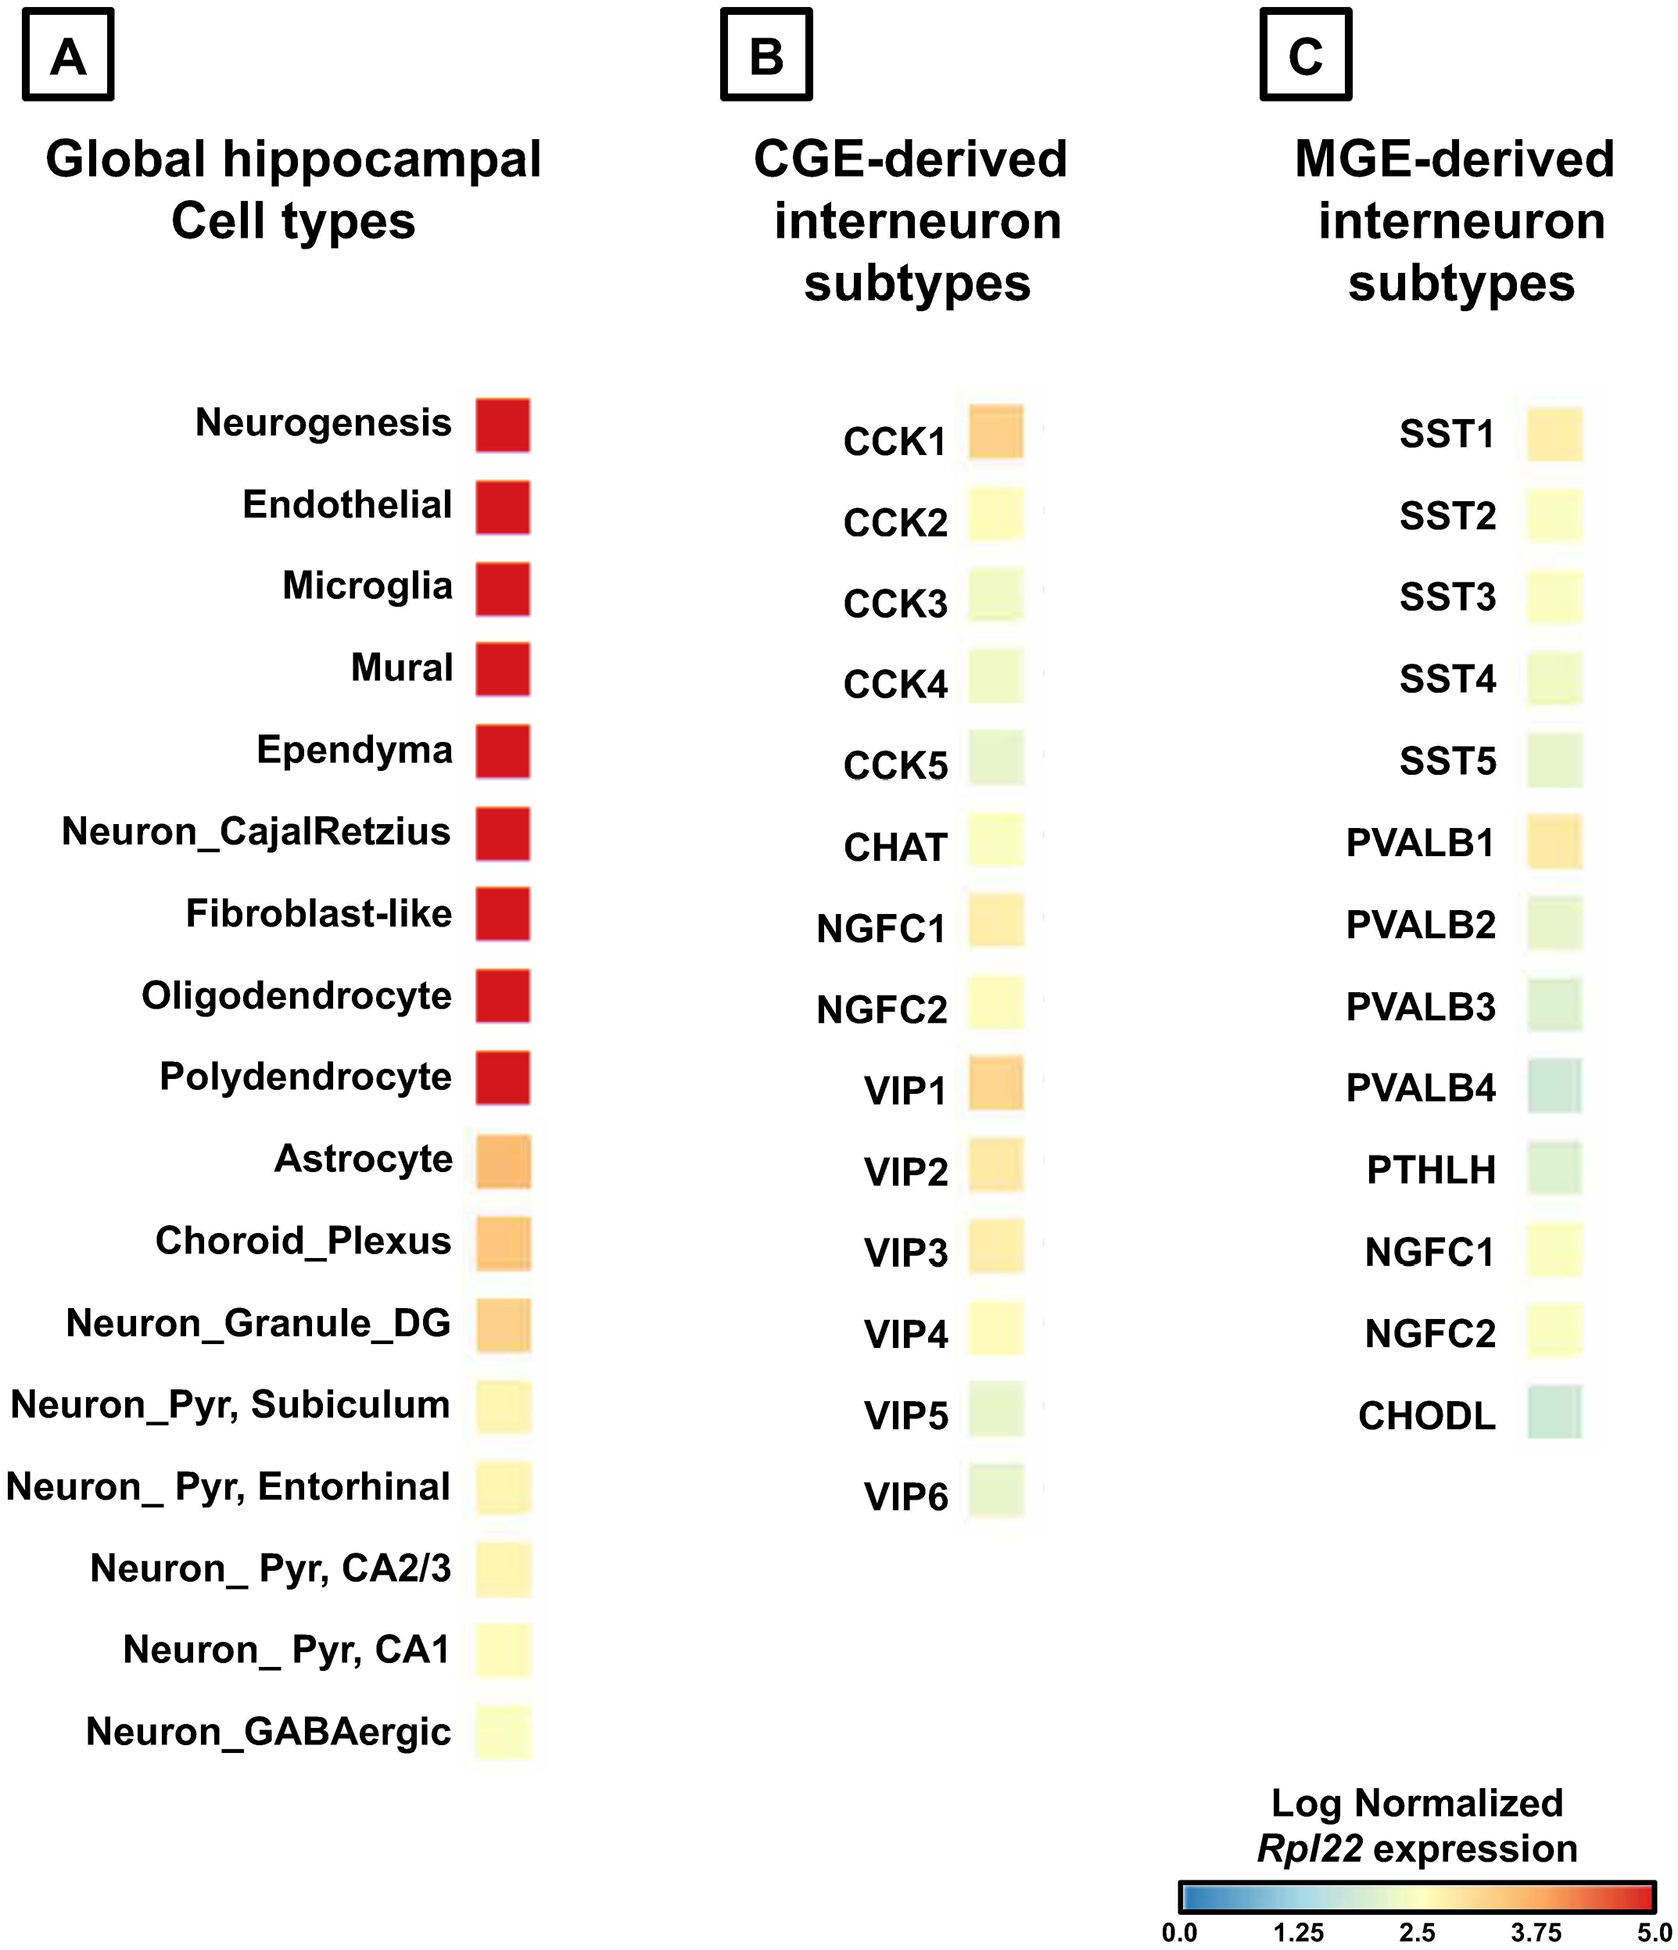
- Dropviz - http://dropviz.org/
- Dropviz is a publicly available scRNAseq dataset compiling the transcriptomes of 690,000 individual cells sampled from 9 regions of the adult mouse brain (Saunders et al., 2018).
-
- Morpheus - https://software.broadinstitute.org/morpheus/
- Morpheus is a versatile, easy-to-use web-resource to produce heatmaps from gene expression matrices.
-
- iDEP - http://bioinformatics.sdstate.edu/idep/
- iDEP is a publicly available RNAseq data secondary data analysis workflow that is reproducible, easy to use and intuitive for even naïve users (Ge et al., 2018).
-
- BoxPlotR - http://shiny.chemgrid.org/boxplotr/
- BoxPlotR is a publicly available, easy-to-use web-resource to generate box plots from gene expression matrices (Spitzer et al., 2014).
Publication types
MeSH terms
Substances
Grants and funding
LinkOut - more resources
Full Text Sources
Molecular Biology Databases
