. 2020 Aug 7;19(8):3510-3517.
doi: 10.1021/acs.jproteome.0c00332. Epub 2020 Jul 10.

Improving Proteoform Identifications in Complex Systems Through Integration of Bottom-Up and Top-Down Data

Affiliations

Improving Proteoform Identifications in Complex Systems Through Integration of Bottom-Up and Top-Down Data

Leah V Schaffer et al. J Proteome Res. .

Abstract

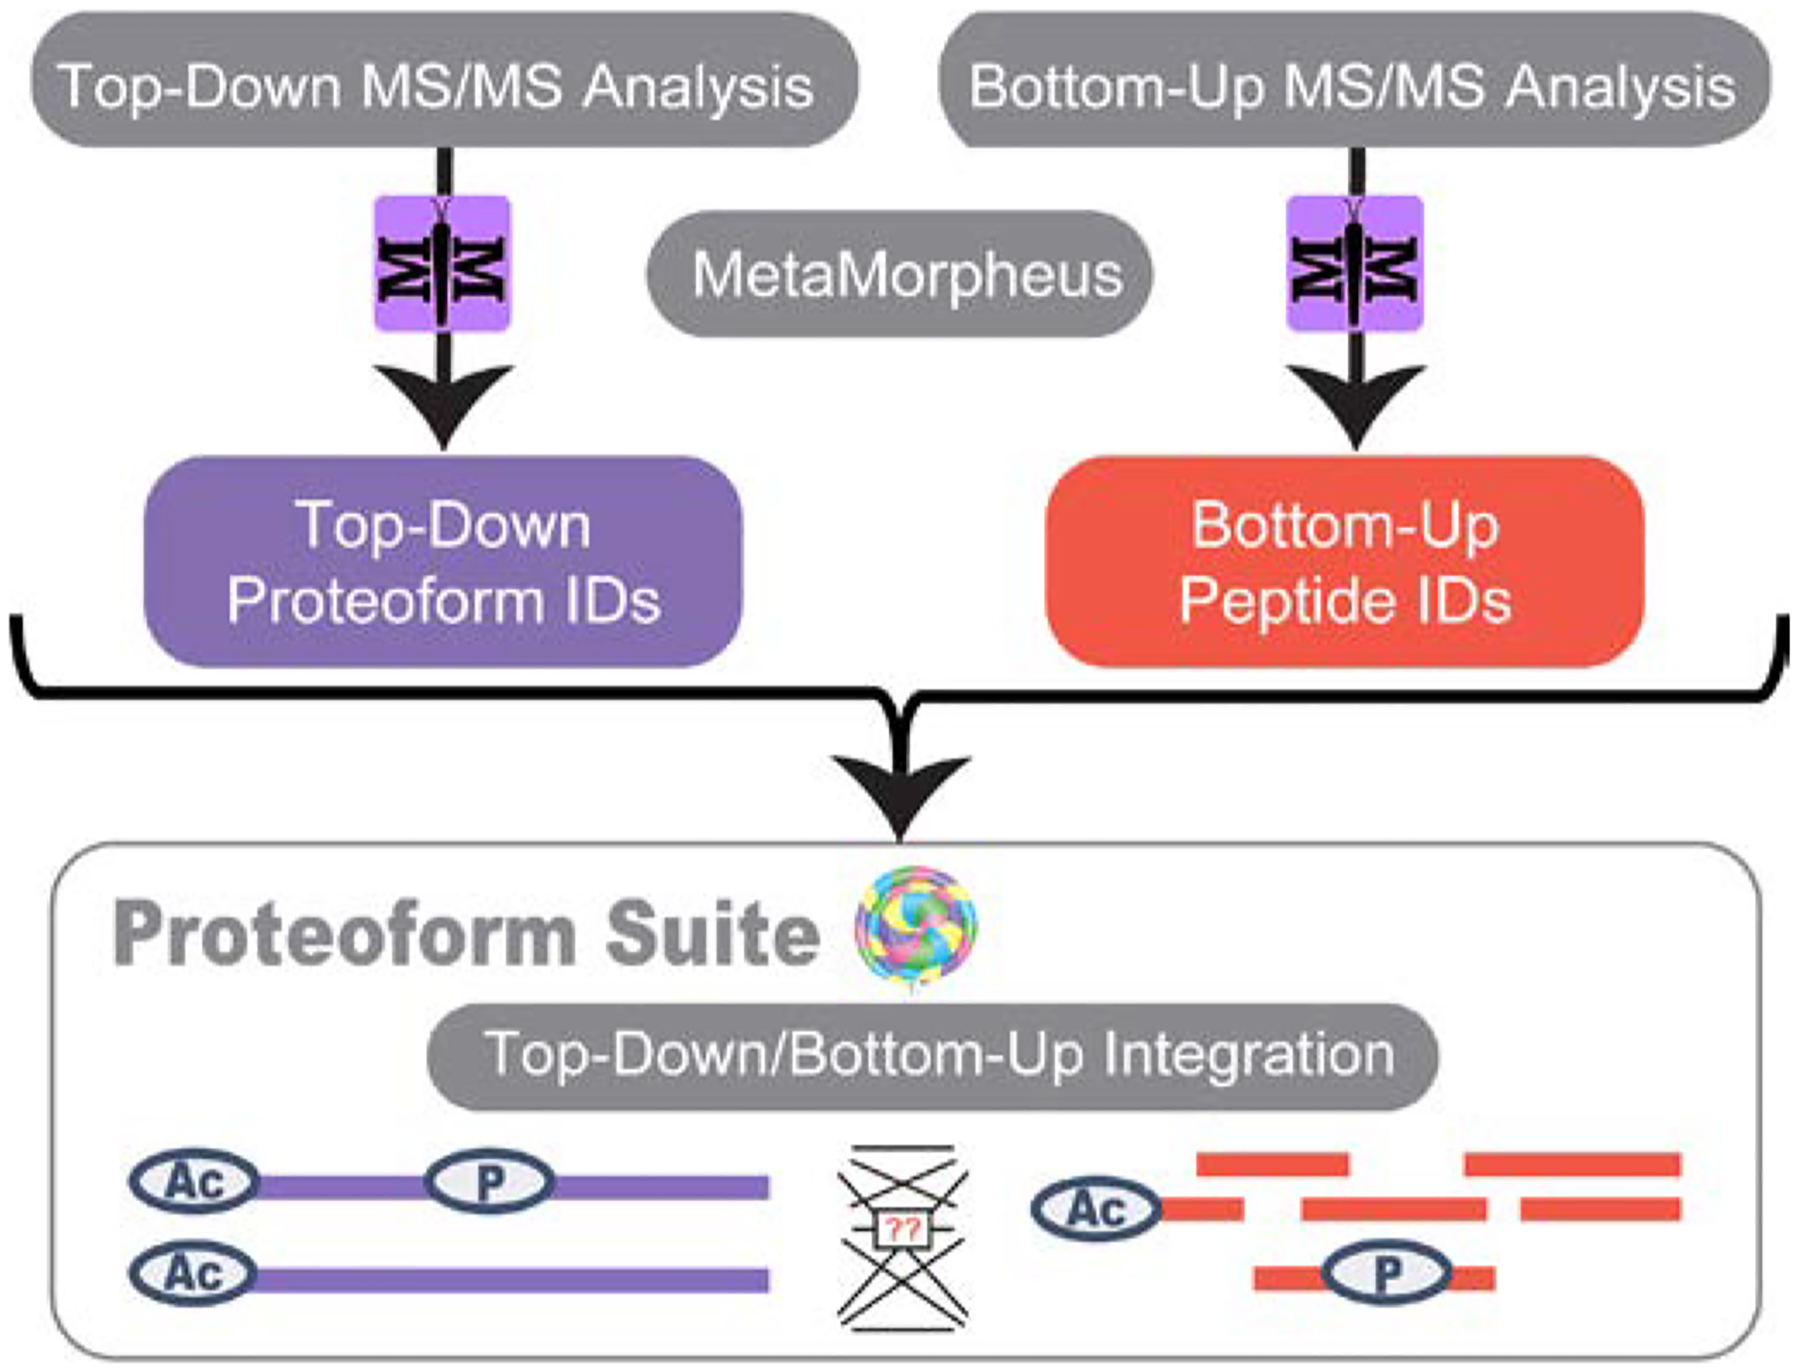
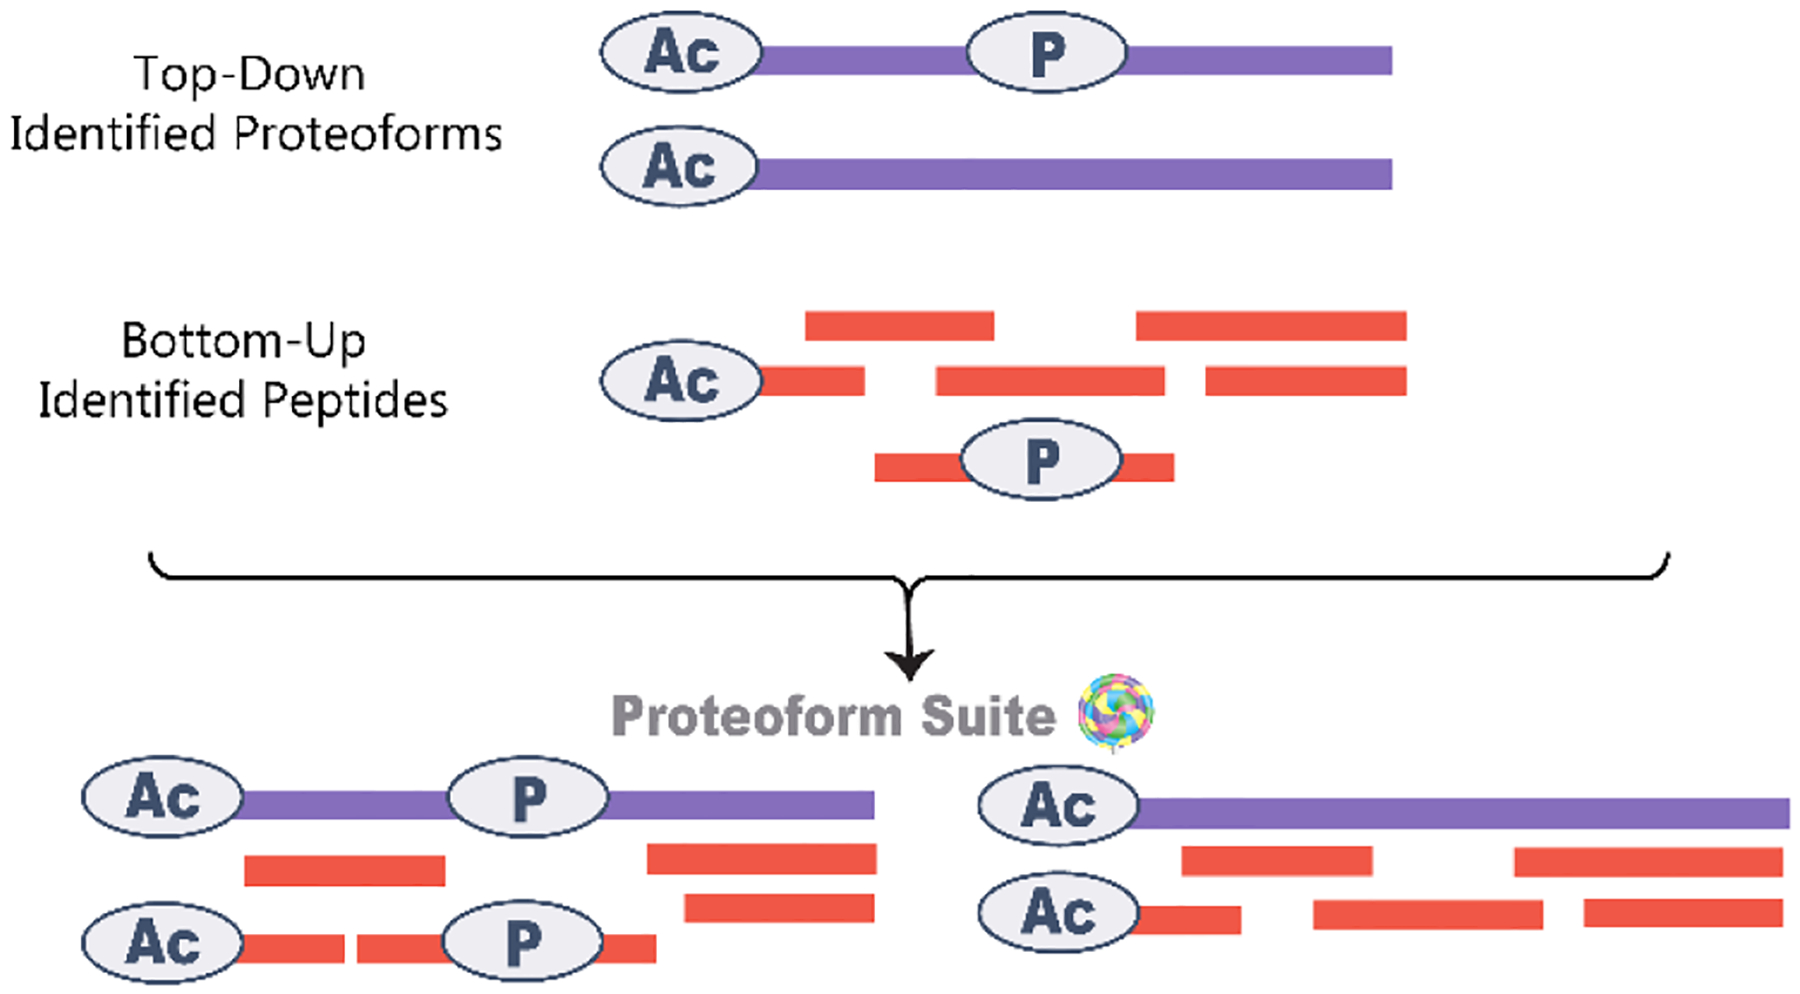
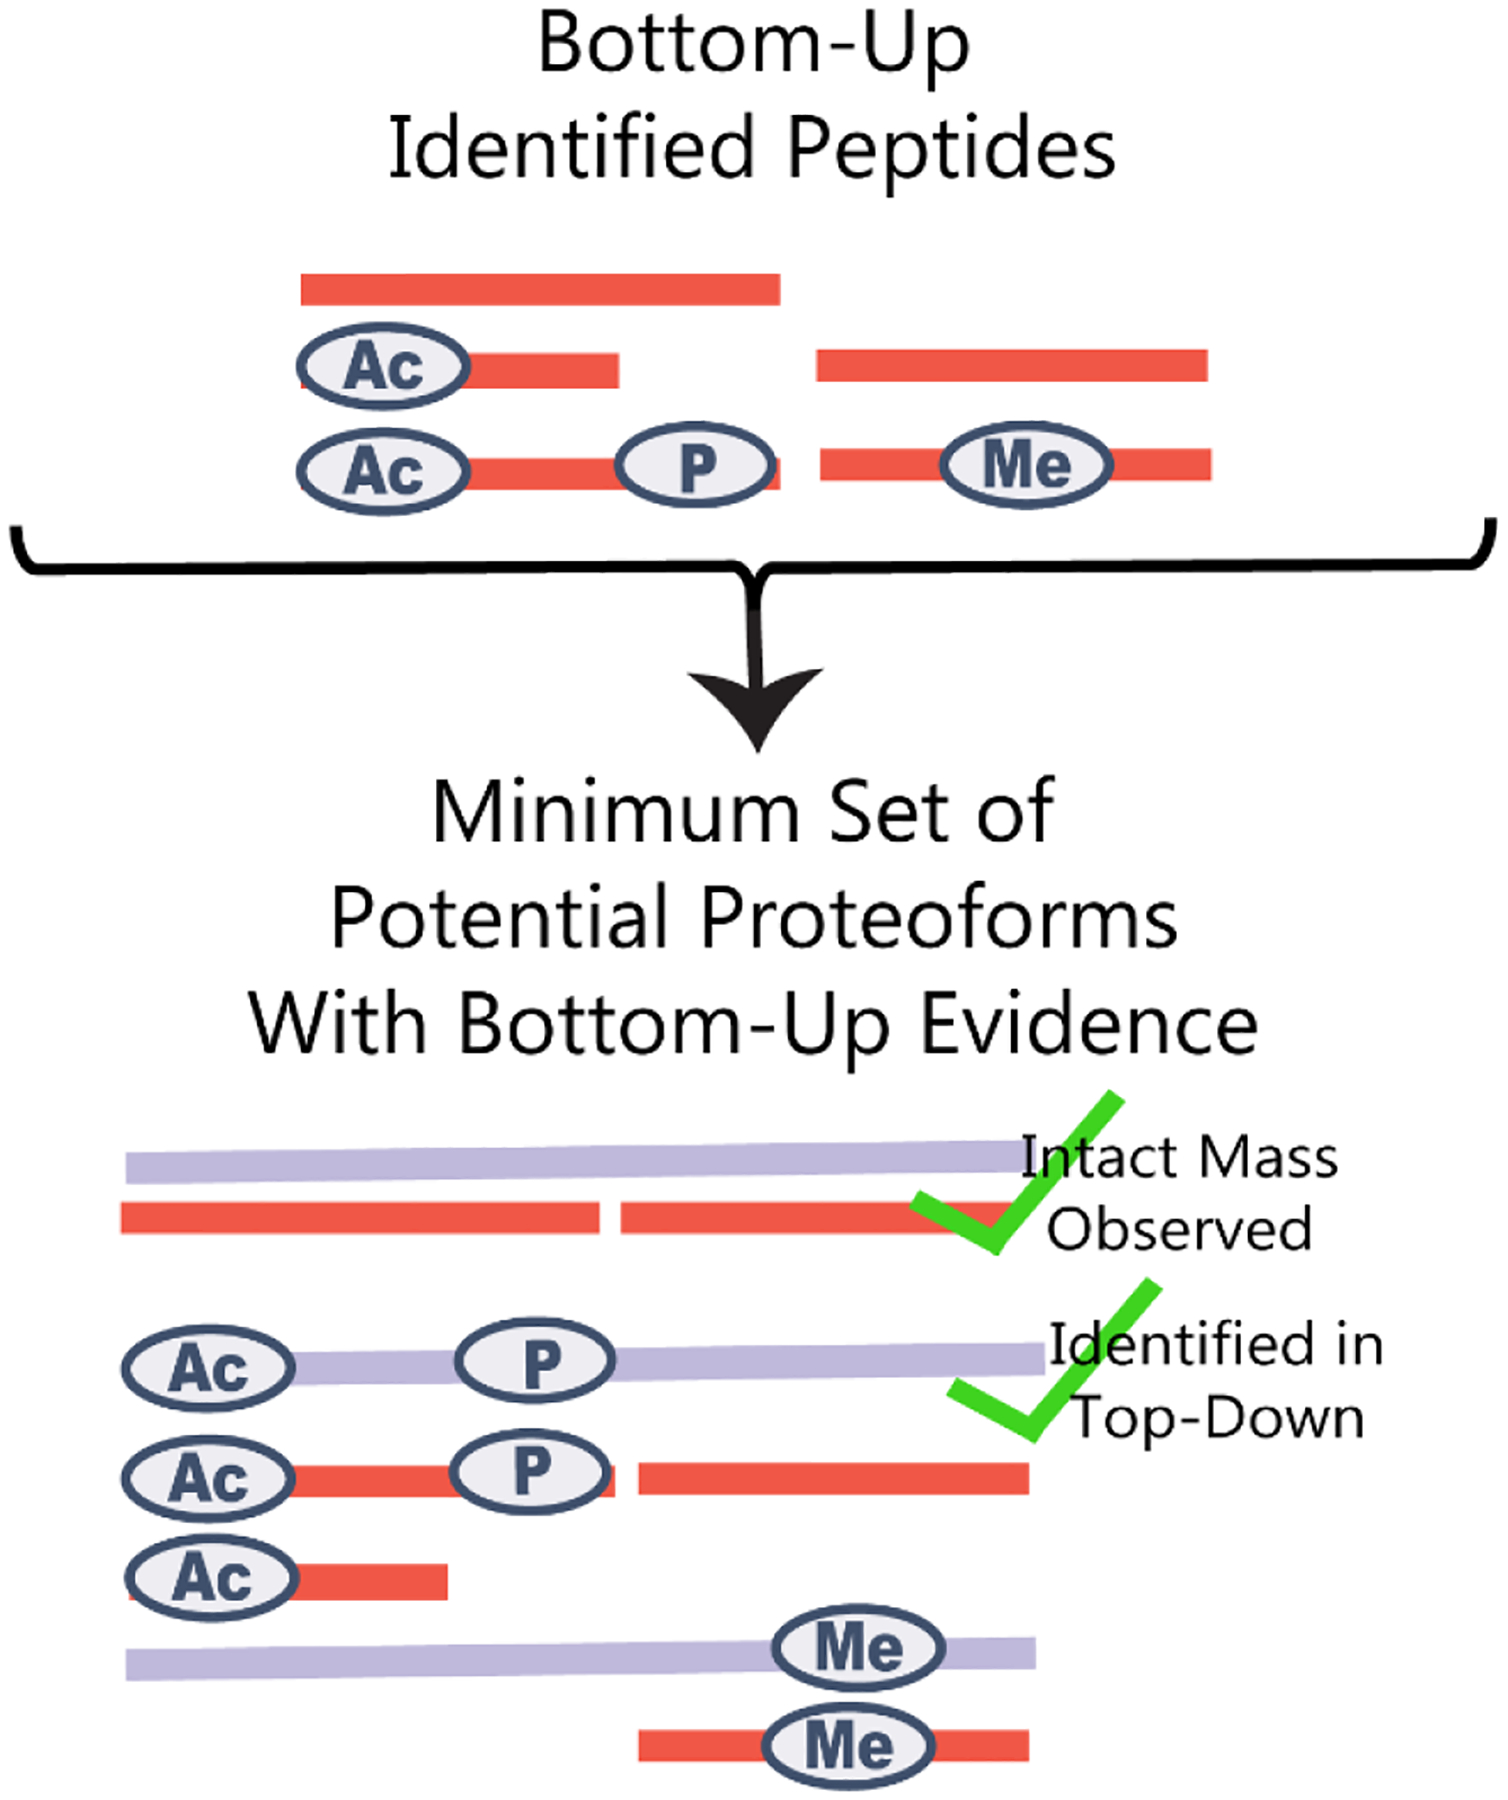
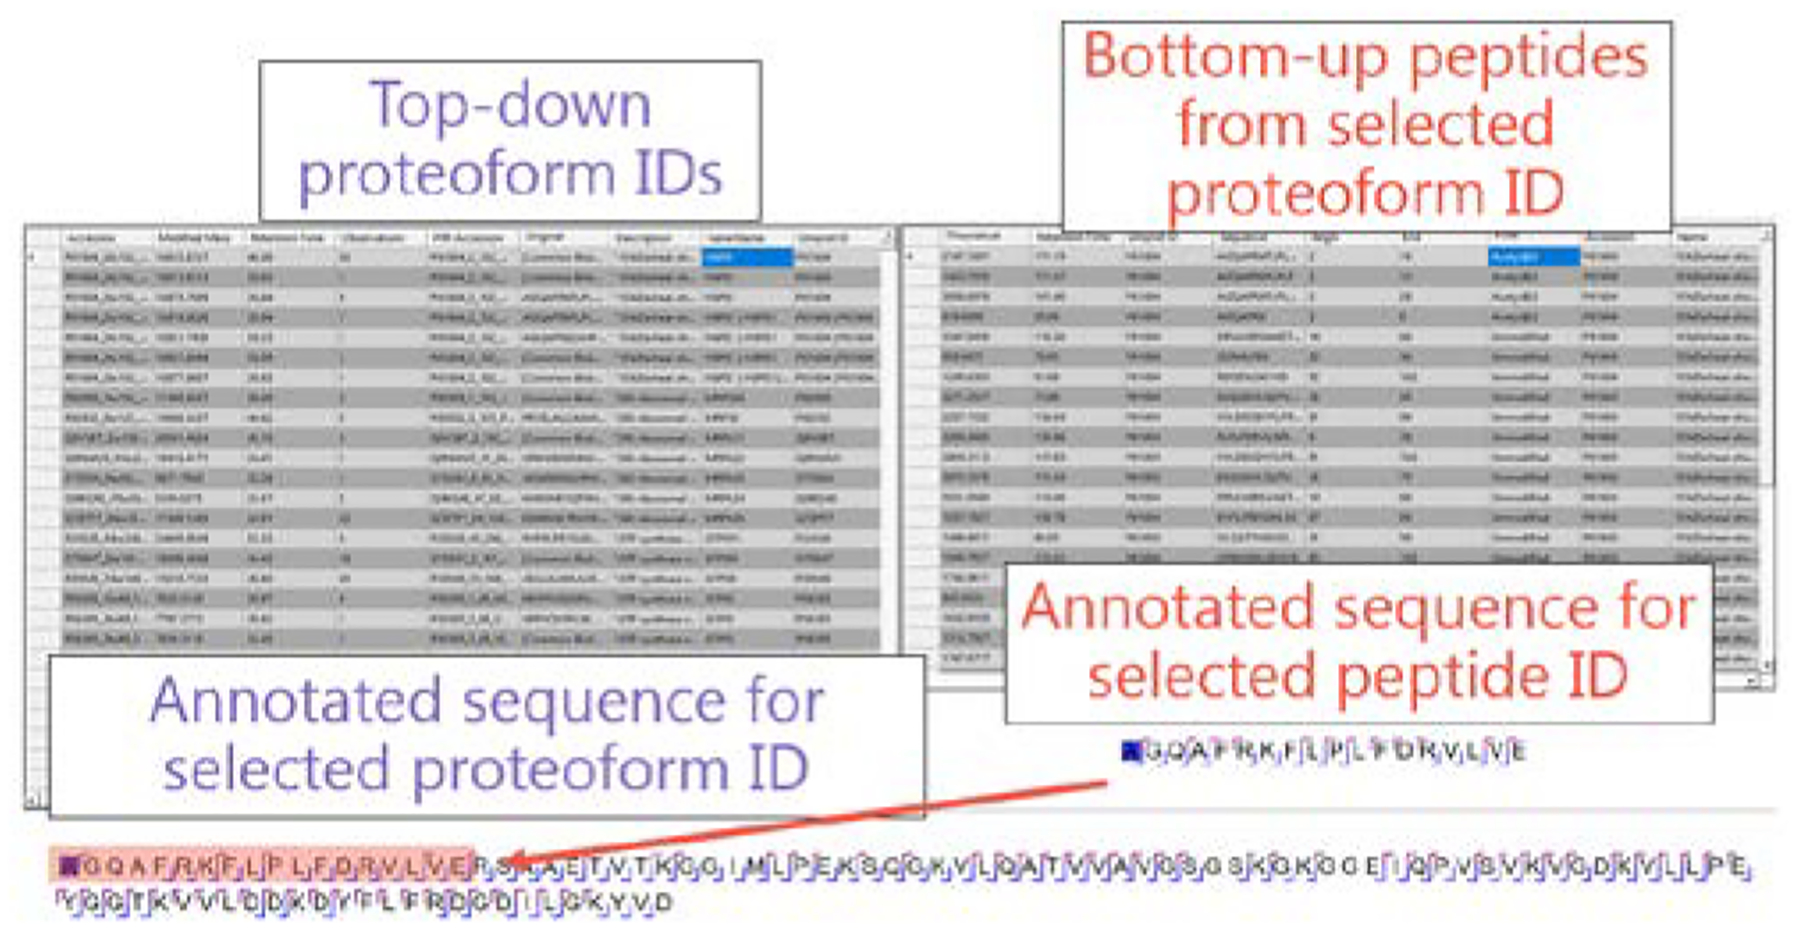
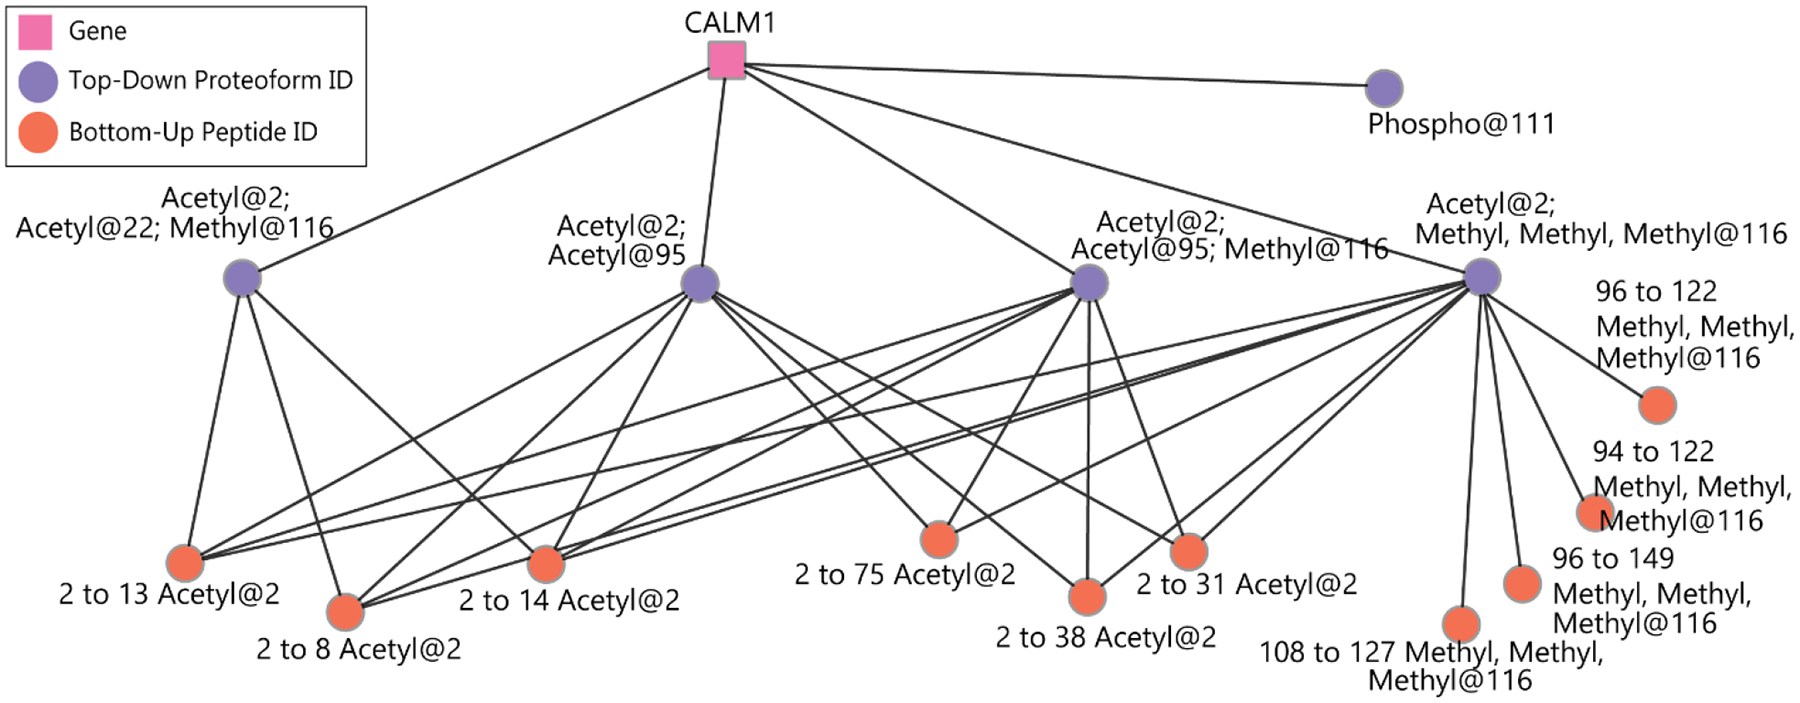
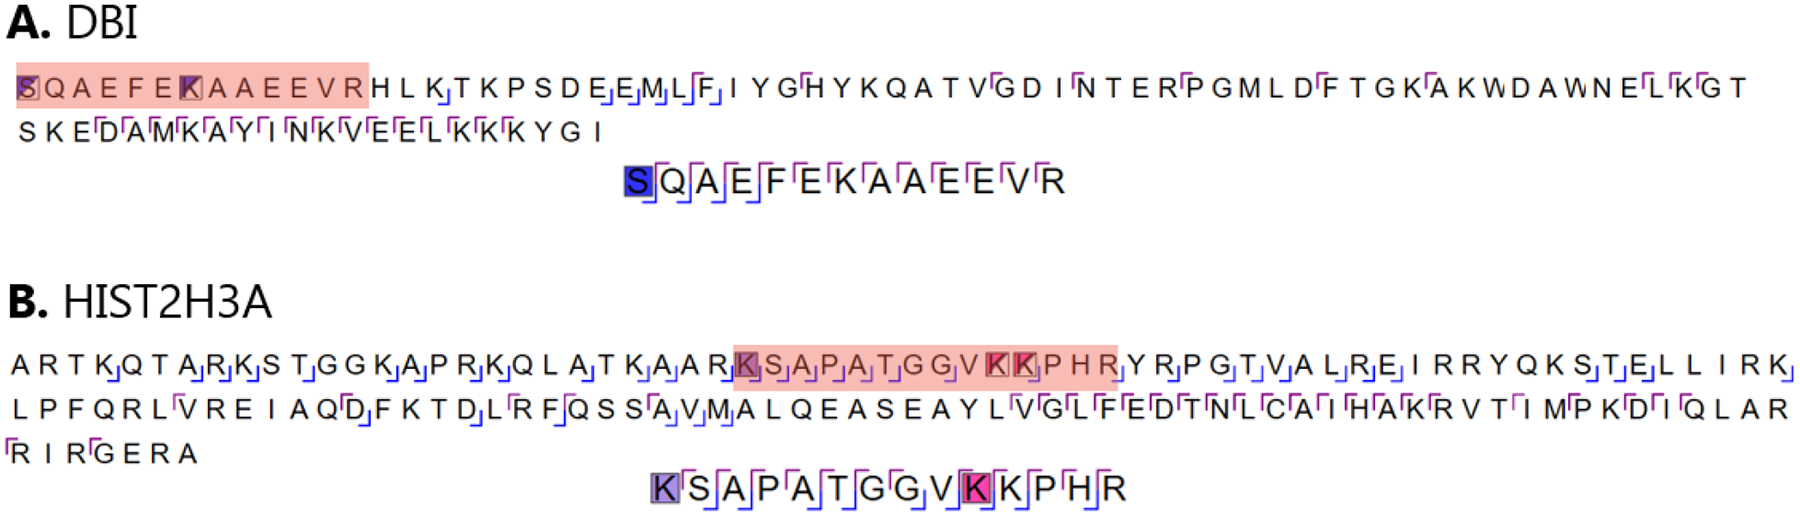
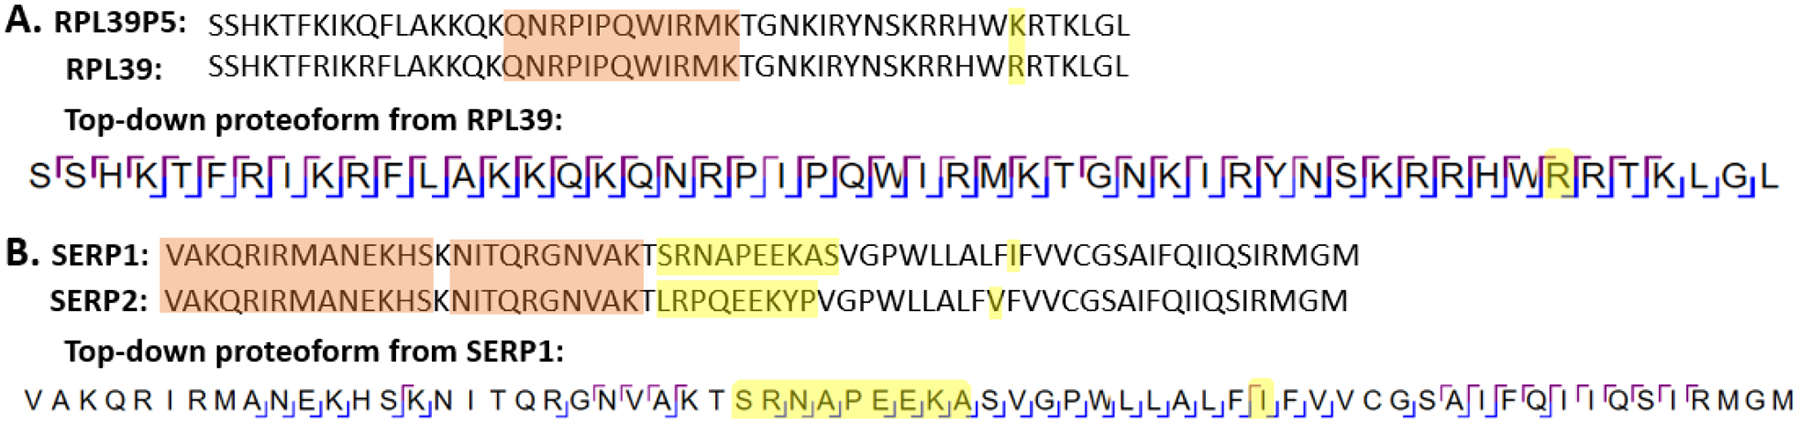
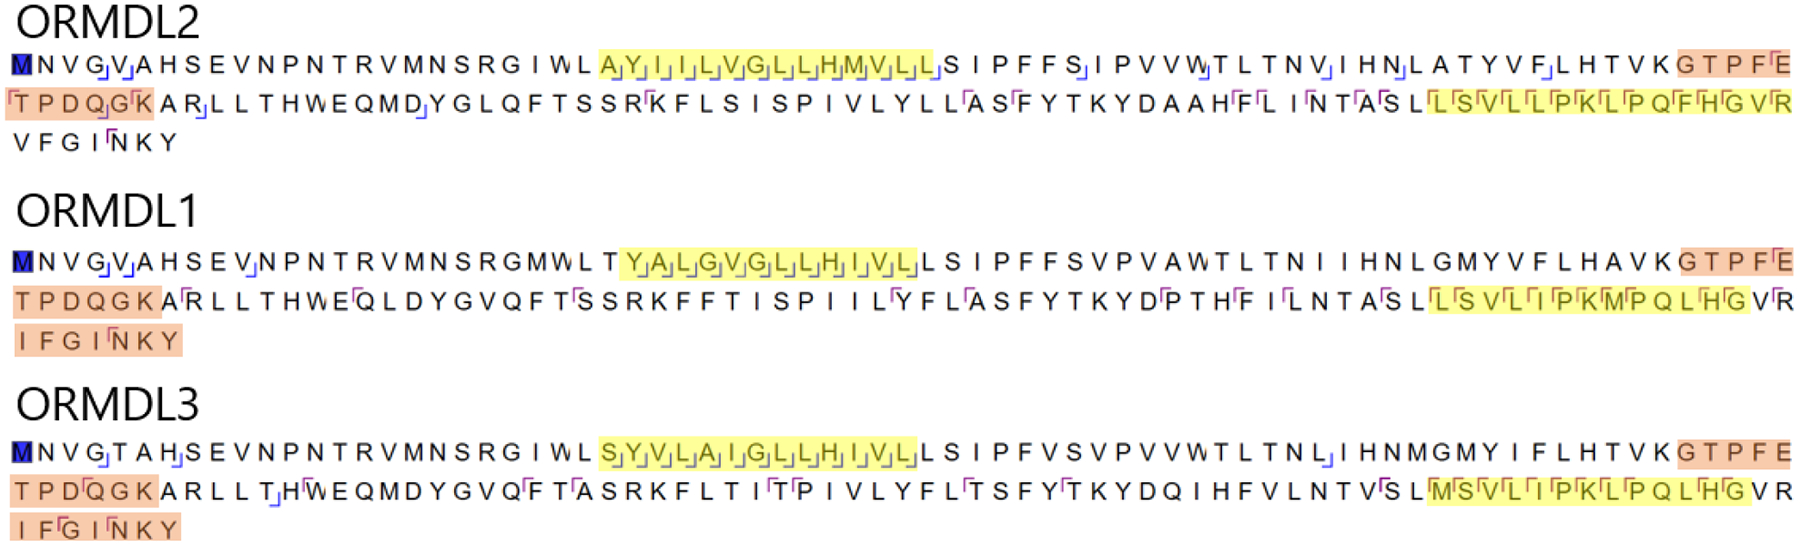
Cellular functions are performed by a vast and diverse set of proteoforms. Proteoforms are the specific forms of proteins produced as a result of genetic variations, RNA splicing, and post-translational modifications (PTMs). Top-down mass spectrometric analysis of intact proteins enables proteoform identification, including proteoforms derived from sequence cleavage events or harboring multiple PTMs. In contrast, bottom-up proteomics identifies peptides, which necessitates protein inference and does not yield proteoform identifications. We seek here to exploit the synergies between these two data types to improve the quality and depth of the overall proteomic analysis. To this end, we automated the large-scale integration of results from multiprotease bottom-up and top-down analyses in the software program Proteoform Suite and applied it to the analysis of proteoforms from the human Jurkat T lymphocyte cell line. We implemented the recently developed proteoform-level classification scheme for top-down tandem mass spectrometry (MS/MS) identifications in Proteoform Suite, which enables users to observe the level and type of ambiguity for each proteoform identification, including which of the ambiguous proteoform identifications are supported by bottom-up-level evidence. We used Proteoform Suite to find instances where top-down identifications aid in protein inference from bottom-up analysis and conversely where bottom-up peptide identifications aid in proteoform PTM localization. We also show the use of bottom-up data to infer proteoform candidates potentially present in the sample, allowing confirmation of such proteoform candidates by intact-mass analysis of MS1 spectra. The implementation of these capabilities in the freely available software program Proteoform Suite enables users to integrate large-scale top-down and bottom-up data sets and to utilize the synergies between them to improve and extend the proteomic analysis.

Keywords: bottom-up proteomics; post-translational modification; protein inference; proteoforms; software; top-down proteomics.


Conflict of interest statement

The authors declare no competing financial interests.

Figures

Figure 1.
Figure 1.
Overview of the strategy employed for integration of bottom-up and top-down data. Raw files were searched with MetaMorpheus, and results were integrated in Proteoform Suite.
Figure 2.
Figure 2.
In Proteoform Suite, bottom-up peptides are associated with proteoforms from which they could be derived based on the sequence and PTMs present. For example, unmodified peptides are only associated with proteoforms not modified at that sequence, and modified peptides are only associated with proteoforms with the same modification.
Figure 3.
Figure 3.
Bottom-up peptide identifications were used to make a list of potential proteoforms with bottom-up evidence. We compared this list against previously acquired intact-mass proteoform data to confirm the existence of some proteoforms.
Figure 4.
Figure 4.
Proteoform Suite graphical user interface. When a proteoform identification is selected, all bottom-up peptides derived from the proteoform are displayed. Annotated sequences are also displayed when a proteoform or peptide is selected.
Figure 5.
Figure 5.
Visualization of relationships between modified bottom-up peptide and proteoform identifications. Each orange node is a unique peptide identification and each purple node is a proteoform identification. Edges are drawn between each peptide and the proteoforms from which it could be derived based on sequence and modifications. The notation used to specify peptide identities is as follows: “2 to 13 Acetyl@2”, refers to a peptide starting at the 2nd residue of the protein and ending after the 13th residue (12 amino acids in length); and with an acetyl group present on that 2nd residue (in this case an N-terminal acetylation of the peptide).
Figure 6.
Figure 6.
Integration of top-down and bottom-up data to aid in PTM localization. The bottom-up identified peptide sequence is highlighted in the proteoform sequence in orange. A. The acetylation in a proteoform from the DBI gene was not localized between two UniProt annotated positions (S2 and K8). Bottom-up identified a peptide from the N-terminus with the acetylation localized (S2). B. An ambiguous proteoform identification from HIST2H3A localized a dimethyl PTM group (K28) but a methylation was not localized (K37 or K38); bottom-up analysis identified a peptide with both PTMs co-localized (dimethyl at K28 and methyl at K37).
Figure 7.
Figure 7.
Examples where top-down differentiated between ambiguous proteins in a protein group identified by bottom-up analysis. The yellow highlighted regions show the region of the protein sequence that differ. The orange highlighted region shows the region of the sequence where a bottom-up peptide was identified.
Figure 8.
Figure 8.
Annotated sequence coverage for three identified top-down proteoforms. Yellow highlighted regions represent main regions of the three different proteins that differ. Orange highlighted regions show the regions of the sequence where a bottom-up peptide was identified. In the bottom-up protein parsimony analysis, ORMDL2 was parsed out and a protein group with ORMDL1 and ORMDL3 was reported. However, top-down identified a proteoform for each of these three proteins.

Similar articles

Cited by

References

    1. Smith LM; Kelleher NL; Consortium for Top Down Proteomics, Proteoform: a single term describing protein complexity. Nat Methods 2013, 10, (3), 186–7. - PMC - PubMed
    1. Santos-Rosa H; Kirmizis A; Nelson C; Bartke T; Saksouk N; Cote J; Kouzarides T, Histone H3 tail clipping regulates gene expression. Nat Struct Mol Biol 2009, 16, (1), 17–22. - PMC - PubMed
    1. Yang X; Coulombe-Huntington J; Kang S; Sheynkman GM; Hao T; Richardson A; Sun S; Yang F; Shen YA; Murray RR; Spirohn K; Begg BE; Duran-Frigola M; MacWilliams A; Pevzner SJ; Zhong Q; Trigg SA; Tam S; Ghamsari L; Sahni N; Yi S; Rodriguez MD; Balcha D; Tan G; Costanzo M; Andrews B; Boone C; Zhou XJ; Salehi-Ashtiani K; Charloteaux B; Chen AA; Calderwood MA; Aloy P; Roth FP; Hill DE; Iakoucheva LM; Xia Y; Vidal M, Widespread Expansion of Protein Interaction Capabilities by Alternative Splicing. Cell 2016, 164, (4), 805–17. - PMC - PubMed
    1. Han X; Aslanian A; Yates JR 3rd, Mass spectrometry for proteomics. Curr Opin Chem Biol 2008, 12, (5), 483–90. - PMC - PubMed
    1. Kong AT; Leprevost FV; Avtonomov DM; Mellacheruvu D; Nesvizhskii AI, MSFragger: ultrafast and comprehensive peptide identification in mass spectrometry-based proteomics. Nat Methods 2017, 14, (5), 513–520. - PMC - PubMed

Publication types