. 2020 Aug 1;129(2):247-256.
doi: 10.1152/japplphysiol.00275.2020. Epub 2020 Jun 25.

Carotid body chemosensitivity at 1.6 ATA breathing air versus 100% oxygen

Affiliations

Carotid body chemosensitivity at 1.6 ATA breathing air versus 100% oxygen

Hayden W Hess et al. J Appl Physiol (1985). .

Abstract

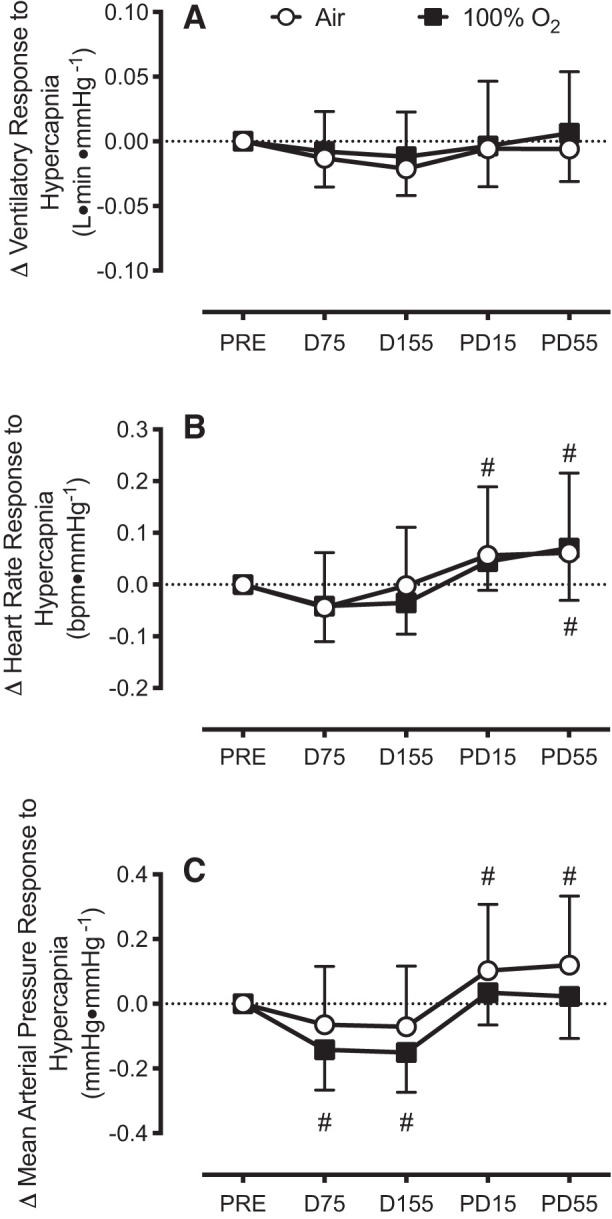
Hyperoxia reduces the ventilatory response to hypercapnia by suppressing carotid body (CB) activation. This effect may contribute to CO2 retention during underwater diving due to the high arterial O2 content associated with hyperbaria. We tested the hypothesis that CB chemosensitivity to hypercapnia and hypoxia is attenuated during hyperbaria. Ten subjects completed two, 4-h dry dives at 1.6 atmosphere absolute (ATA) breathing either 21% O2 (Air) or 100% O2 (100% O2). CB chemosensitivity was assessed using brief hypercapnic ventilatory response ([Formula: see text]) and hypoxic ventilatory response ([Formula: see text]) tests predive, 75 and 155 min into the dives, and 15 and 55 min postdive. End-tidal CO2 pressure increased during the dive at 75 and 155 min [Air: +9 (SD 4) mmHg and +8 (SD 4) mmHg versus 100% O2: +6 (SD 4) mmHg and +5 (SD 3) mmHg; all P < 0.01] and was higher while breathing Air (P < 0.01). [Formula: see text] was unchanged during the dive (P = 0.73) and was not different between conditions (P = 0.47). However, [Formula: see text] was attenuated from predive during the dive at 155 min breathing Air [-0.035 (SD 0.037) L·min·mmHg-1; P = 0.02] and at both time points while breathing 100% O2 [-0.035 (SD 0.052) L·min·mmHg-1 and -0.034 (SD 0.064) L·min·mmHg-1; P = 0.02 and P = 0.02, respectively]. These data indicate that the CB chemoreceptors do not appear to contribute to CO2 retention in hyperbaria.NEW & NOTEWORTHY We demonstrate that carotid body chemosensitivity to brief exposures of hypercapnia was unchanged during a 4-h dive in a dry hyperbaric chamber at 1.6 ATA regardless of breathing gas condition [i.e., air (21% O2) versus 100% oxygen]. Therefore, it appears that an attenuation of carotid body chemosensitivity to hypercapnia does not contribute to CO2 retention in hyperbaria.

Keywords: CO2 retention; carotid body chemosensitivity; hyperbaria; hyperoxia.


Conflict of interest statement

B. M. Clemency is a speaker and consultant for Stryker Corporation. No conflicts of interest, financial or otherwise, are declared by the other authors.

Figures

Fig. 1.
Fig. 1.
Schematic of the closed-circuit rebreather (CCR) system. Subjects were transitioned from the surface-supplied regulator to the CCR system for measurements and testing. Subjects breathed from a mouthpiece (green) within the CCR system. Expired gases were either exhausted into the hyperbaric chamber or recirculated (guillotine switching valve) during baseline measurements and carotid body chemosensitivity testing. Expired gases passed through a CO2 scrubber that preceded the bellows system. The bellows system consisted of a spring-loaded tensiometer that measured tidal volume within the CCR system. During carotid body chemosensitivity testing, subjects were switched to inspiring from a spirometer (switching valve) that was filled with either 13% CO2, 21% O2, 66% N2 (for carotid body chemosensitivity to hypercapnia) or 100% N2 (for carotid body chemosensitivity to hypoxia).
Fig. 2.
Fig. 2.
Schematic of the dry-dive profile during experimental visits and timepoints for CB chemosensitivity assessments (minutes). CB chemosensitivity to hypercapnia and hypoxia were measured at five timepoints during each visit: predive (PRE), 75 and 155 min during the dive (D75 and D155, respectively), and 15 and 55 min postdive (PD15 and PD55, respectively).
Fig. 3.
Fig. 3.
Representative waveforms of a single-breath 13% CO2 stimulus (CBCO2; A) and a five-breath 100% N2 stimulus (CBO2; B). Ventilatory and hemodynamic variables are shown 15 s pre- and 60 s poststimulus. Peak PETCO2 was calculated from the peak fraction of expired CO2 poststimulus and ambient chamber pressure. Nadir PETO2 was calculated from the nadir fraction of expired O2 poststimulus and ambient chamber pressure. Peak V̇e was calculated as a function of the three largest consecutive breaths and time (shaded area). Peak arterial blood pressure and heart rate were captured beat-to-beat and recorded. HR, heart rate; BP, arterial blood pressure; FECO2, fraction of expired CO2; FEO2, fraction of expired O2; PETO2, end-tidal O2 pressure; PETCO2, end-tidal CO2 pressure; SpO2, arterial oxygen saturation.
Fig. 4.
Fig. 4.
AH: values are presented as an absolute change from predive as means (SD). Baseline ventilatory and hemodynamic data measured predive (PRE), 75 and 155 min into the dive (D75 and D155, respectively), and 15 and 55 min postdive (PD15 and PD55, respectively). Two-way, repeated-measures ANOVAs (time × breathing gas). Air (open circles), n = 10; 100% O2 (closed squares), n = 10. #P < 0.05 from predive; *P < 0.05, Air versus 100% O2.
Fig. 5.
Fig. 5.
AC: values are presented as an absolute change from predive as means (SD). Carotid body chemosensitivity to hypercapnia measured predive (PRE), 75 and 155 min into the dive (D75 and D155, respectively), and 15 and 55 min postdive (PD15 and PD55, respectively). Two-way, repeated-measures analysis of variance (time × breathing gas). Air (open circles), n = 10; 100% O2 (closed squares), n = 10. #P < 0.05 from predive.
Fig. 6.
Fig. 6.
AC: values are presented as an absolute change from predive as means (SD). Carotid body chemosensitivity to hypoxia measured predive (PRE), 75 and 155 min into the dive (D75 and D155, respectively), and 15 and 55 min postdive (PD15 and PD55, respectively). Two-way, repeated-measures analysis of variance (time × breathing gas). Air (open circles), n = 9; 100% O2 (closed squares), n = 9. #P < 0.05 from predive.

References

    1. Arieli R, Arieli Y, Daskalovic Y, Eynan M, Abramovich A. CNS oxygen toxicity in closed-circuit diving: signs and symptoms before loss of consciousness. Aviat Space Environ Med 77: 1153–1157, 2006. - PubMed
    1. Arieli R, Ertracht O. Latency to CNS oxygen toxicity in rats as a function of Pco2 and Po2. Eur J Appl Physiol Occup Physiol 80: 598–603, 1999. doi:10.1007/s004210050640. - DOI - PubMed
    1. Arieli R, Kerem D, Melamed Y. Hyperoxic exposure affects the ventilatory response to hypoxia in awake rats. J Appl Physiol (1985) 64: 181–186, 1988. doi:10.1152/jappl.1988.64.1.181. - DOI - PubMed
    1. Arieli R, Shochat T, Adir Y. CNS toxicity in closed-circuit oxygen diving: symptoms reported from 2527 dives. Aviat Space Environ Med 77: 526–532, 2006. - PubMed
    1. Becker HF, Polo O, McNamara SG, Berthon-Jones M, Sullivan CE. Effect of different levels of hyperoxia on breathing in healthy subjects. J Appl Physiol (1985) 81: 1683–1690, 1996. doi:10.1152/jappl.1996.81.4.1683. - DOI - PubMed

Publication types