. 2020 Jun 25;18(6):e3000633.
doi: 10.1371/journal.pbio.3000633. eCollection 2020 Jun.

Mapping trends in insecticide resistance phenotypes in African malaria vectors

Affiliations

Mapping trends in insecticide resistance phenotypes in African malaria vectors

Penelope A Hancock et al. PLoS Biol. .

Abstract

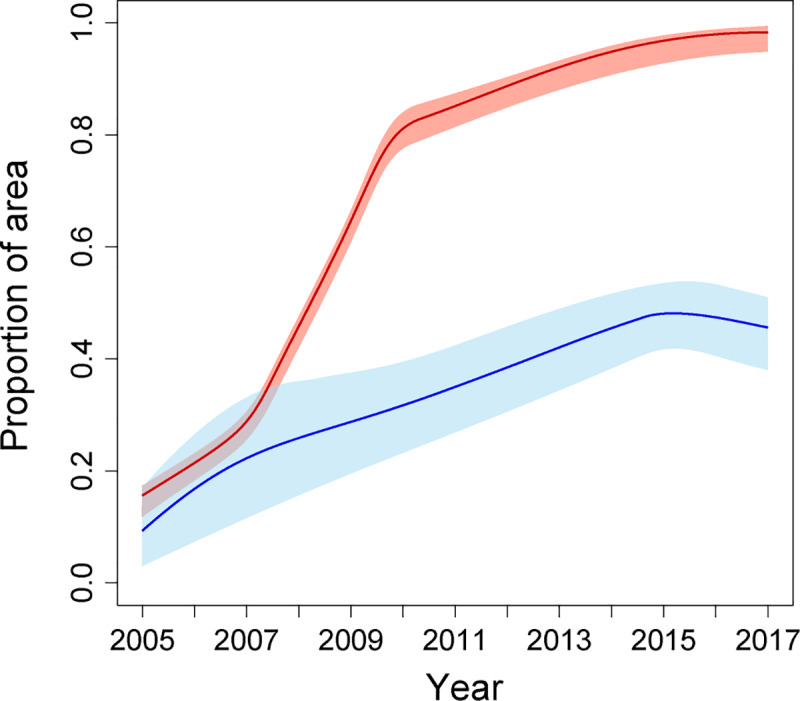
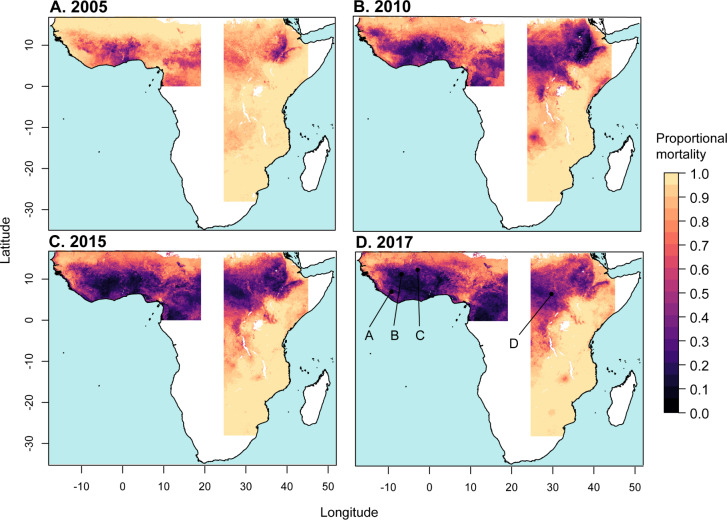
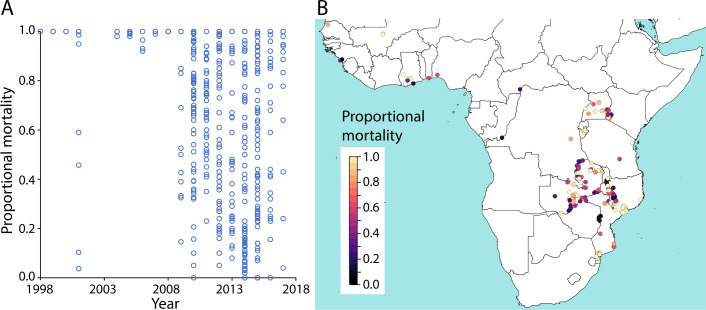
Mitigating the threat of insecticide resistance in African malaria vector populations requires comprehensive information about where resistance occurs, to what degree, and how this has changed over time. Estimating these trends is complicated by the sparse, heterogeneous distribution of observations of resistance phenotypes in field populations. We use 6,423 observations of the prevalence of resistance to the most important vector control insecticides to inform a Bayesian geostatistical ensemble modelling approach, generating fine-scale predictive maps of resistance phenotypes in mosquitoes from the Anopheles gambiae complex across Africa. Our models are informed by a suite of 111 predictor variables describing potential drivers of selection for resistance. Our maps show alarming increases in the prevalence of resistance to pyrethroids and DDT across sub-Saharan Africa from 2005 to 2017, with mean mortality following insecticide exposure declining from almost 100% to less than 30% in some areas, as well as substantial spatial variation in resistance trends.


Conflict of interest statement

The authors have declared that no competing interests exist.

Figures

Fig 1
Fig 1. The sampling distribution of the pyrethroid and DDT susceptibility test observations for mosquitoes from the A. gambiae species complex across space and time.
(A) The number of susceptibility test observations for each year and insecticide type. Numerical values are provided in S1 Data (10.6084/m9.figshare.9912623). (B) The sampling locations of the susceptibility test observations in panel A.
Fig 2
Fig 2. Predicted mean proportional mortality to deltamethrin across the west and east regions.
(A) 2005, (B) 2010, (C) 2015, and (D) 2017. See 10.6084/m9.figshare.9912623.
Fig 3
Fig 3
The proportion of the area with a predicted mean mortality to deltamethrin of less than 0.9, for the west region (red line) and the east region (blue line). Red and blue shaded areas indicate the 95% CI of the predicted proportion of pixels for the west and east regions, respectively. Numerical values are provided in S2 Data (10.6084/m9.figshare.9912623). CI, credible interval.
Fig 4
Fig 4. Predicted mean proportional mortality to DDT across the west and east regions.
(A) 2005, (B) 2010, (C) 2015, and (D) 2017. See 10.6084/m9.figshare.9912623.
Fig 5
Fig 5
The proportion of the area with a predicted mean mortality to DDT of less than 0.9, for the west region (red line) and the east region (blue line). Red and blue shaded areas indicate the 95% CI of the predicted proportion of pixels for the west and east regions, respectively. Numerical values are provided in S2 Data (10.6084/m9.figshare.9912623). CI, credible interval.
Fig 6
Fig 6. The prediction error (95% CI) associated with predicted mean mortality to deltamethrin.
See 10.6084/m9.figshare.9912623. CI, credible interval.
Fig 7
Fig 7
The proportion of the area with a predicted mean mortality to deltamethrin of less than 0.9 within each country that is fully contained within the west region (red lines) and the east region (blue lines). Red and blue shaded areas indicate the 95% CI of the predicted proportion of pixels for the west and east regions, respectively. Numerical values are provided in S3 Data and S4 Data (10.6084/m9.figshare.9912623). CI, credible interval.
Fig 8
Fig 8. Weighted variable importance of predictor variables given by the three machine-learning models included in the model ensemble.
(A) West Africa; (B) East Africa. Stacked bars show the relative variable importance given by XGB (blue), RF (green), and BGAM (grey), weighted by the fitted weight for each model given by the Gaussian process meta-model (see text). Variables are ranked by the total height of the stacked bars across the 3 models, and the top 20 variables are shown. The original variable importance values produced by each model are given in S5 Table and S6 Table, and definitions of each predictor variable are given in S9 Table. Variable name suffixes (-1), (-2), and (-3) denote time lags of 1, 2, and 3 years, respectively. One, two, and three asterisks denote the first, second, and third principal component, respectively, for variables available on a monthly time step (see “Methods”). BGAM, boosted generalized additive model; IRS, indoor residual spraying; ITN, insecticide-treated net; PET, potential evapotranspiration; RF, random forest model; XGB, extreme gradient boosting model.
Fig 9
Fig 9. The sampling distribution of the pyrethroid susceptibility test observations for A. funestus mosquito species across space and time.
(A) The proportional mortality to pyrethroids in susceptibility tests performed on A. funestus in the years 1998–2017 (n = 692). Raw data are available in Moyes et al. 2019 [8]. (B) the locations of the samples in panel A and the recorded proportional mortality.

References

    1. Bhatt S, Weiss DJ, Cameron E, Bisanzio D, Mappin B, Dalrymple U, et al. The effect of malaria control on Plasmodium falciparum in Africa between 2000 and 2015. Nature. 2015;526(7572):207–2011. 10.1038/nature15535 - DOI - PMC - PubMed
    1. Corbel V, Chabi J, Dabire RK, Etang J, Nwane P, Pigeon O, et al. Field efficacy of a new mosaic long-lasting mosquito net (PermaNet (R) 3.0) against pyrethroid-resistant malaria vectors: a multi centre study in Western and Central Africa. Malar J. 2010;9 10.1186/1475-2875-9-113 - DOI - PMC - PubMed
    1. Protopopoff N, Mosha JF, Lukole E, Charlwood JD, Wright A, Mwalimu CD, et al. Effectiveness of a long-lasting piperonyl butoxide-treated insecticidal net and indoor residual spray interventions, separately and together, against malaria transmitted by pyrethroid-resistant mosquitoes: a cluster, randomised controlled, two-by-two factorial design trial. Lancet. 2018;391(10130):1577–88. 10.1016/S0140-6736(18)30427-6 - DOI - PMC - PubMed
    1. Tangena J-A, Hendricks CJM, Devine M, Tammaro M, Trett AE, de Pina A, et al. Indoor residual spraying for malaria control in Sub-Saharan Africa 1997 to 2017: an adjusted retrospective analysis. Malar J. 2020;19:150 10.1186/s12936-020-03216-6 - DOI - PMC - PubMed
    1. Sherrard-Smith E, Griffin JT, Winskill P, Corbel V, Pennetier C, Djenontin A, et al. Systematic review of indoor residual spray efficacy and effectiveness against Plasmodium falciparum in Africa. Nat Commun. 2018;9 10.1038/s41467-018-07357-w - DOI - PMC - PubMed

Publication types