. 2020 Sep 17;136(12):1419-1432.
doi: 10.1182/blood.2020005289.

Genomic and epigenomic insights into the origin, pathogenesis, and clinical behavior of mantle cell lymphoma subtypes

Affiliations

Genomic and epigenomic insights into the origin, pathogenesis, and clinical behavior of mantle cell lymphoma subtypes

Ferran Nadeu et al. Blood. .

Abstract

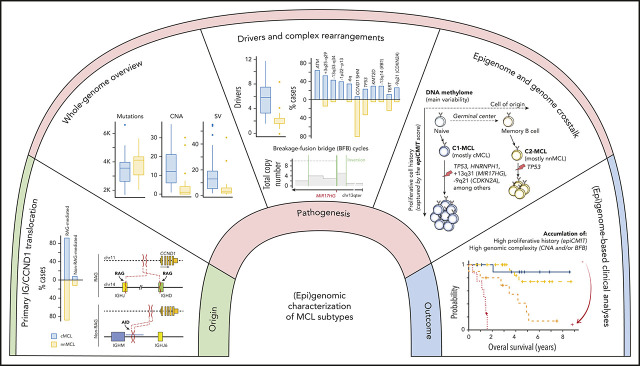
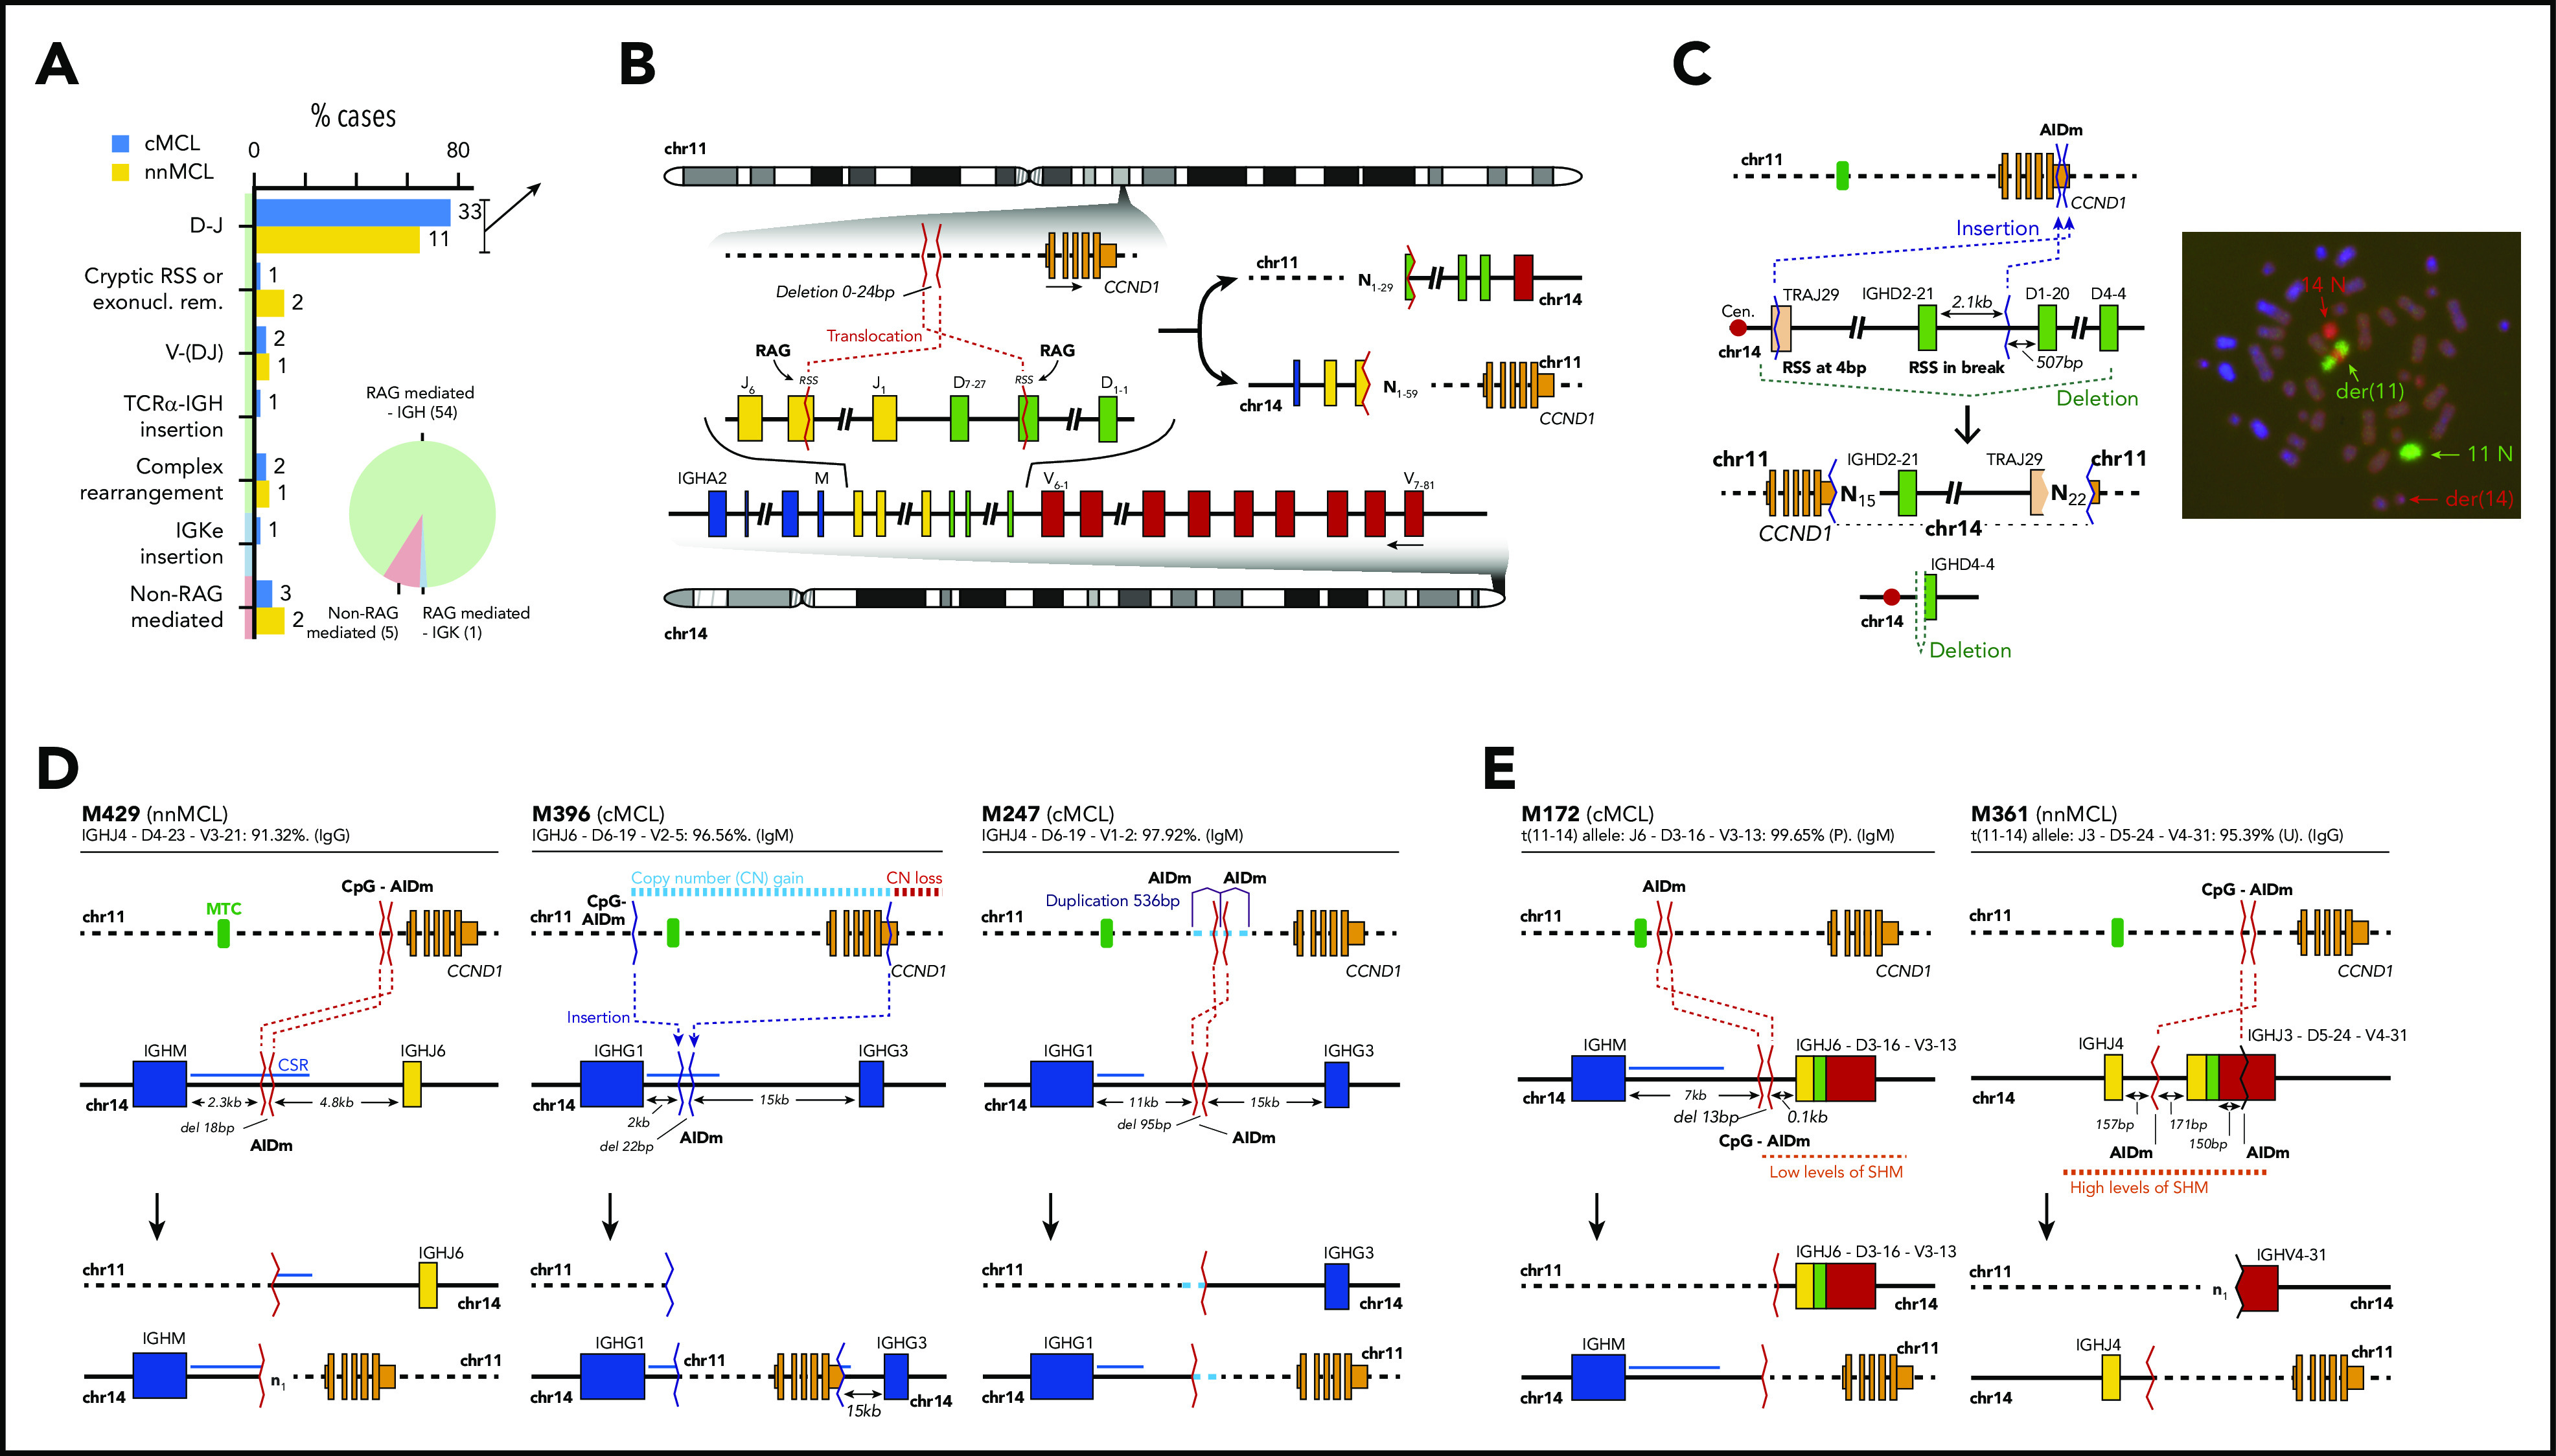
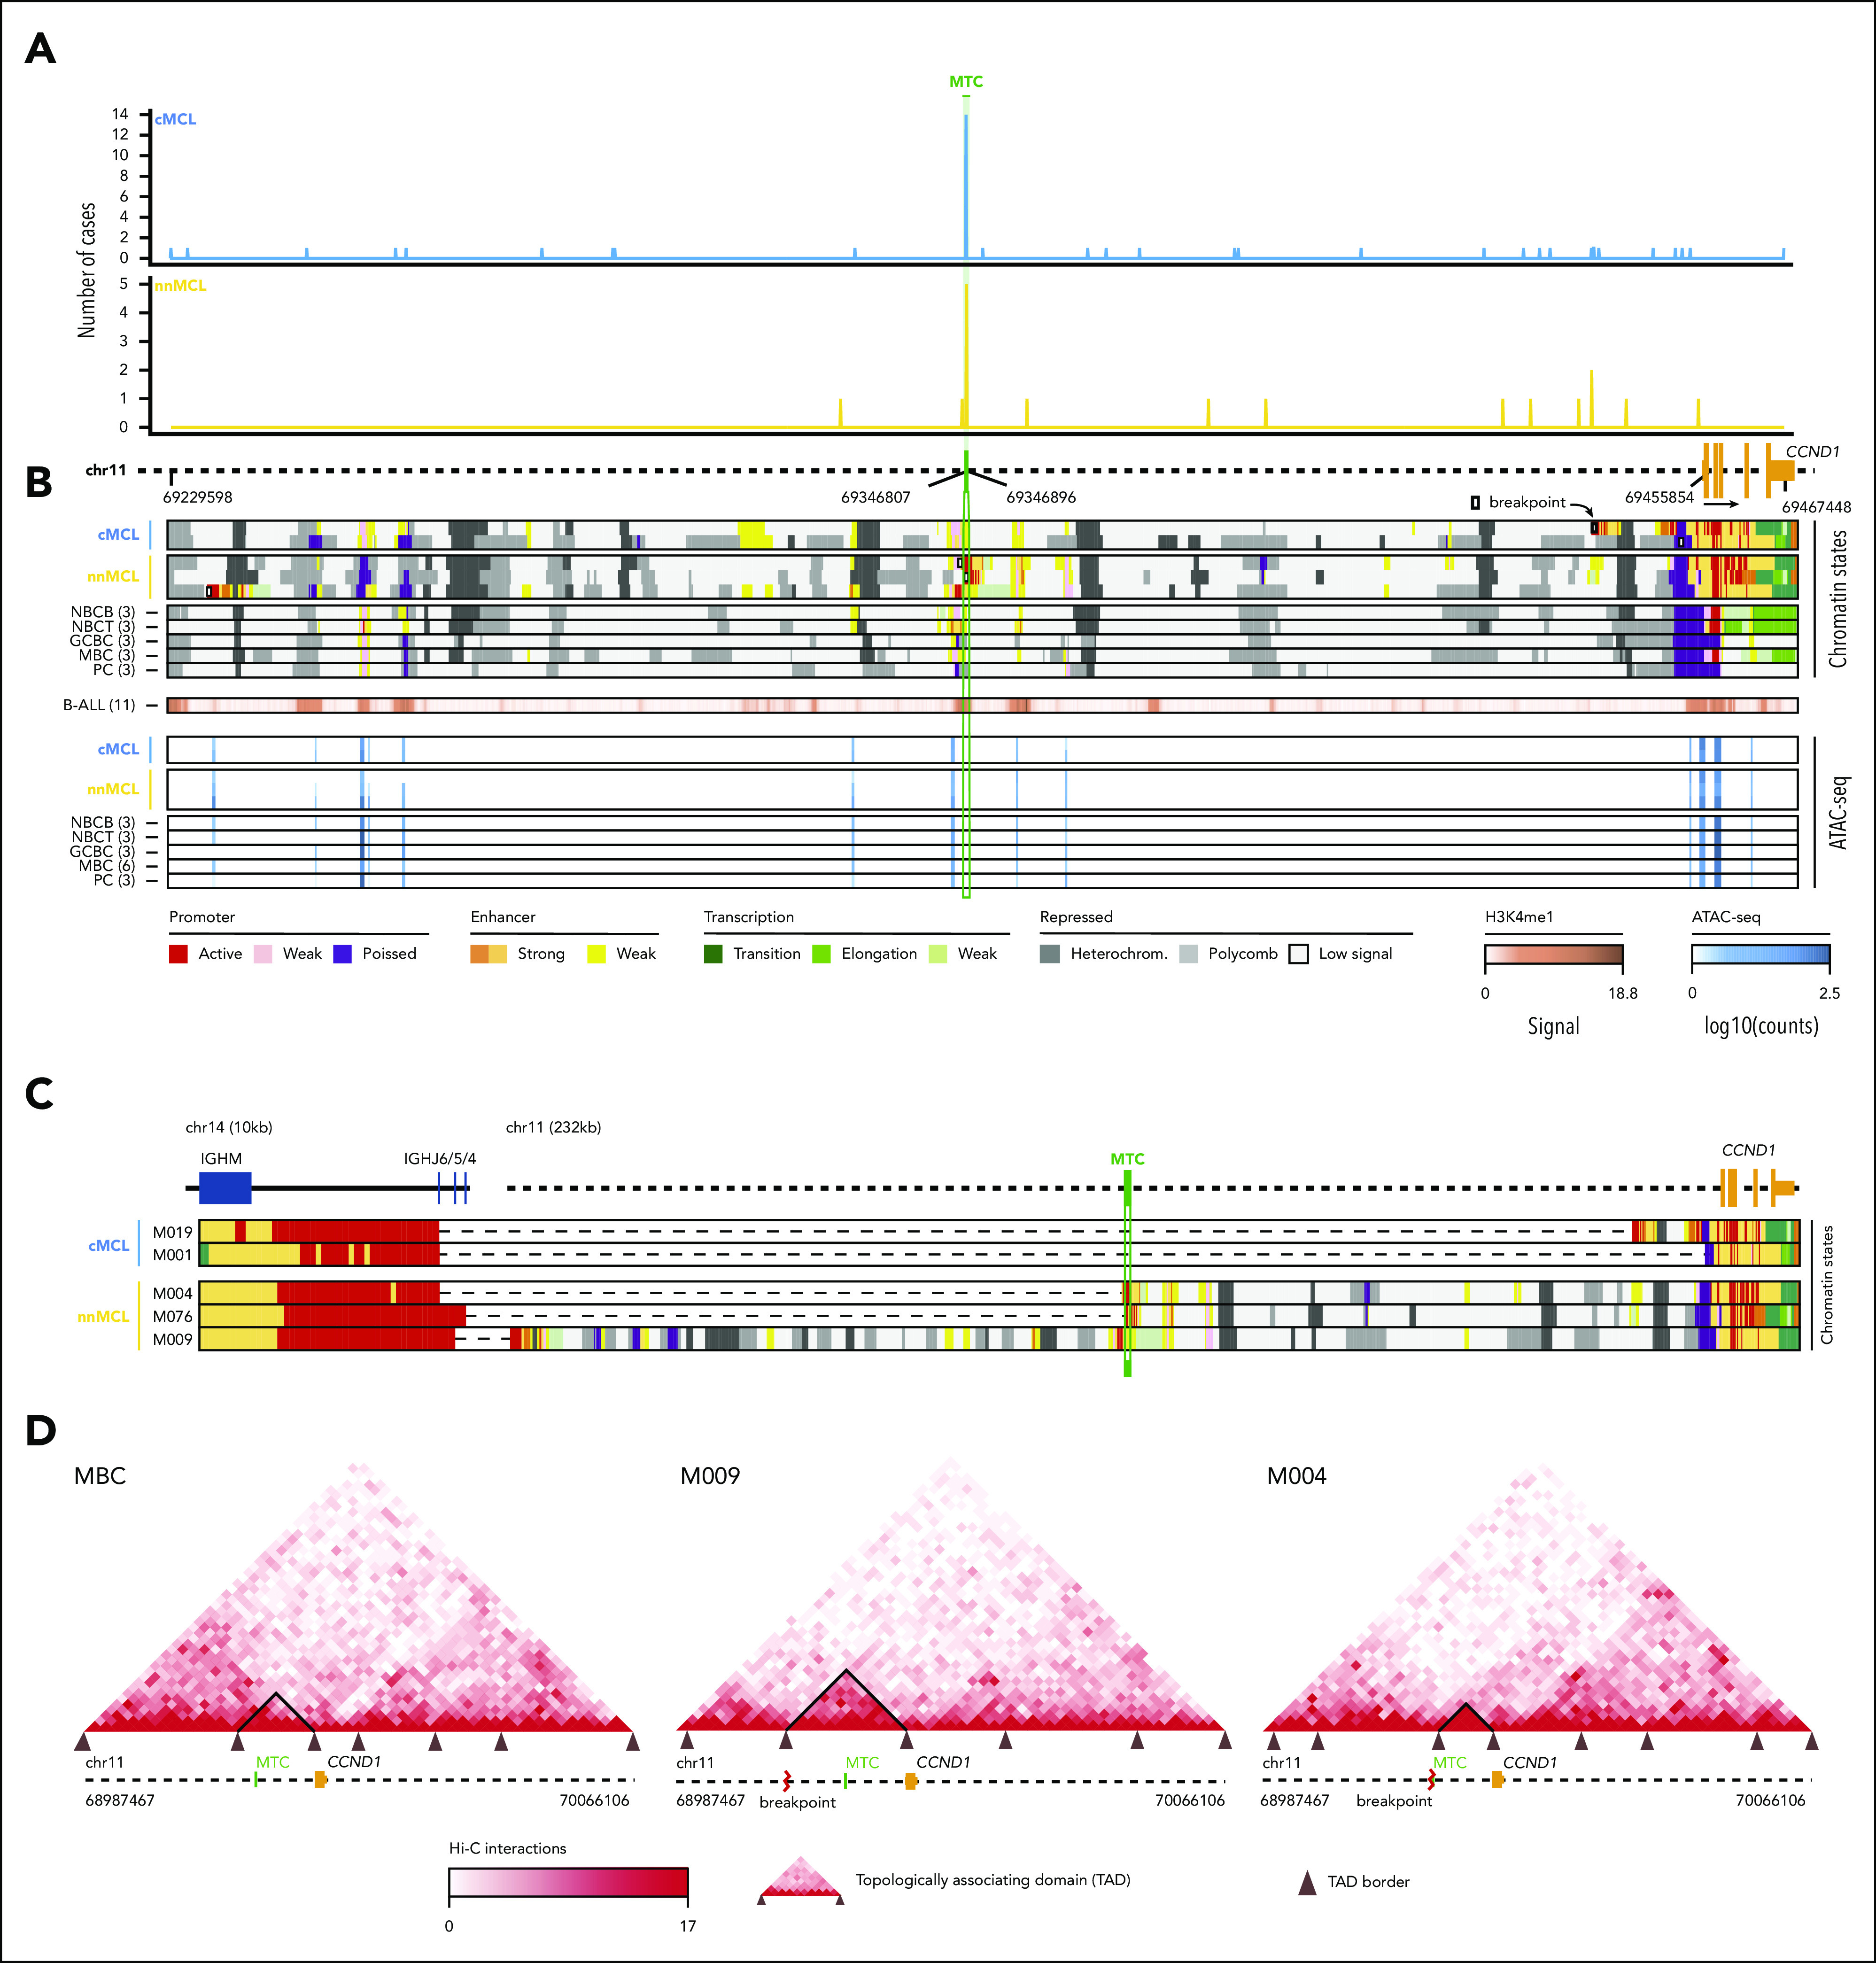
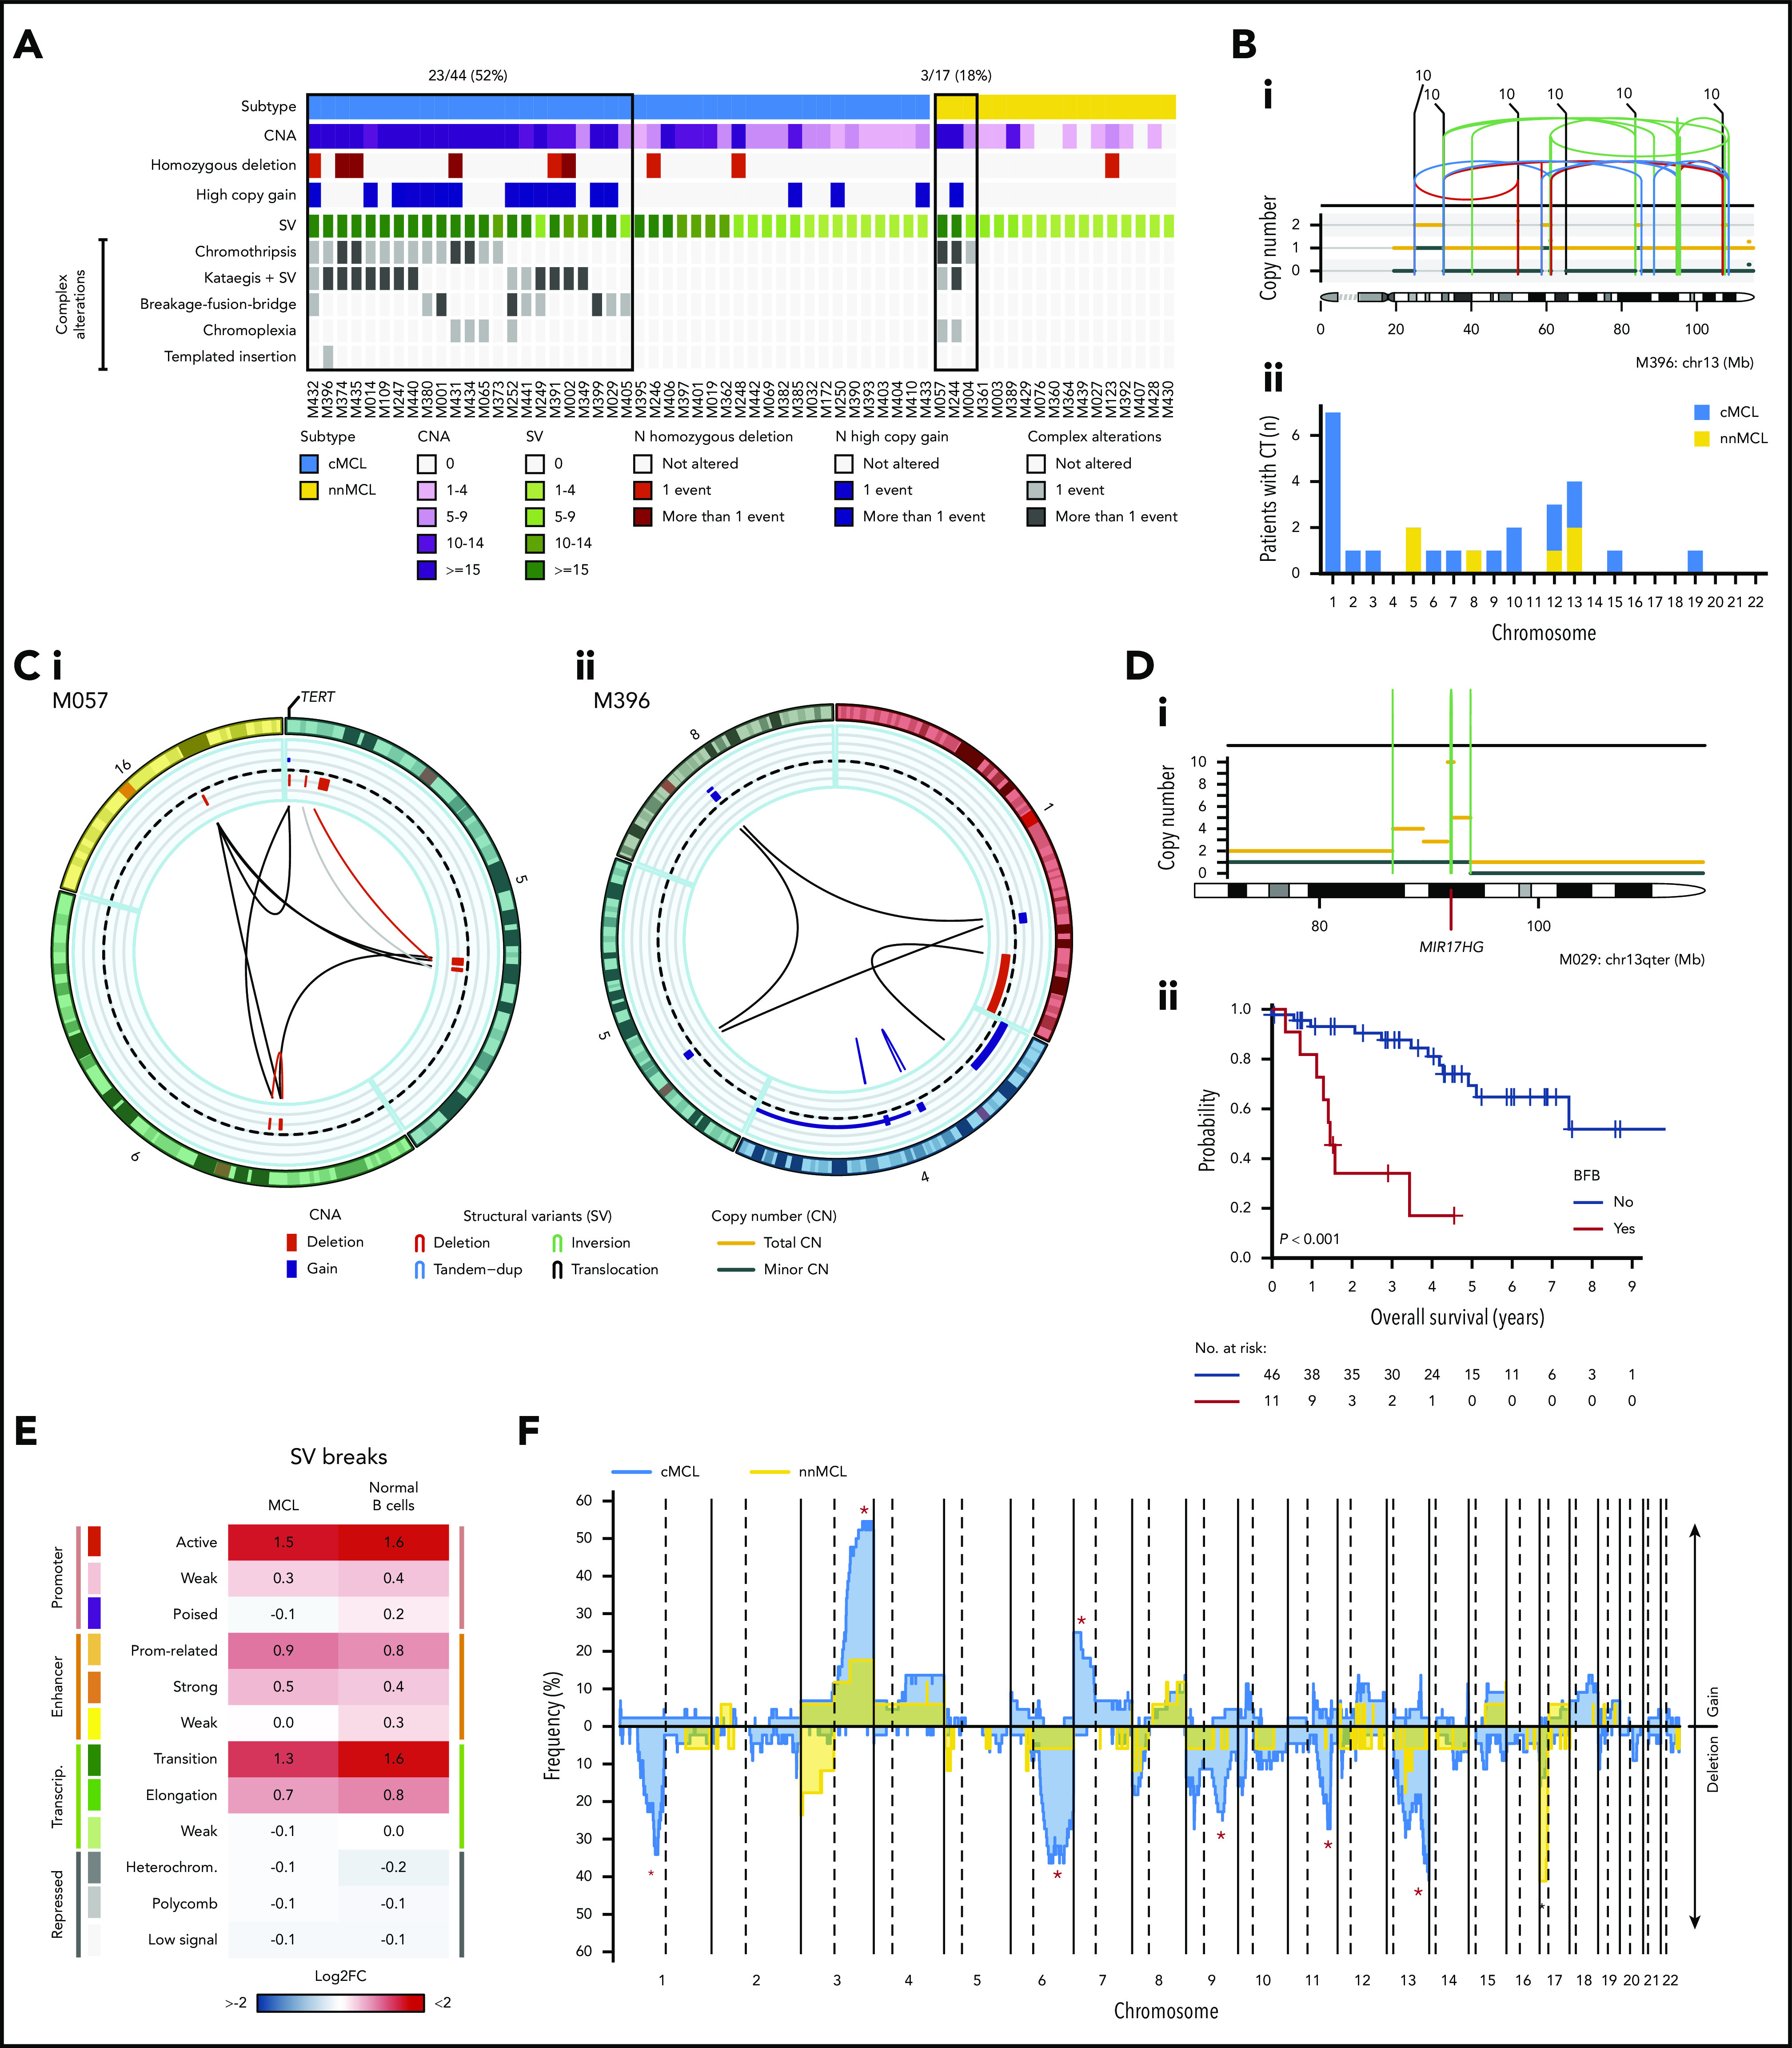
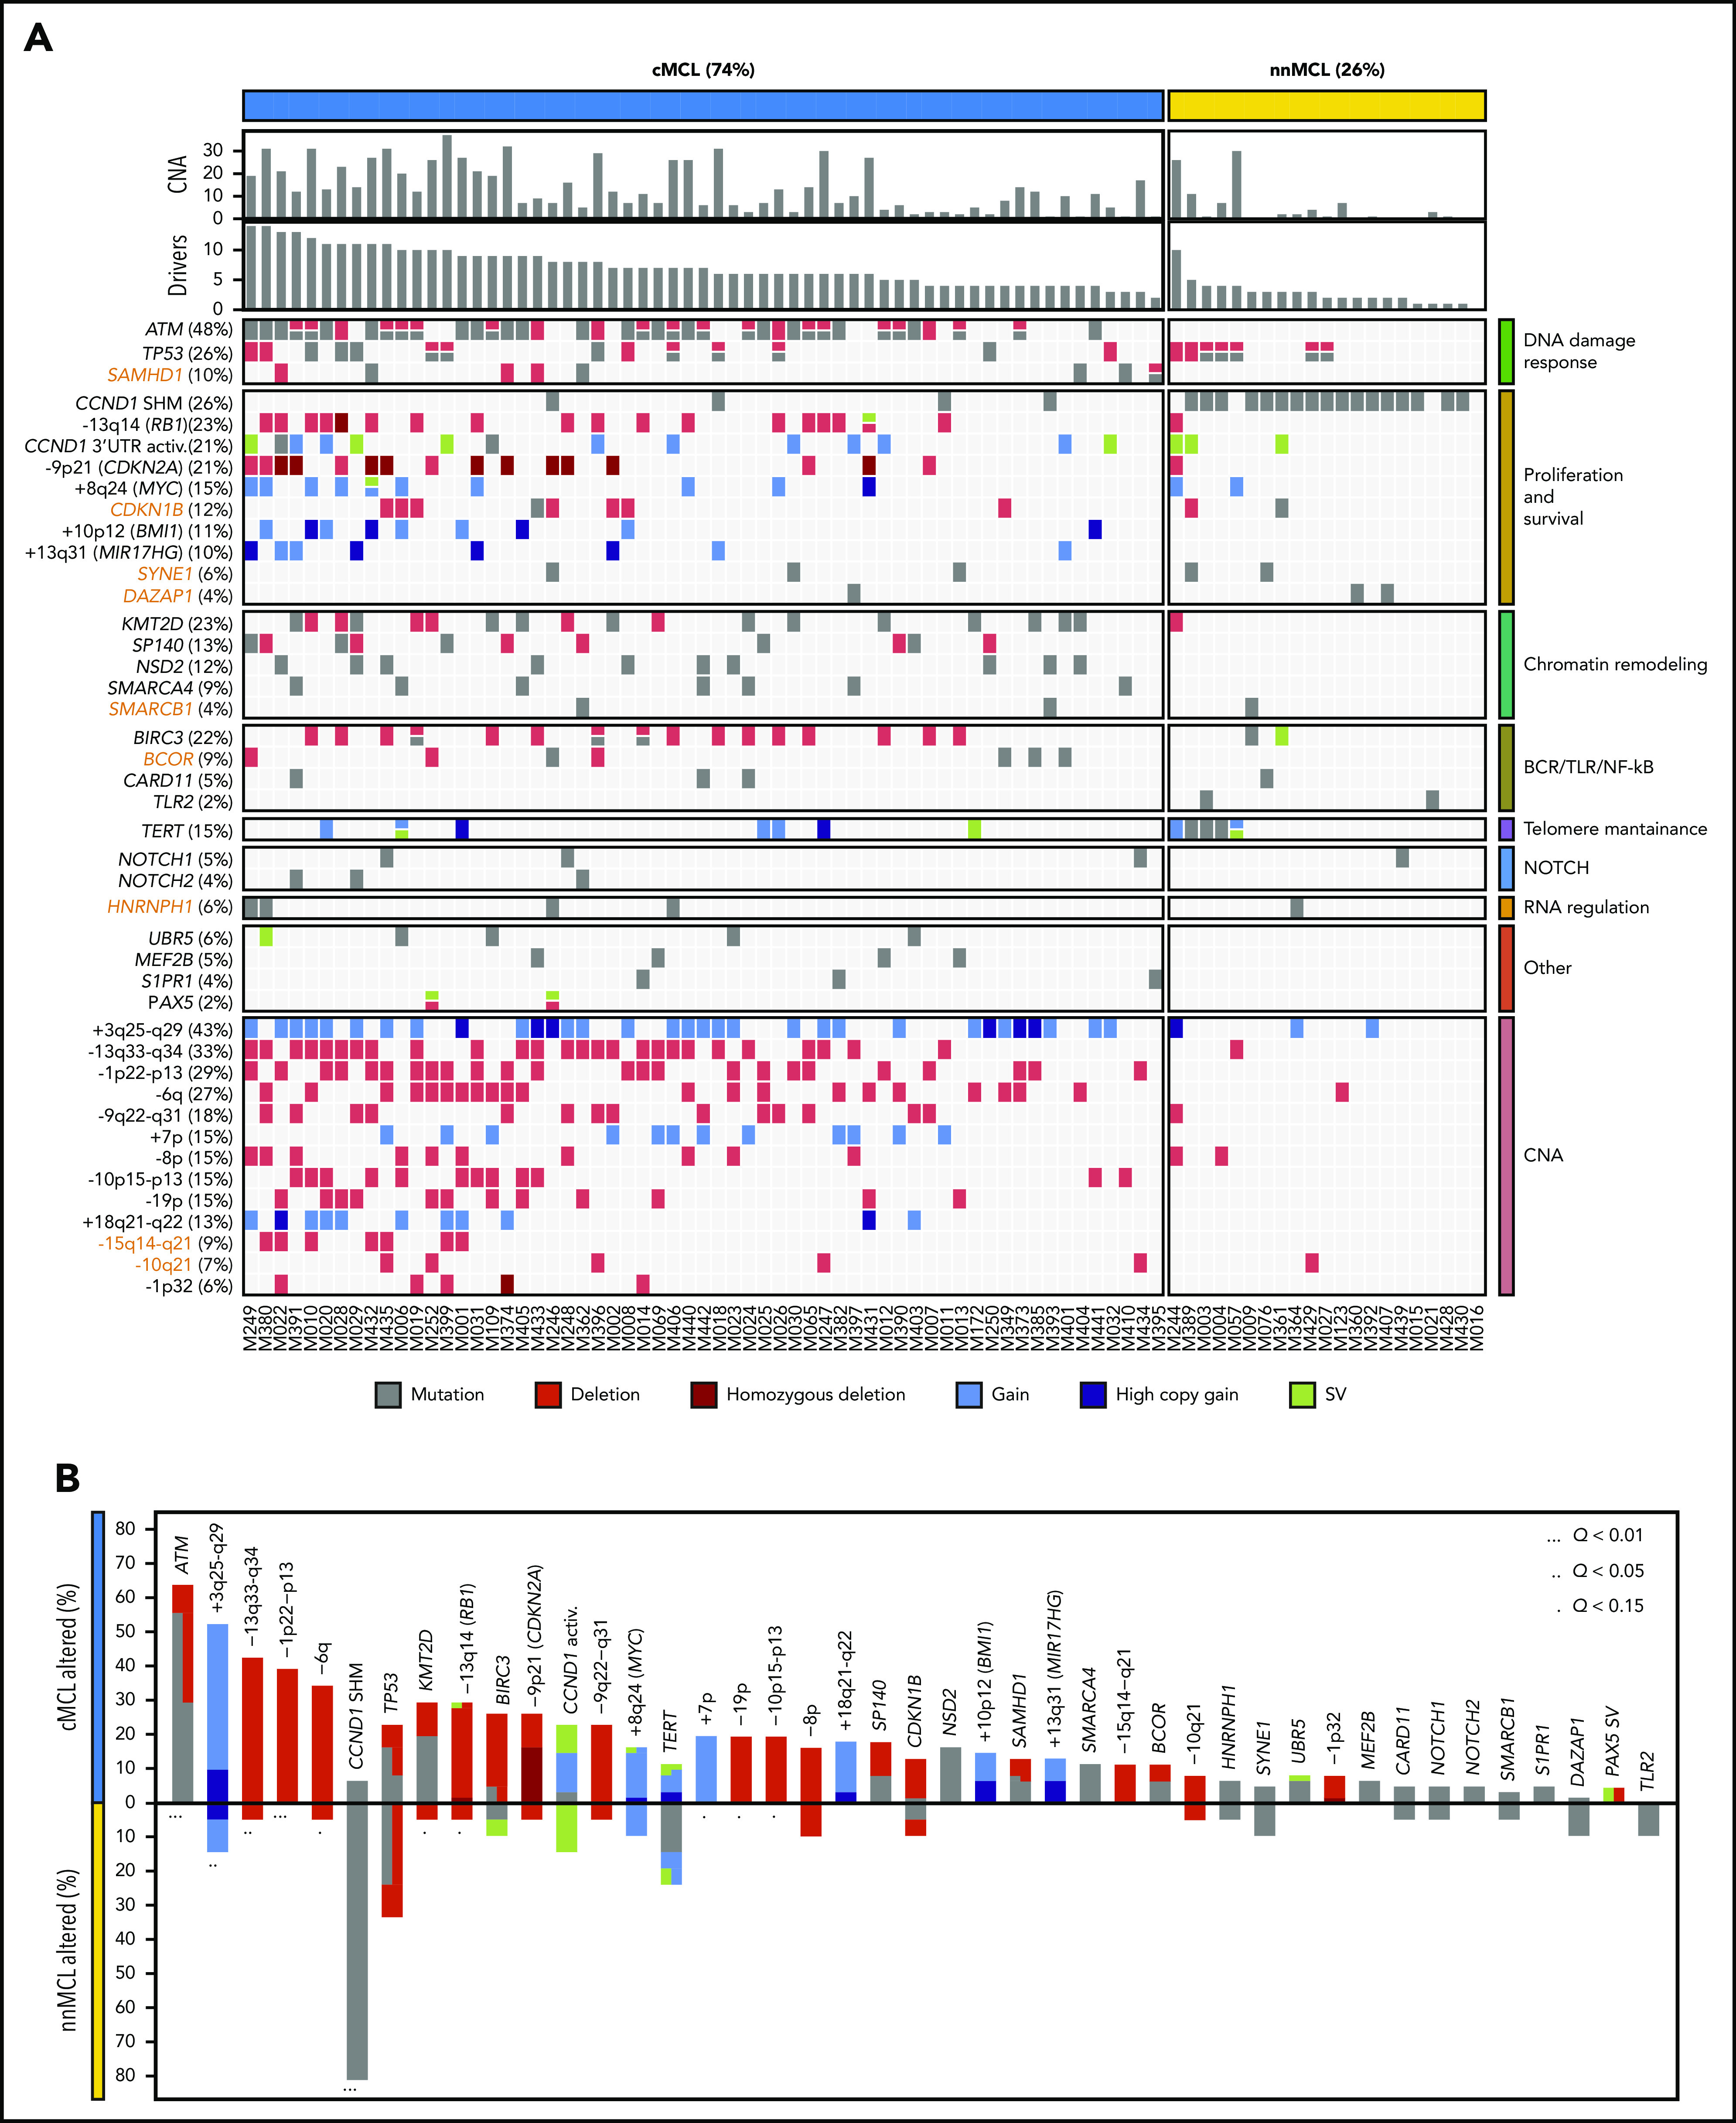
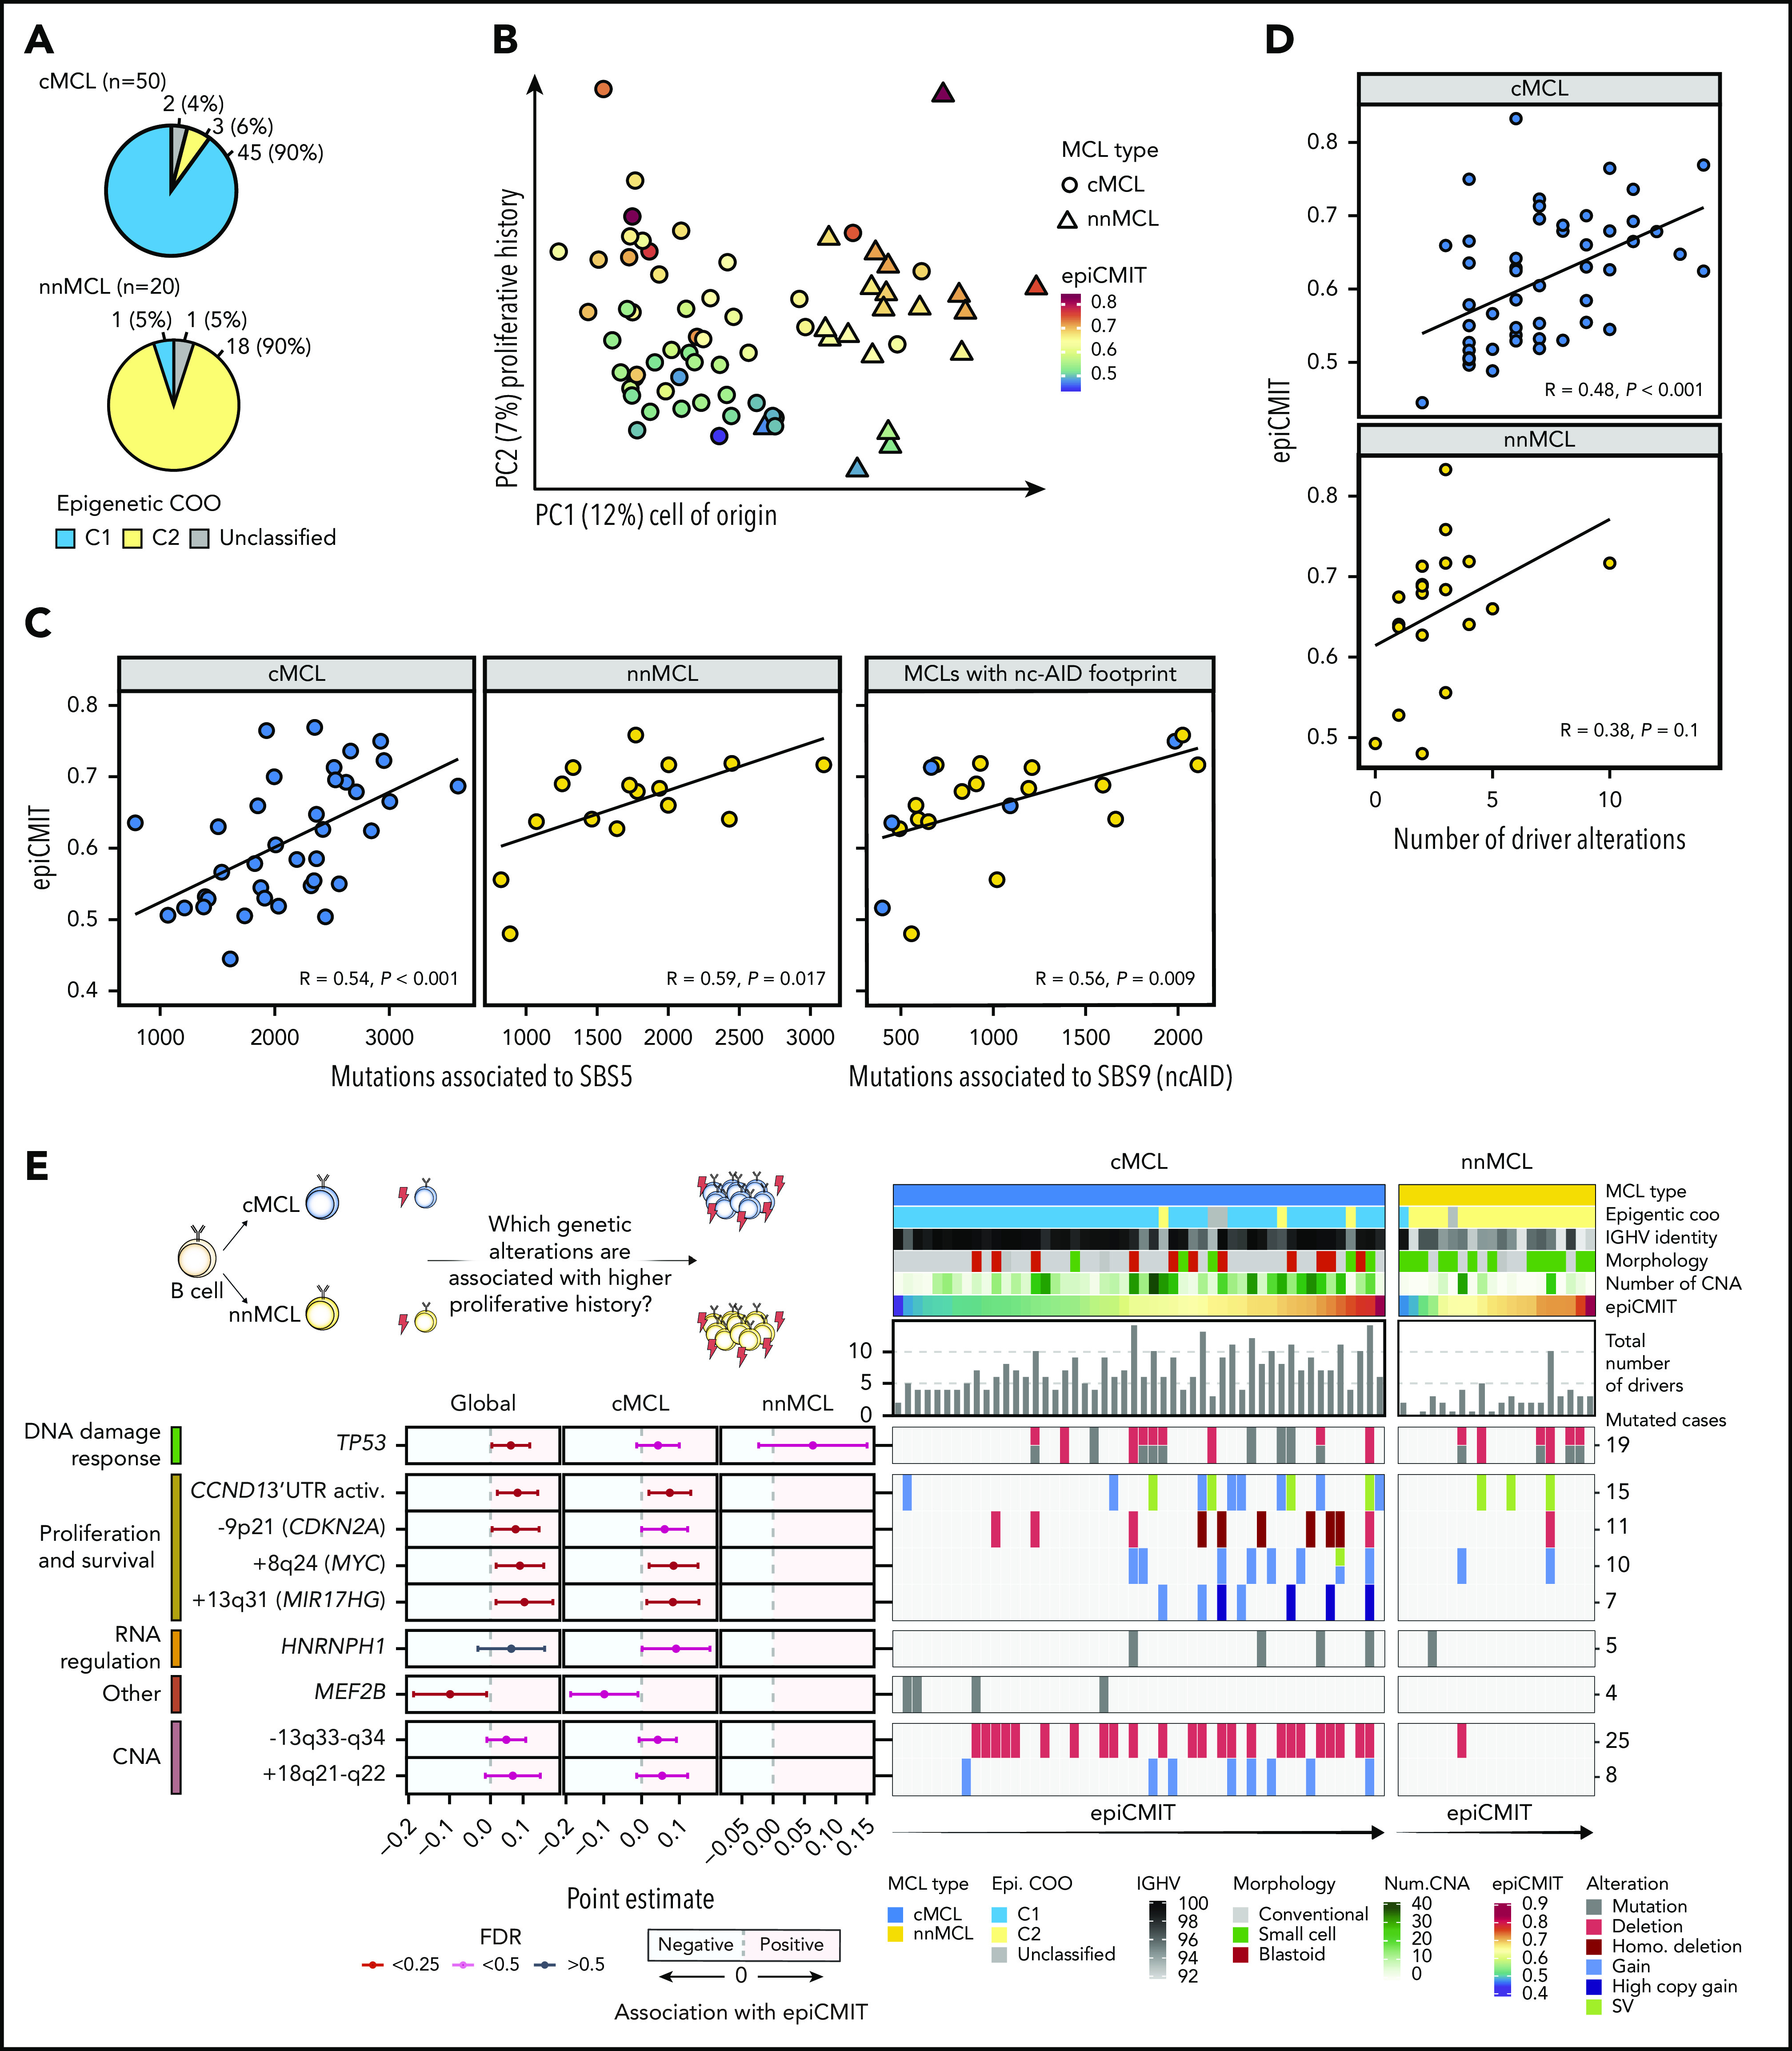
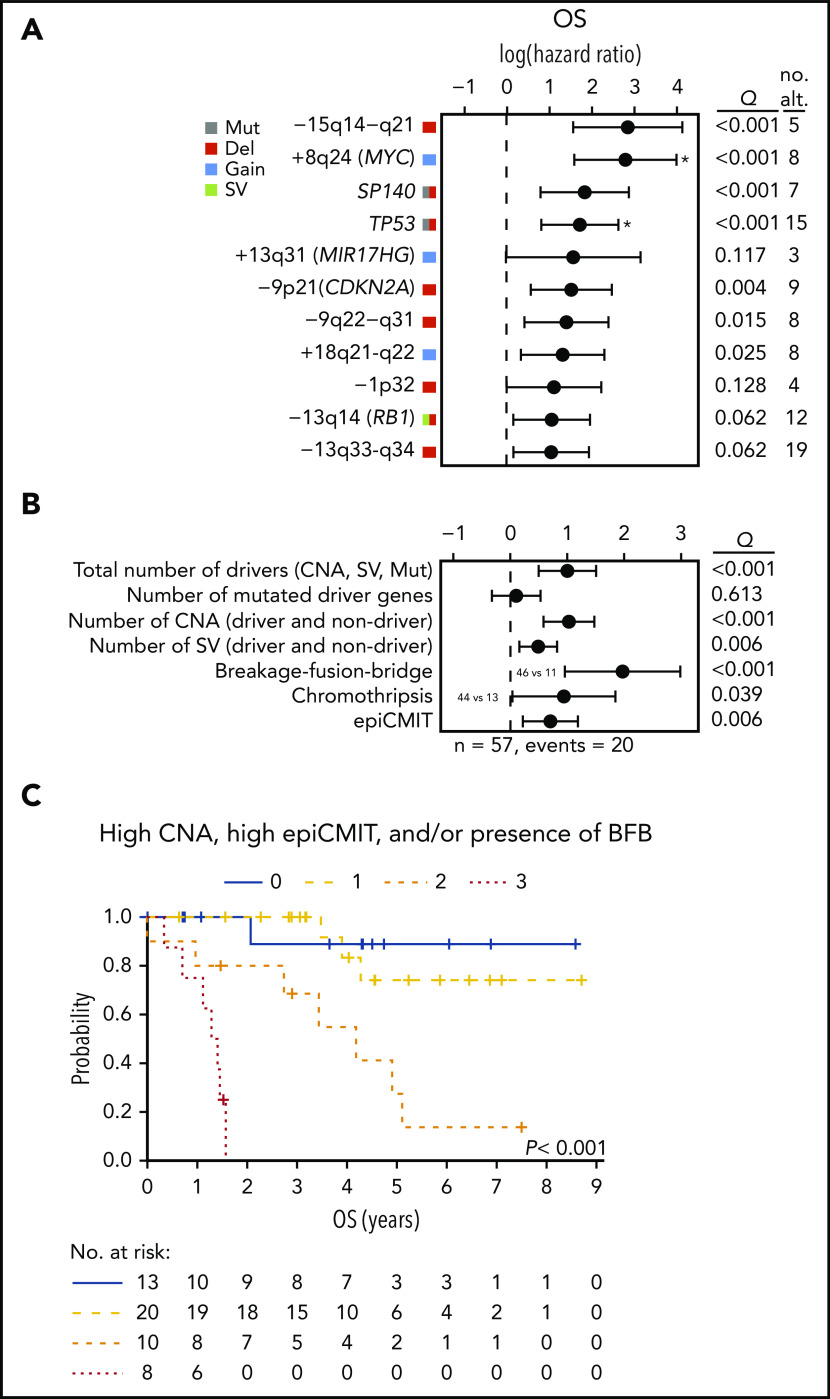
Mantle cell lymphoma (MCL) is a mature B-cell neoplasm initially driven by CCND1 rearrangement with 2 molecular subtypes, conventional MCL (cMCL) and leukemic non-nodal MCL (nnMCL), that differ in their clinicobiological behavior. To identify the genetic and epigenetic alterations determining this diversity, we used whole-genome (n = 61) and exome (n = 21) sequencing (74% cMCL, 26% nnMCL) combined with transcriptome and DNA methylation profiles in the context of 5 MCL reference epigenomes. We identified that open and active chromatin at the major translocation cluster locus might facilitate the t(11;14)(q13;32), which modifies the 3-dimensional structure of the involved regions. This translocation is mainly acquired in precursor B cells mediated by recombination-activating genes in both MCL subtypes, whereas in 8% of cases the translocation occurs in mature B cells mediated by activation-induced cytidine deaminase. We identified novel recurrent MCL drivers, including CDKN1B, SAMHD1, BCOR, SYNE1, HNRNPH1, SMARCB1, and DAZAP1. Complex structural alterations emerge as a relevant early oncogenic mechanism in MCL, targeting key driver genes. Breakage-fusion-bridge cycles and translocations activated oncogenes (BMI1, MIR17HG, TERT, MYC, and MYCN), generating gene amplifications and remodeling regulatory regions. cMCL carried significant higher numbers of structural variants, copy number alterations, and driver changes than nnMCL, with exclusive alterations of ATM in cMCL, whereas TP53 and TERT alterations were slightly enriched in nnMCL. Several drivers had prognostic impact, but only TP53 and MYC aberrations added value independently of genomic complexity. An increasing genomic complexity, together with the presence of breakage-fusion-bridge cycles and high DNA methylation changes related to the proliferative cell history, defines patients with different clinical evolution.


Conflict of interest statement

Conflict-of-interest disclosure: E.C. is named inventor on 2 patents filed by the National Institutes of Health, National Cancer Institute: “Methods for selecting and treating lymphoma types,” licensed to NanoString Technologies, and “Evaluation of mantle cell lymphoma and methods related thereof.” X.S.P. has ownership interest in DREAMgenics. The remaining authors declare no competing financial interests.

Figures

None
Graphical abstract
Figure 1.
Figure 1.
Characterization of the IG breaks of the IG/CCND1 translocation. (A) Distribution of the IG breaks according to their underlying mechanism (RAG or non-RAG mediated) and location of the breakpoints in chr14. (B) Schema of the most recurrent translocation pattern with breaks at IGHD and IGHJ genes, near RSS, likely generated during the first step of an IGH D-J rearrangement. The presence of N-nucleotides in both breakpoints (NX) supports a RAG-mediated process. (C) Unbalanced IG/CCND1 translocation in which virtually the entire 14q arm is inserted at the 3′ UTR of CCND1. In this case, a single event truncated the CCND1 3′ UTR region and placed the IG enhancer near CCND1. The FISH whole-chromosome painting for chr11 and chr14 verifies the ins(11;14)(q13;q11q32) identified by WGS. For the sake of clarity, an interphasic nuclei present in the lower left part of the original picture was masked using Adobe Photoshop. (D) Representation of 3 cases in which the IG breakpoint was likely mediated by AID during CSR. The switch regions 5′ of the IGH constant genes are indicated by a blue line. The productive V(D)J rearrangement, IGHV identity (%), and isotype expression is specified. (E) Representation of 2 cases showing evidence for the involvement of the SHM machinery in the breakpoints of chr14 in already V(D)J-rearranged alleles. P, productive rearrangement; U, unproductive rearrangement.
Figure 2.
Figure 2.
Integrative analysis of chr11 breaks of the IG/CCND1 translocation. (A) Distribution of breakpoints observed in chr11 in cMCL (top) and nnMCL (bottom). The number of cases with breakpoints in close proximity is summarized using a sliding window of 89 bp (MTC length) starting from the MTC region (shown in green). (B) Representation of the reference epigenomes of 5 MCL cases and 15 normal B cell samples spanning the B-cell maturation program. Numbers in brackets indicate the number of samples considered to build the consensus chromatin map of each cell type. (top) The breakpoints of each case are highlighted by a white square. (middle) Signal of H3K4me1 in B-cell acute lymphoblastic leukemia (B-ALL). (bottom) Chromatin accessibility (ATAC-seq peaks) showing the presence of an open chromatin region near the MTC region. B cells are grouped, and a consensus is depicted. (C) Reconstruction of the chromatin states of the IG/CCND1 translocated allele. Dashed lines indicate the junction of both chromosomes to maintain the breakpoints relative to the MTC and CCND1. (D) Hi-C contact matrices for memory B cells (MBC) and 2 nnMCL cases. The TAD associated with CCND1 and modulated upon the IG/CCND1 translocation is highlighted. GCBC, germinal center B cell; NBCB, naive B cell from peripheral blood; NBCT, naive B cell from tonsil; PC, plasma cell.
Figure 3.
Figure 3.
Complex genomic alterations in MCL identified by WGS. (A) Genomic complexity identified in both subtypes of MCL. Cases are depicted in columns. Rows illustrate CNA complexity, the number of homozygous deletions and amplifications, SV complexity, and different SV complex phenomena characterized by clustered SV (chromothripsis, kataegis overlapping with SV, BFB cycles, chromoplexia, and templated insertions). (B) Illustrative example of a whole chr13 affected by chromothripsis in a cMCL (i). (ii) Bar plot of chromosomes affected by chromothripsis (CT) in the 2 MCL subtypes. (C) Partial circos plot showing the 3 chromosomes involved in chromoplexia and TERT amplification and translocation in a nnMCL (i). (ii) Partial circos plot showing 4 chromosomes with crossed rearrangements and template insertions (focal gains) in 3 of them (chromosomes 1, 5, and 8) in a cMCL. (D) Illustrative example of BFB cycles resulting in amplification of MIR17HG in 13q accompanied by a terminal deletion (i). (ii) Kaplan-Meier curve of OS according to the presence of BFB cycles. (E) Enrichment of SV breakpoints in different chromatin states, as compared with background, in MCL and normal B cells. (F) Global profile of CNA in cMCL (blue) and nnMCL (yellow). The regions with different proportions of altered cases between subtypes (Q < 0.15) are indicated (*). Only regions with at least 6 altered cases were included in the comparison.
Figure 4.
Figure 4.
Significantly mutated genes/CNA and pathways. (A) Oncoprint representation of the 43 driver alterations identified in MCL. Drivers are depicted in rows, and cases are displayed in columns. Novel driver alterations identified in this study are highlighted in dark orange. (B) Distribution and type of driver alterations in the 2 different MCL subtypes. Drivers with a different proportion of altered cases between subtypes (Q < 0.15) are indicated.
Figure 5.
Figure 5.
DNA methylome of MCL subtypes and its relationship with genomic alterations. (A) Overlap of cMCL and nnMCL with epigenetic subgroups on the basis of cell of origin methylation signature. (B) Principal component analysis of DNA methylation data for 70 MCL (first and second components are shown). MCL subtypes are represented as triangles or circles, whereas the color represents the proliferative history on the basis of DNA methylation of each MCL sample (epiCMIT score). (C) epiCMIT correlates with mutational signatures related to cell division, including SBS5 and SBS9 (ncAID). (D) epiCMIT correlates with the total number of driver alterations in MCL, particularly in cMCL. (E) Driver alterations associated with higher or lower epiCMIT. The 95% confidence intervals for the mean epiCMIT difference between the presence and absence of each alteration are shown. The effect in the whole cohort was adjusted by the cell of origin (C1/C2). (left) Colors depict different significant levels after false discovery rate (FDR) correction. Oncoprint with genetic alterations associated with the epiCMIT together with clinicobiological variables. (right) Patients are ordered according to the epiCMIT score, separately in the 2 MCL subtypes.
Figure 6.
Figure 6.
Clinical relevance of genomic and epigenomic alterations in MCL subtypes. (A) Impact of driver alterations on OS. The impact is quantified with the 95% confidence interval of the log hazard ratios. The Q value shown is the adjusted P value of the log-rank test. Only alterations with at least 3 altered cases and prognostic value are shown. Drivers with independent prognostic value (Q < 0.05) of the number of CNA are indicated (*). (B) Impact of the cumulative number of genetic and epigenetic changes to OS. The impact is quantified with the 95% CI of the log hazard ratios. Continuous variables were scaled. The Q value shown is the adjusted P value of the simple Cox regression for the continuous variables or the log-rank test for the binary variables (BFB and chromothripsis). The number of SV was available in 42 cases. The epiCMIT was available in 51 cases and its effect was adjusted by the cell of origin (C1/C2). (C) Kaplan-Meier curves of OS according to the number of risk features (high CNA, high epiCMIT, and/or presence of BFB). Number of CNA >7 (median) and epiCMIT >0.6 (valley of a bimodal distribution) were considered high. no. alt, number of altered cases.

Comment in

References

    1. In: Swerdlow SH, Campo E, Harris NL, eds., et al... WHO Classification of Tumours of Haematopoietic and Lymphoid Tissues (Revised 4th Edition), Lyon, France: IARC; 2017:
    1. Martin P, Chadburn A, Christos P, et al. . Outcome of deferred initial therapy in mantle-cell lymphoma. J Clin Oncol. 2009;27(8):1209-1213. - PubMed
    1. Martin P, Leonard J. Is there a role for “watch and wait” in patients with mantle cell lymphoma? Semin Hematol. 2011;48(3):189-193. - PubMed
    1. Campo E, Rule S. Mantle cell lymphoma: evolving management strategies. Blood. 2015;125(1):48-55. - PubMed
    1. Fernàndez V, Salamero O, Espinet B, et al. . Genomic and gene expression profiling defines indolent forms of mantle cell lymphoma. Cancer Res. 2010;70(4):1408-1418. - PubMed

Publication types