. 2020 Jul 6;54(1):60-74.e7.
doi: 10.1016/j.devcel.2020.05.022. Epub 2020 Jun 24.

Comprehensive Endogenous Tagging of Basement Membrane Components Reveals Dynamic Movement within the Matrix Scaffolding

Affiliations

Comprehensive Endogenous Tagging of Basement Membrane Components Reveals Dynamic Movement within the Matrix Scaffolding

Daniel P Keeley et al. Dev Cell. .

Abstract

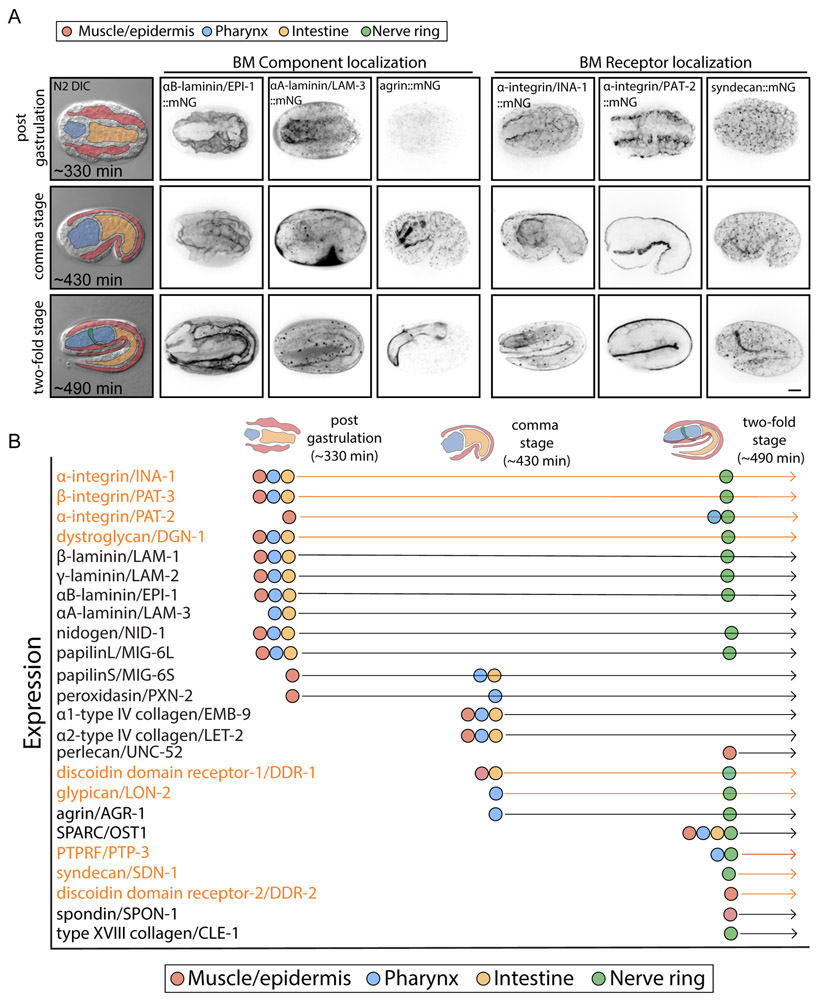
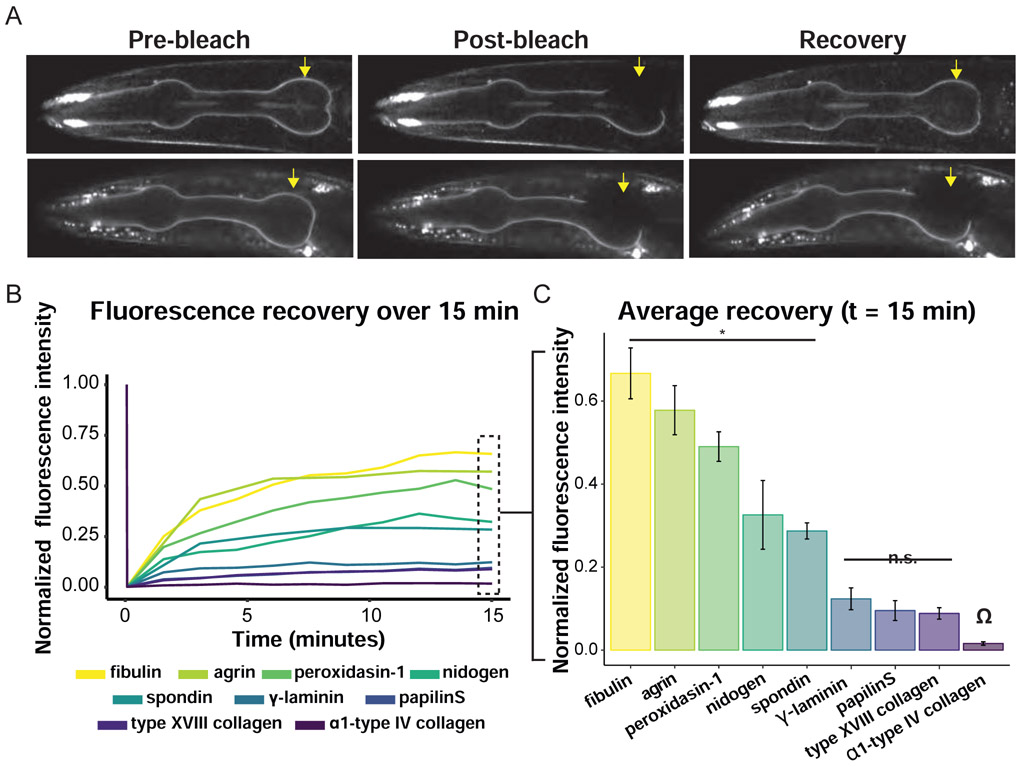
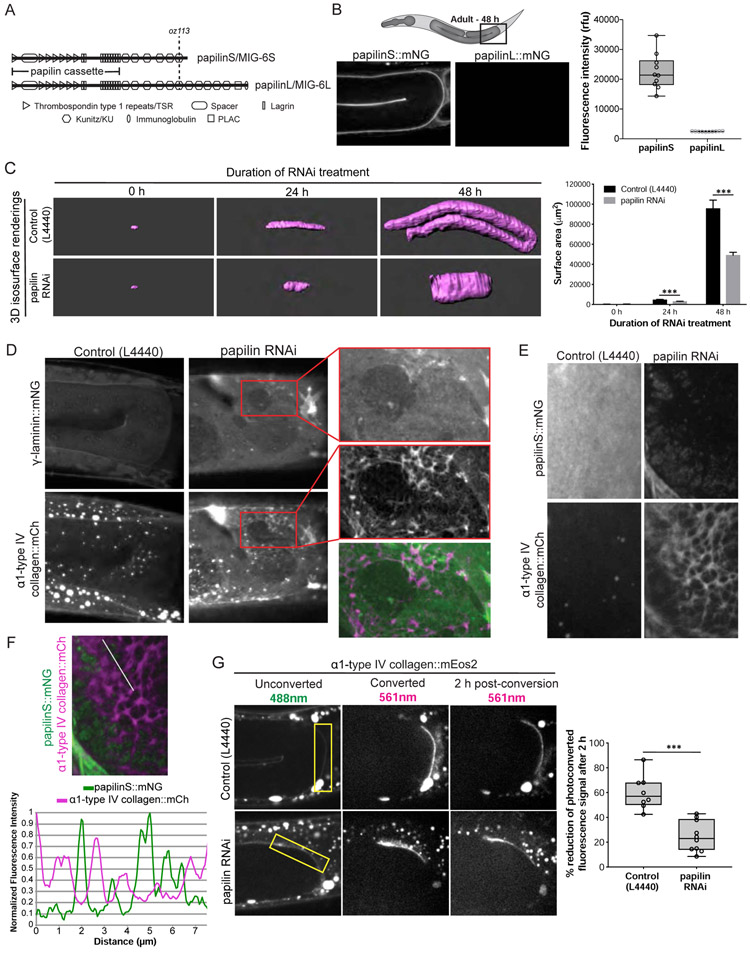
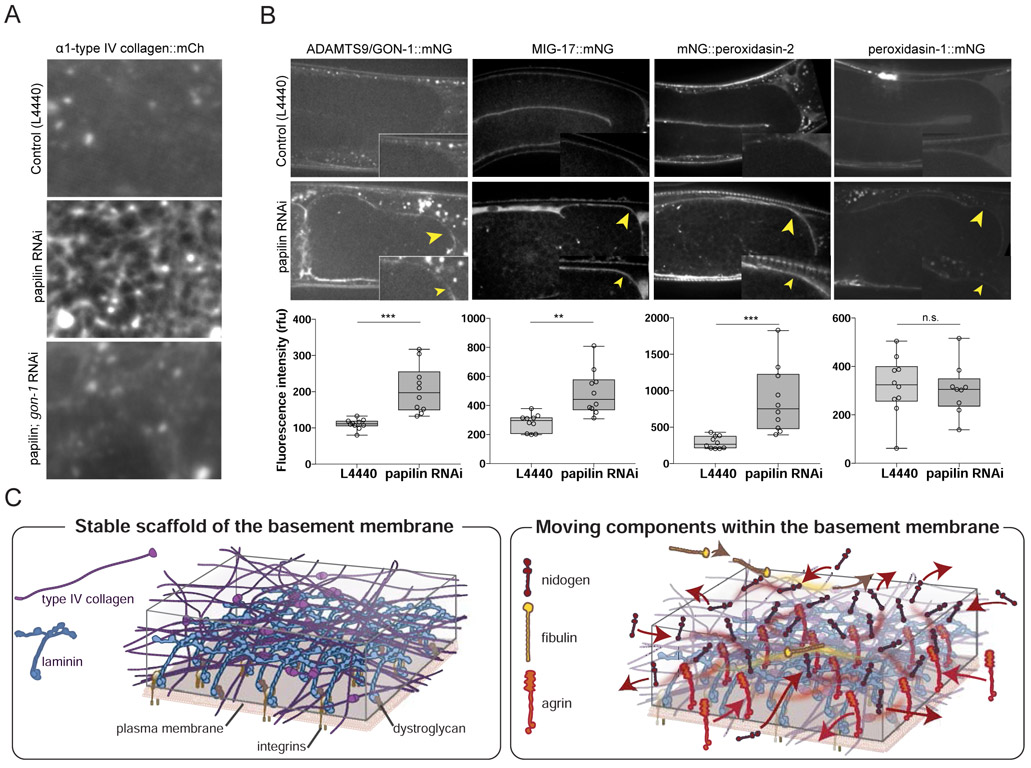
Basement membranes (BMs) are supramolecular matrices built on laminin and type IV collagen networks that provide structural and signaling support to tissues. BM complexity, however, has hindered an understanding of its formation, dynamics, and regulation. Using genome editing, we tagged 29 BM matrix components and receptors in C. elegans with mNeonGreen. Here, we report a common template that initiates BM formation, which rapidly diversifies during tissue differentiation. Through photobleaching studies, we show that BMs are not static-surprisingly, many matrix proteins move within the laminin and collagen scaffoldings. Finally, quantitative imaging, conditional knockdown, and optical highlighting indicate that papilin, a poorly studied glycoprotein, is the most abundant component in the gonadal BM, where it facilitates type IV collagen removal during BM expansion and tissue growth. Together, this work introduces methods for holistic investigation of BM regulation and reveals that BMs are highly dynamic and capable of rapid change to support tissues.

Keywords: C. elegans; basement membrane; basement membrane dynamics; endogenous tagging; extracellular matrix; laminin; organ growth; papilin; type IV collagen.


Conflict of interest statement

Declaration of Interests The authors declare no competing interests.

Figures

Figure 1.
Figure 1.. Basement Membrane (BM) Matrix Components and Receptors in C. elegans.
(A) A schematic of the embryonic and larval stages of the C. elegans life cycle labeled with developmental times post-fertilization (embryonic stages) or post-hatching (larval stages) at 20°C with the pharynx and gonad highlighted. (B) A schematic of BM composition showing the major families of conserved BM matrix components and receptors in C. elegans that were endogenously tagged using genome editing. See Methods for details on molecule illustrations.
Figure 2.
Figure 2.. BM emergence during development.
(A) The left column shows differential interference contrast (DIC) images of embryonic development at 20°C at the post-gastrulation (330 min post fertilization), comma (430 min), and two-fold stages (490 min). Color overlays highlight embryonic muscle and epidermis (red), pharynx (blue), intestine (yellow), and the nerve ring when it arises at the two-fold stage (green). The muscle and epidermis are colored together as they were difficult to differentiate; however, clear associations with muscle are noted in the text. Inverted grayscale maximum intensity projections show fluorescence localization of representative BM components (columns 2-4)— the α-laminin subunits (EPI-1 and LAM-3) and agrin/AGR-1. EPI-1 localizes to the BM of all tissues starting from the end of gastrulation, while LAM-3 shows a similar pattern, but is absent from muscle/epidermis and the nerve ring. Agrin is restricted to the pharynx BM starting at the comma stage. Maximum intensity projections (with single z-slice shown for PAT-2 at two-fold stage) of BM receptor localization (columns 5-7) of the α-integrins (INA-1 and PAT-2) and syndecan/SDN-1. INA-1 localizes to cell-BM interface of all tissues, while PAT-2 appears at the muscle-BM interface at gastrulation then later at the pharynx and nerve ring BM. Scale bar is 10μm. (B) A graphic summary of matrix component (black) and matrix receptor (orange) localization during embryonic development (n ≥ 5 animals examined for each stage and each BM component). Arrows represent developmental progress and dots represent the stage of emergence in each tissue.
Figure 3.
Figure 3.. Quantification of BM composition and regional localization.
(A) Representative inverted grayscale maximum intensity confocal projections of whole animal γ-laminin::mNG (left) and α1-type IV collagen::mNG (right) at the L1 stage. (B) Normalized mean fluorescence intensity displayed as waffle plots compare the composition of the gonadal and pharynx BMs per unit area. Each square is normalized to the mean fluorescence intensity of the least abundant component, peroxidasin-1 (n ≥ 9 animals imaged for each matrix component). (C) Heatmaps of maximum intensity projections from confocal z-stacks of the L1 pharynx enlarged to emphasize regional differences (see schematic) in protein distribution— type IV collagen is in a gradient from posterior-to-anterior, laminin and nidogen are evenly distributed (but concentrated around nerve ring, orange arrowheads), papilinS is evenly distributed (signal from the epidermis makes it appear higher in the posterior bulb), agrin is enriched in the anterior region (arrow), type XVIII collagen is at high levels in the posterior bulb (white arrow, and also in nerve ring BM, orange arrowhead), fibulin is enriched in the anterior region (arrow), spondin is enriched in the metacorpus (arrow), and peroxidasin-1 and perlecan are present at low uniform levels (n = 10 animals examined for each). Scale bar is 10μm.
Figure 4.
Figure 4.. FRAP of BM components reveal stable and dynamic matrix components.
(A) Confocal images (single z-slices) of the L4 pharynx show differences in recovery rate after photobleaching for mNG::fibulin and α1-type IV collagen::mNG over 15 min. Yellow arrows indicate the bleached half of the pharynx and dashed white line indicates the unbleached control region. Scale bar is 10μm. (B) Line graph showing the normalized fluorescence recovery of nine basement membrane components present in the L4 pharynx over 15 min (n = 5 animals for each). (C) Bar graph displays the mean recovery fraction for each protein at the end of 15 min. Error bars denote standard error. All means were compared to the α1-type IV collagen as denoted by the Ω symbol. Black bars indicate two groups: * mNG::fibulin, agrin-1::mNG, peroxidasin-1::mNG, nidogen::mNG, and spondin::mNG exhibited faster recovery than α1-type IV collagen (n = 5 animals for each, * p < 0.005, Dunnett’s test); however, no significant (n.s.) differences were observed for γ-laminin::mNG, papilinS::mNG, and α1-type XVIII collagen::mNG.
Figure 5.
Figure 5.. The matrix component fibulin moves within the BM.
(A) (Left) A 10-min time-lapse (imaged every 10 s) of mNG::fibulin FRAP. Images show a single confocal z-slice of the pharynx and an inset of the photobleached region with a heatmap prior to photobleaching (prebleach), after photobleaching (0 min), and at 4- and 10-min recovery timepoints. Gray boxes represent the control region distant from the bleached area, green boxes the unbleached region of the BM outside the edge of the bleached area, blue boxes the edge of the bleached area, and purple boxes the midregion of the photobleached area. (Right) A line graph of normalized fluorescence recovery reveals that recovery first occurs at the edge of the bleached region (blue) before recovering in the middle (magenta). The graph also shows greater loss of fluorescence in the BM closer to the photobleached region (green) than the control region (gray) (n = 5/5 animals). (B) (Left) A representative 30-min time-lapse (imaged every 2 min) of type XVIII collagen::mNG FRAP and (Right) a line graph of recovery. Dim fluorescence signal recovers uniformly across the bleached region independent of proximity to the edge of the bleached region (n = 5/5 animals examined). (C) (Left) Confocal images (single z-slices) of the L4 pharynx show differences in recovery rate of mNG::fibulin after photobleaching between control (polystyrene bead immobilization allowing muscle contractions) and tricaine/levamisole and BDM muscle paralysis treatments. Yellow arrows indicate the bleached half of the pharynx and dashed white box indicates the unbleached control region. (Right) Bar graph displays the mean recovery fraction at the end of the 15-min interval. Error bars denote standard error. All means were compared to the mNG::fibulin control (n = 5 animals for each, ** p < 0.001, *** p < 0.0001, Student’s t-test). Scale bar is 10μm.
Figure 6.
Figure 6.. Papilin promotes type IV collagen network remodeling during BM growth.
(A) A diagram of papilin/MIG-6 shows the protein domains of papilinS and papilinL isoforms and the papilinL truncation mutant (mig-6(oz113)). (B) (Top left) A diagram of the C. elegans gonad (gray) where levels of papilinS::mNG and papilinL::mNG fluorescence were compared (black box). (Bottom left) Single confocal z-slices of papilinS::mNG and papilinL::mNG at the young adult stage and (Right) quantification of fluorescence (boxplot, n = 10 animals for each). (C) (Left) 3D isosurface renderings of gonadal α1-type IV collagen::mCh following 0, 24, or 48 h of RNAi treatment in control and papilin RNAi animals. (Right) Quantification of gonadal surface area; bar graphs show mean surface area and error bars represent standard deviation (n = 3-6 animals examined for each, *** p<0.0001, Student’s t-test). (D) Confocal maximum intensity projections show co-localization of γ-laminin::mNG and α1-type IV collagen::mCh in the turn region of the adult gonad in an untreated control and a papilin RNAi knockdown animal. Reduction of papilin disrupted gonad growth and led to a fibrous increase in type IV collagen. The laminin network in the same animal was normal (magnified insets with overlay, n = 10 animals). (E) Maximum intensity projections show co-localization of the even distribution of papilinS::mNG and α1-type IV collagen::mCh within control animals BM compared to the patchy localization of papilinS and fibrous α1-type IV collagen::mCh after RNAi mediated loss of papilin. (F) Overlay of residual papilinS::mNG and α1-type IV collagen::mCh maximum intensity projection images after RNAi knockdown of papilin. A line plot indicated by the white line shows that areas with low papilin have high type IV collagen and vice versa (n = 5/5 animals). (G) (Left) Single confocal z-slices of α1-type IV collagen::mEos2 prior to, immediately after, and 2 h after photoconversion in a control and papilin RNAi knockdown animal. Optically highlighted α1-type IV collagen::mEos2 is indicated by yellow boxes. (Right) Quantification of the percentage reduction in mean photoconverted (red) mEos2 signal after 2 h (boxplot, n = 8-10 animals for each, *** p < 0.0001, Student’s t-test). Scale bars are 10μm except panel C, which is 25μm.
Figure 7.
Figure 7.. Papilin limits ADAMTS protease and peroxidasin gonadal BM association
(A) Confocal sum projections of α1-type IV collagen::mCh fluorescence in the gonadal BM. RNAi knockdown of papilin led to an increased fibrous type IV collagen network (n = 16/16) that was rescued by loss of gon-1 (n = 21/23). (B) (Top) Single confocal slices through the gonad arm shows GON-1::mNG, MIG-17::mNG, mNG::peroxidasin-2, and peroxidasin-1::mNG in control or papilin RNAi treated animals. Loss of papilin resulted in increased BM association of GON-1, MIG-17, and peroxidasin-2, but not peroxidasin-1. (Bottom) Quantification of BM fluorescence intensity, (boxplot, control n = 10 and papilin RNAi n = 10 for each, n.s., not significant, ** p < 0.001 or *** p < 0.0001, Student’s t-test). Scale bars are 10μm. (C) A model for BM dynamics. (Left) Laminin (and possibly type IV collagen (Jayadev et al., 2019)) associate with the cell membranes through integrin and dystroglycan receptors forming a stable scaffolding. (Right) Nidogen, fibulin, and agrin (spondin and peroxidasin-1 not shown) move dynamically within the laminin and type IV collagen network.

Comment in

Similar articles

Cited by

References

    1. Bajic G, Yatime L, Klos A, and Andersen GR (2013). Human C3a and C3a desArg anaphylatoxins have conserved structures, in contrast to C5a and C5a desArg. Protein Sci. 22, 204–212. - PMC - PubMed
    1. Bányai L, Sonderegger P, and Patthy L (2010). Agrin binds BMP2, BMP4 and TGFbeta1. PLoS One 5, e10758. - PMC - PubMed
    1. van den Berg MCW, MacCarthy-Morrogh L, Carter D, Morris J, Ribeiro Bravo I, Feng Y, and Martin P (2019). Proteolytic and Opportunistic Breaching of the Basement Membrane Zone by Immune Cells during Tumor Initiation. Cell Rep. 27, 2837–2846.e4. - PMC - PubMed
    1. Bunt S, Hooley C, Hu N, Scahill C, Weavers H, and Skaer H (2010). Hemocyte-secreted type IV collagen enhances BMP signaling to guide renal tubule morphogenesis in Drosophila. Dev. Cell 19, 296–306. - PMC - PubMed
    1. Candiello J, Cole GJ, and Halfter W (2010). Age-dependent changes in the structure, composition and biophysical properties of a human basement membrane. Matrix Biol 29, 402–410. - PubMed

Publication types