

Mathematical modeling of PDGF-driven glioma reveals the dynamics of immune cells infiltrating into tumors
- PMID: 32585427
- PMCID: PMC7322103
- DOI: 10.1016/j.neo.2020.05.005
Mathematical modeling of PDGF-driven glioma reveals the dynamics of immune cells infiltrating into tumors
Abstract
Background: Tumor-infiltrated immune cells compose a significant component of many cancers. They have been observed to have contradictory impacts on tumors. Although the primary reasons for these observations remain elusive, it is important to understand how immune cells infiltrating into tumors is regulated. Recently our group conducted a series of experimental studies, which showed that muIDH1 gliomas have a significant global reduction of immune cells and suggested that the longer survival time of mice with CIMP gliomas may be due to the IDH mutation and its effect on reducing of the tumor-infiltrated immune cells. However, to comprehend how IDH1 mutants regulate infiltration of immune cells into gliomas and how they affect the aggressiveness of gliomas, it is necessary to integrate our experimental data into a dynamical system to acquire a much deeper understanding of subtle regulation of immune cell infiltration.
Methods: The method is integration of mathematical modeling and experiments. According to mass conservation laws and assumption that immune cells migrate into the tumor site along a chemotactic gradient field, a mathematical model is formulated. Parameters are estimated from our experiments. Numerical methods are developed to solve the problem. Numerical predictions are compared with experimental results.
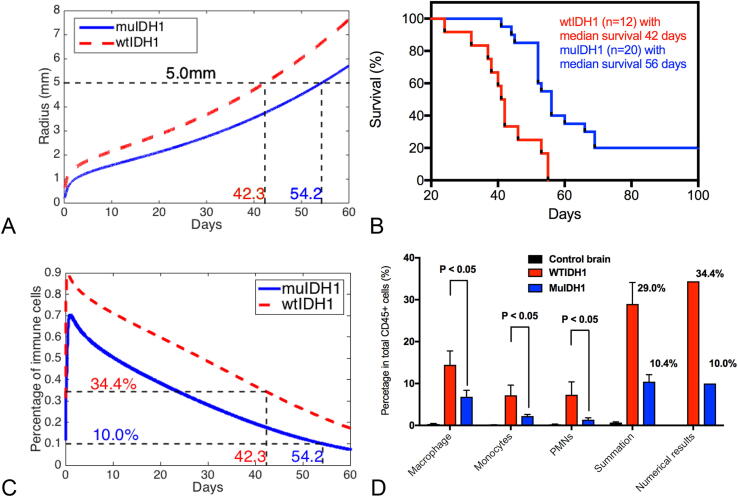
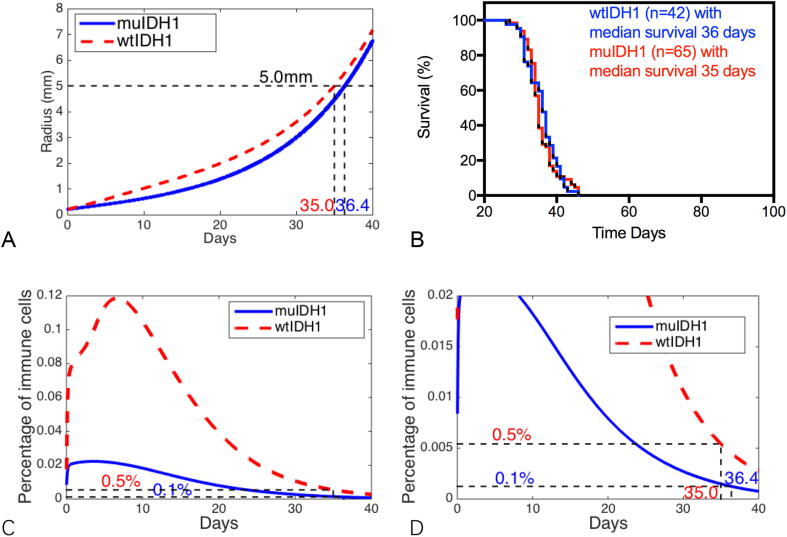
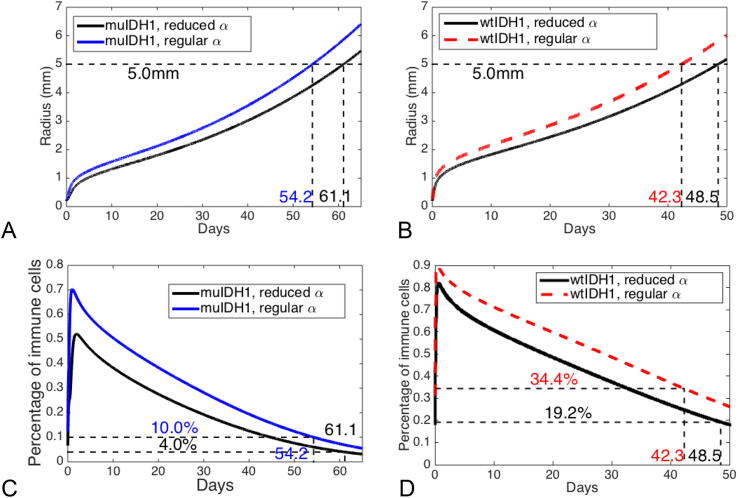
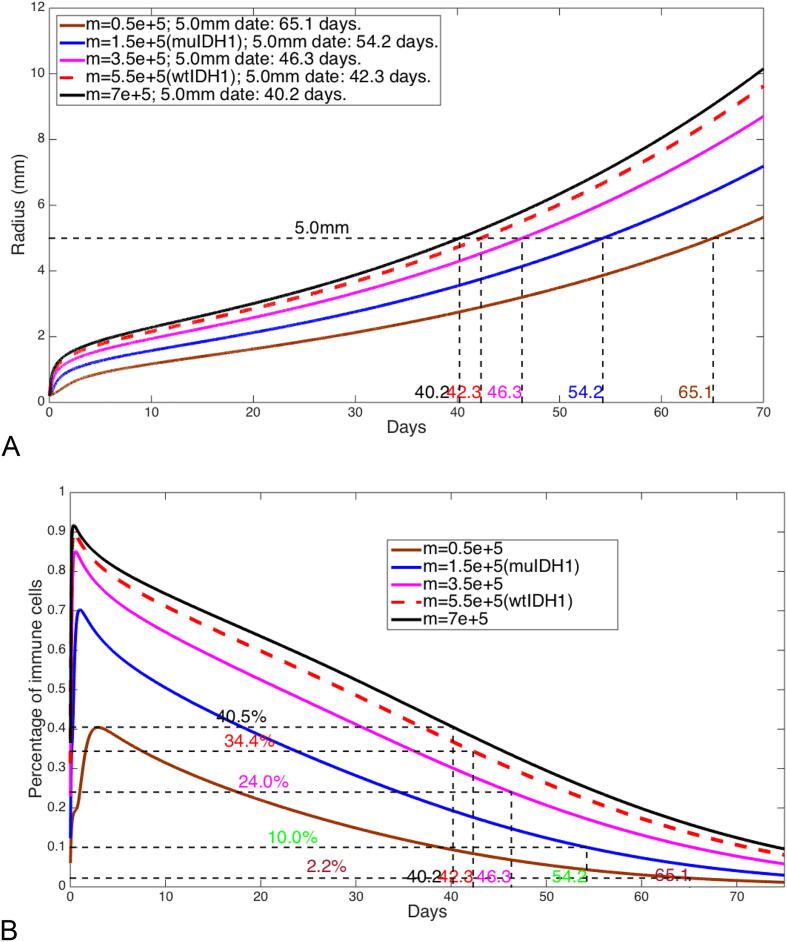
Results: Our analysis shows that the net rate of increase of immune cells infiltrated into the tumor is approximately proportional to the 4/5 power of the chemoattractant production rate, and it is an increasing function of time while the percentage of immune cells infiltrated into the tumor is a decreasing function of time. Our model predicts that wtIDH1 mice will survive longer if the immune cells are blocked by reducing chemotactic coefficient. For more aggressive gliomas, our model shows that there is little difference in their survivals between wtIDH1 and muIDH1 tumors, and the percentage of immune cells infiltrated into the tumor is much lower. These predictions are verified by our experimental results. In addition, wtIDH1 and muIDH1 can be quantitatively distinguished by their chemoattractant production rates, and the chemotactic coefficient determines possibilities of immune cells migration along chemoattractant gradient fields.
Conclusions: The chemoattractant gradient field produced by tumor cells may facilitate immune cells migration to the tumor cite. The chemoattractant production rate may be utilized to classify wtIDH1 and muIDH1 tumors. The dynamics of immune cells infiltrating into tumors is largely determined by tumor cell chemoattractant production rate and chemotactic coefficient.
Keywords: Chemotactic gradient field; Immune cell; Infiltration dynamics; muIDH1; wtIDH1.
Copyright © 2020 The Authors. Published by Elsevier Inc. All rights reserved.
Figures


Similar articles
-
Mutant IDH1 regulates the tumor-associated immune system in gliomas.Genes Dev. 2017 Apr 15;31(8):774-786. doi: 10.1101/gad.294991.116. Epub 2017 May 2. Genes Dev. 2017. PMID: 28465358 Free PMC article.
-
Isocitrate dehydrogenase mutations suppress STAT1 and CD8+ T cell accumulation in gliomas.J Clin Invest. 2017 Apr 3;127(4):1425-1437. doi: 10.1172/JCI90644. Epub 2017 Mar 20. J Clin Invest. 2017. PMID: 28319047 Free PMC article.
-
IDH mutant gliomas escape natural killer cell immune surveillance by downregulation of NKG2D ligand expression.Neuro Oncol. 2016 Oct;18(10):1402-12. doi: 10.1093/neuonc/now061. Epub 2016 Apr 25. Neuro Oncol. 2016. PMID: 27116977 Free PMC article.
-
[The role of tumor infiltrating lymphocytes in the immunopathology of gliomas].Neurol Neurochir Pol. 2001 Jul-Aug;35(4):661-6. Neurol Neurochir Pol. 2001. PMID: 11783408 Review. Polish.
-
A Systematic Review of the Tumor-Infiltrating CD8+ T-Cells/PD-L1 Axis in High-Grade Glial Tumors: Toward Personalized Immuno-Oncology.Front Immunol. 2021 Sep 17;12:734956. doi: 10.3389/fimmu.2021.734956. eCollection 2021. Front Immunol. 2021. PMID: 34603316 Free PMC article.
Cited by
-
Role of neutrophil extracellular traps in regulation of lung cancer invasion and metastasis: Structural insights from a computational model.PLoS Comput Biol. 2021 Feb 17;17(2):e1008257. doi: 10.1371/journal.pcbi.1008257. eCollection 2021 Feb. PLoS Comput Biol. 2021. PMID: 33596197 Free PMC article.
-
Spatiotemporal dynamics of a glioma immune interaction model.Sci Rep. 2021 Nov 17;11(1):22385. doi: 10.1038/s41598-021-00985-1. Sci Rep. 2021. PMID: 34789751 Free PMC article.
-
Opportunities for improving brain cancer treatment outcomes through imaging-based mathematical modeling of the delivery of radiotherapy and immunotherapy.Adv Drug Deliv Rev. 2022 Aug;187:114367. doi: 10.1016/j.addr.2022.114367. Epub 2022 May 30. Adv Drug Deliv Rev. 2022. PMID: 35654212 Free PMC article. Review.
-
Interferon gamma-related gene signature based on anti-tumor immunity predicts glioma patient prognosis.Front Genet. 2023 Jan 13;13:1053263. doi: 10.3389/fgene.2022.1053263. eCollection 2022. Front Genet. 2023. PMID: 36712869 Free PMC article.
-
Molecular insights into glioblastoma progression: role of CHCHD2P9 in tumor heterogeneity and prognosis.Front Immunol. 2025 Jun 24;16:1581850. doi: 10.3389/fimmu.2025.1581850. eCollection 2025. Front Immunol. 2025. PMID: 40630954 Free PMC article.
References
Publication types
MeSH terms
Substances
Grants and funding
LinkOut - more resources
Full Text Sources
Medical
Miscellaneous
