

Characteristics of Patients Who Achieve Serum Phosphorus Control on Sucroferric Oxyhydroxide or Sevelamer Carbonate: A post hoc Analysis of a Phase 3 Study
- PMID: 32585670
- PMCID: PMC7592954
- DOI: 10.1159/000507258
Characteristics of Patients Who Achieve Serum Phosphorus Control on Sucroferric Oxyhydroxide or Sevelamer Carbonate: A post hoc Analysis of a Phase 3 Study
Abstract
Introduction: Control of hyperphosphatemia in patients on dialysis remains a major challenge.
Objective: This study evaluated predictors of serum phosphorus (sP) control among dialysis patients treated with noncalcium, oral phosphate binder therapy in a phase 3 clinical trial.
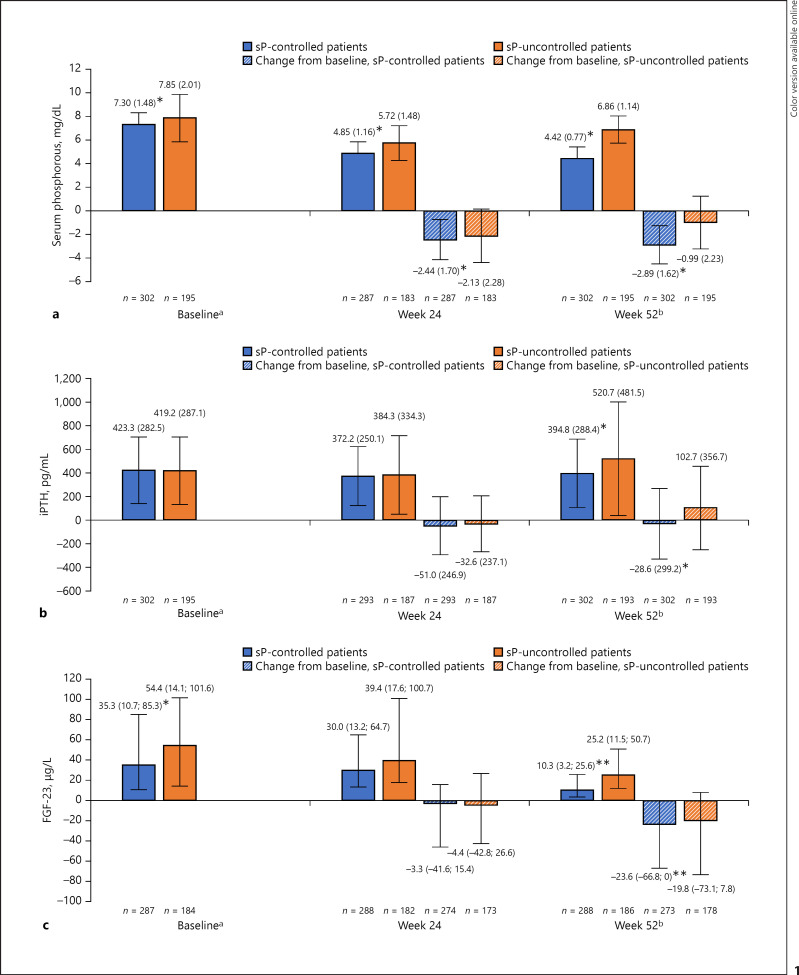
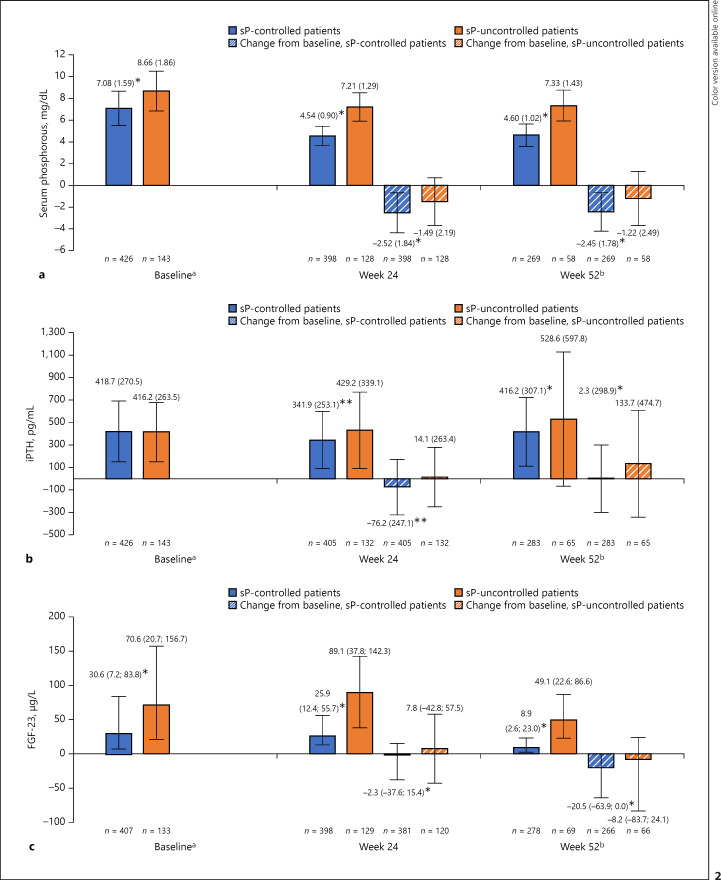
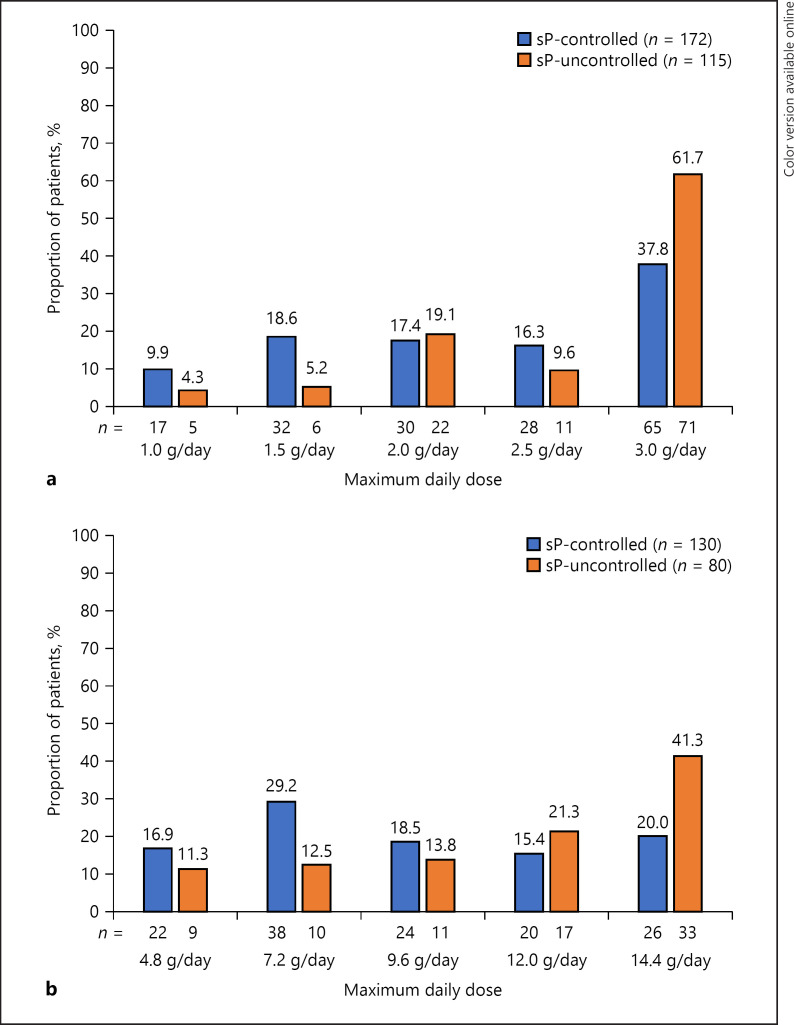
Methods: Post hoc analyses were performed using data for patients with hyperphosphatemia who received 52 weeks of treatment with sucroferric oxyhydroxide (SFOH) or sevelamer carbonate (sevelamer). Patients were categorized into those who achieved sP control (n = 302; defined as sP ≤ 5.5 mg/dL at week 52), and those with uncontrolled sP (n = 195; sP >5.5 mg/dL at week 52). Because SFOH and sevelamer have previously demonstrated similar effects on chronic kidney disease-mineral-bone disorder parameters in this study, the treatment groups were pooled.
Results: Average age at baseline was higher among sP-controlled versus sP-uncontrolled patients (56.9 vs. 53.4 years; p = 0.005). Baseline sP levels were significantly lower among sP-controlled versus sP-uncontrolled patients (7.30 vs. 7.85 mg/dL; p < 0.001), and sP reductions from baseline were significantly greater in the sP-controlled group (-2.89 vs. -0.99 mg/dL at week 52; p < 0.001). Logistic regression analysis identified higher baseline sP levels (odds ratio [OR] = 0.86, 95% confidence interval [CI]: 0.765-0.960), no concomitant active vitamin D therapy use (OR = 0.51, 95% CI: 0.328-0.804), and higher body mass index at baseline (OR = 0.96, 95% CI: 0.937-0.992) as significant predictors of uncontrolled sP.
Conclusion: This analysis indicates that sP control may be more challenging in younger patients with high sP levels. Closer monitoring and management of serum phosphorus levels may be required in this population.
Keywords: Chronic kidney disease; Dialysis; Phosphate binder; Sevelamer carbonate; Sucroferric oxyhydroxide.
The Author(s). Published by S. Karger AG, Basel.
Conflict of interest statement
A.C.C. has received consultancy fees or lecture fees from Vifor Pharma, Fresenius Medical Care, and Amgen. S.M.S. has received consultancy fees from OPKO, Vifor Pharma, Amgen, Fresenius Medical Care, Litholink Corp, and NPS Pharma and research funding from Abbott, Amgen, and Shire. A.R. has received consultancy fees from Fresenius Medical Care and Vifor Pharma and lecture and consultancy fees from Sanofi, Cytochroma/OPKO Health, Vifor Pharma, Satellite Healthcare, and Deltanoid. M.K. has received consulting fees or lecture fees from Vifor Pharma, Fresenius Medical Care, Amgen, AbbVie, Medice, Mitsubishi Pharma, Sanofi, and Shire. S.W. and A.P. are both employees of Vifor Pharma. J.F. has received consulting fees or lecture fees from AbbVie, Amgen, Chugai, Fresenius Medical Care, Sanofi, Shire, and Vifor Pharma.
Figures
References
-
- Martin KJ, González EA. Prevention and control of phosphate retention/hyperphosphatemia in CKD-MBD: what is normal, when to start, and how to treat? Clin J Am Soc Nephrol. 2011;6((2)):440–6. - PubMed
-
- Block GA, Klassen PS, Lazarus JM, Ofsthun N, Lowrie EG, Chertow GM. Mineral metabolism, mortality, and morbidity in maintenance hemodialysis. J Am Soc Nephrol. 2004;15((8)):2208–18. - PubMed
-
- Tentori F, Blayney MJ, Albert JM, Gillespie BW, Kerr PG, Bommer J, et al. Mortality risk for dialysis patients with different levels of serum calcium, phosphorus, and PTH: the Dialysis Outcomes and Practice Patterns Study (DOPPS) Am J Kidney Dis. 2008;52((3)):519–30. - PubMed
Publication types
MeSH terms
Substances
LinkOut - more resources
Full Text Sources
Other Literature Sources
