. 2020 Jun 23;21(12):4455.
doi: 10.3390/ijms21124455.

Maackiain Ameliorates 6-Hydroxydopamine and SNCA Pathologies by Modulating the PINK1/Parkin Pathway in Models of Parkinson's Disease in Caenorhabditis elegans and the SH-SY5Y Cell Line

Affiliations

Maackiain Ameliorates 6-Hydroxydopamine and SNCA Pathologies by Modulating the PINK1/Parkin Pathway in Models of Parkinson's Disease in Caenorhabditis elegans and the SH-SY5Y Cell Line

Rong-Tzong Tsai et al. Int J Mol Sci. .

Abstract

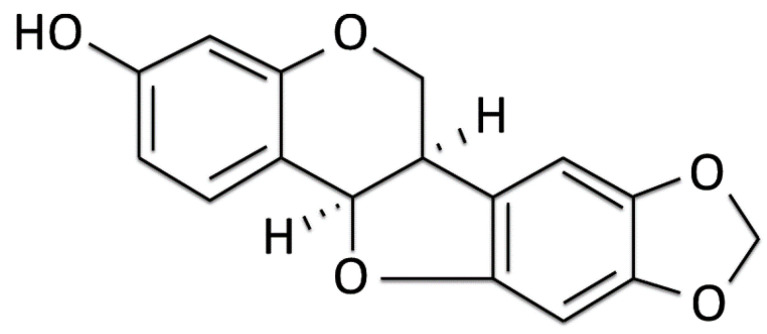
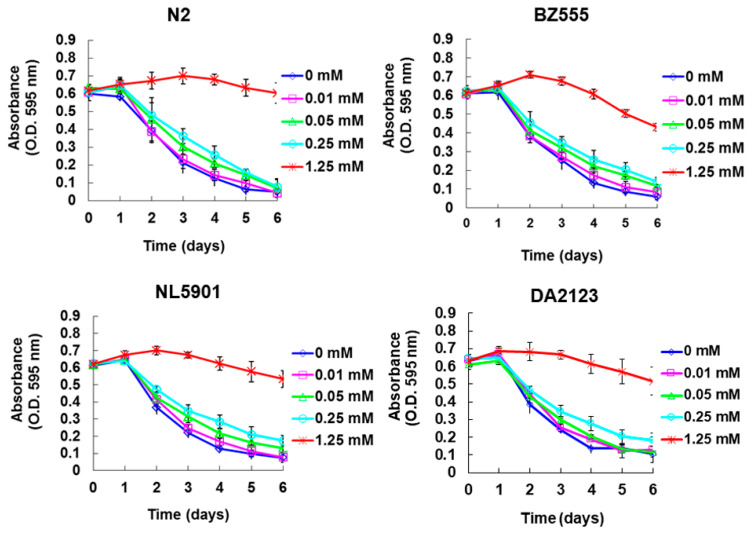
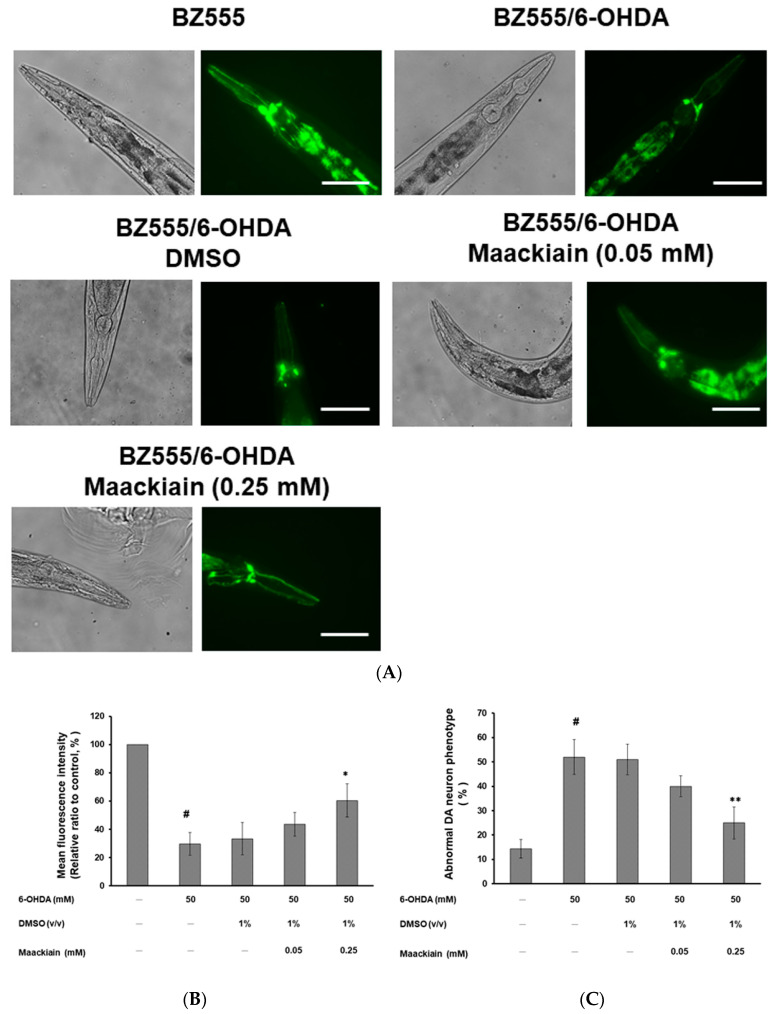
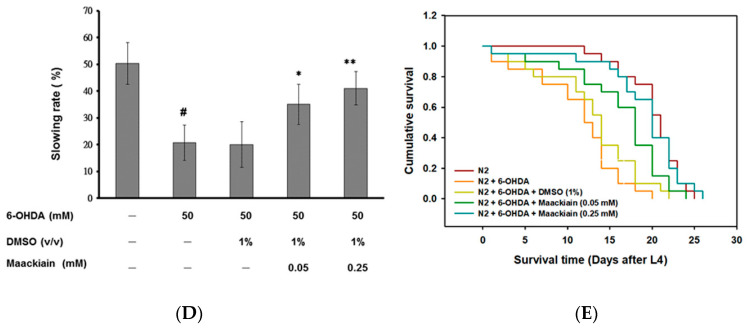
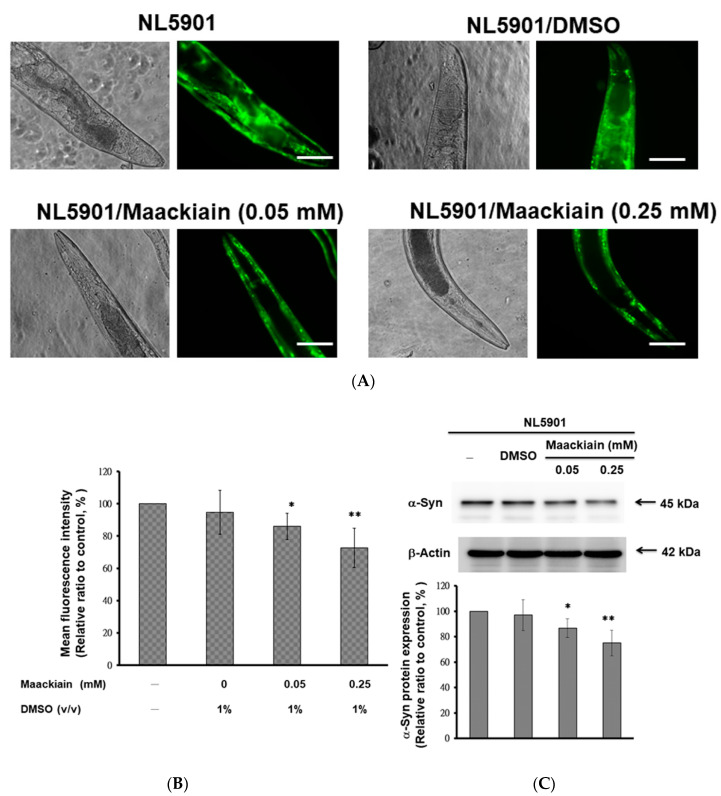
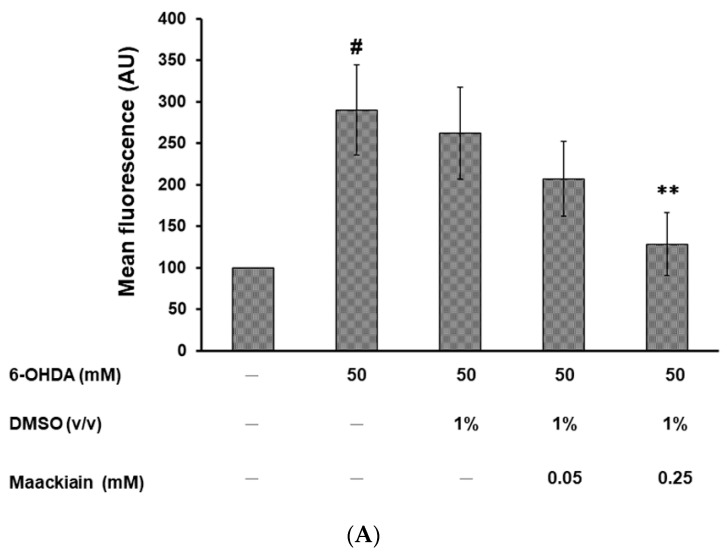
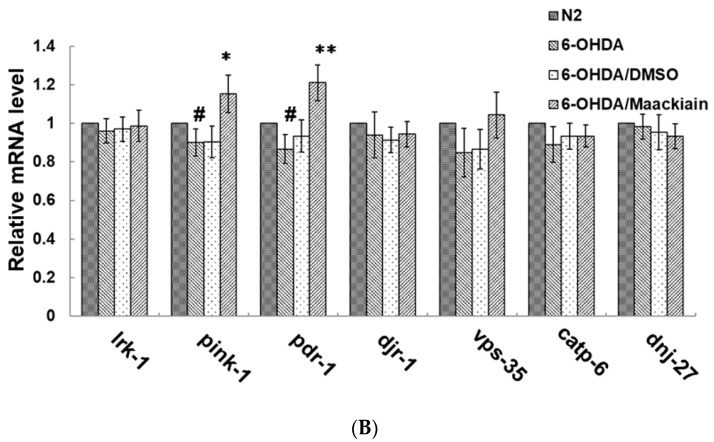
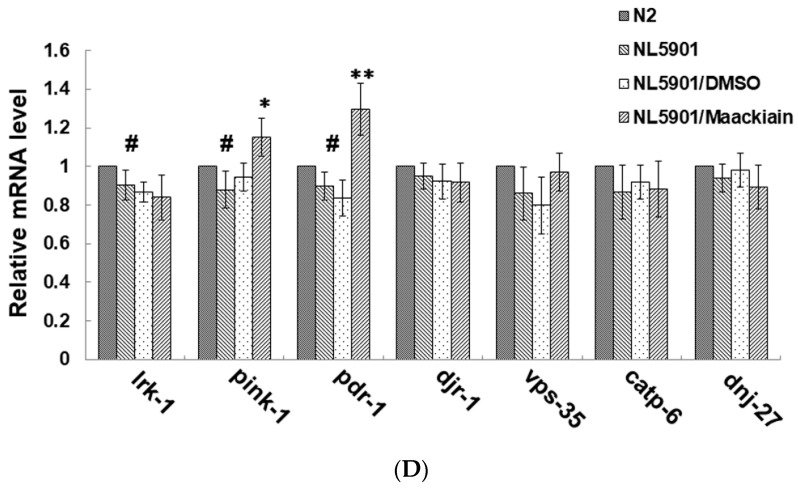
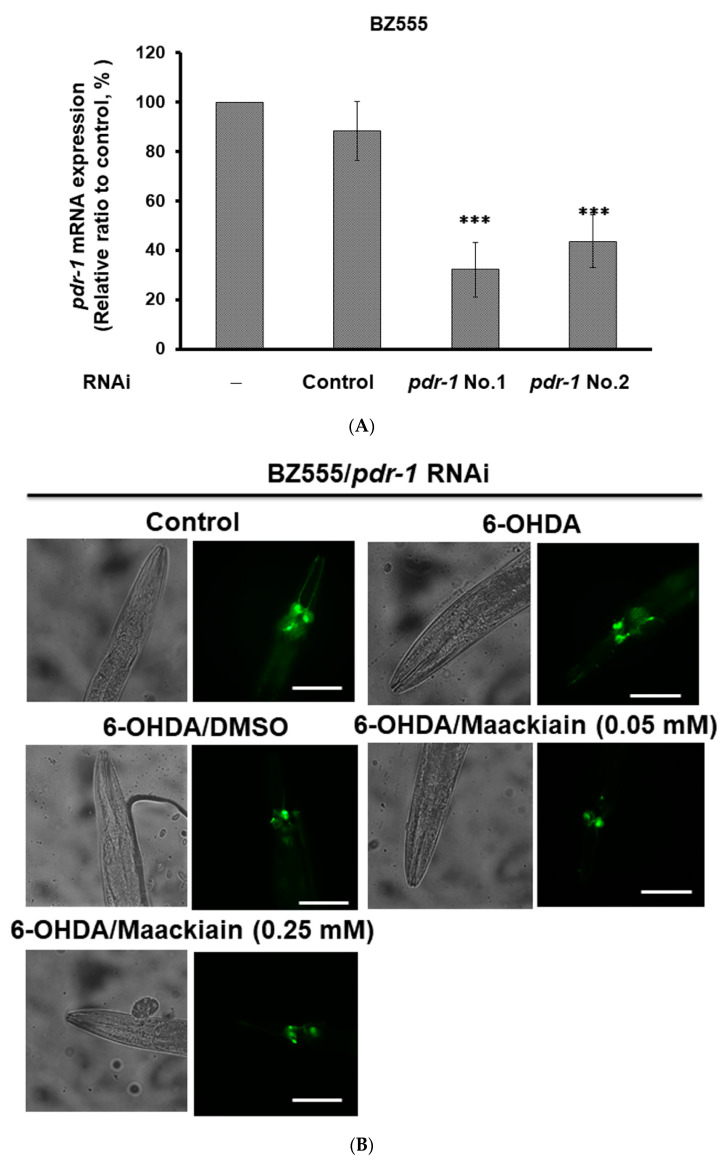
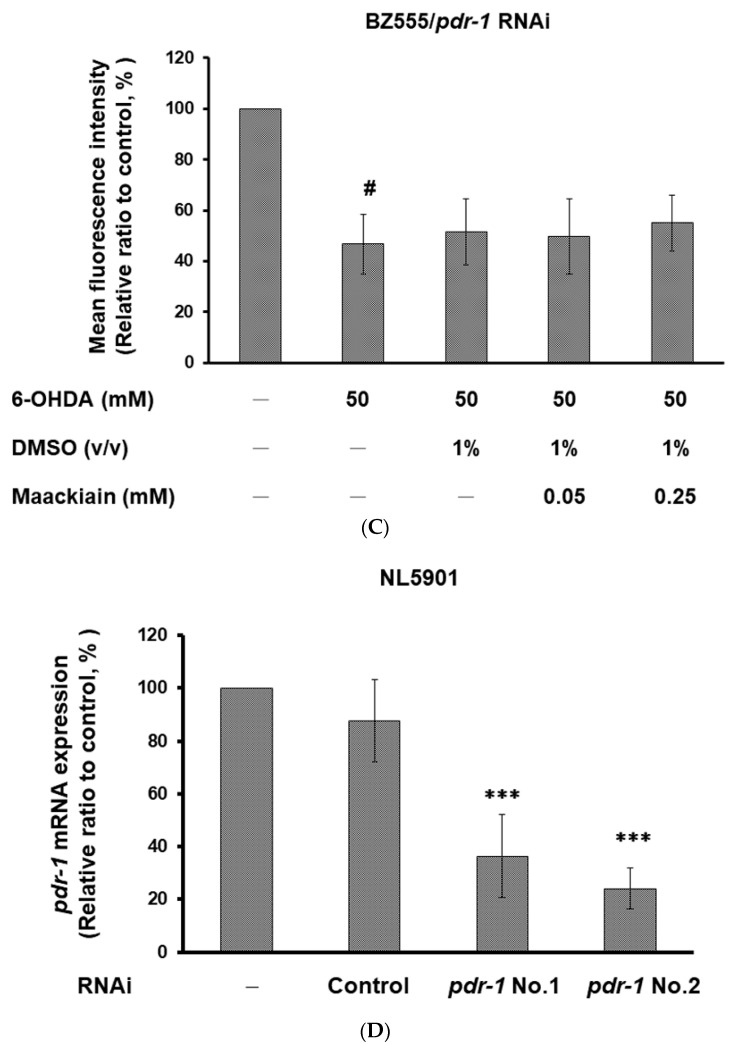
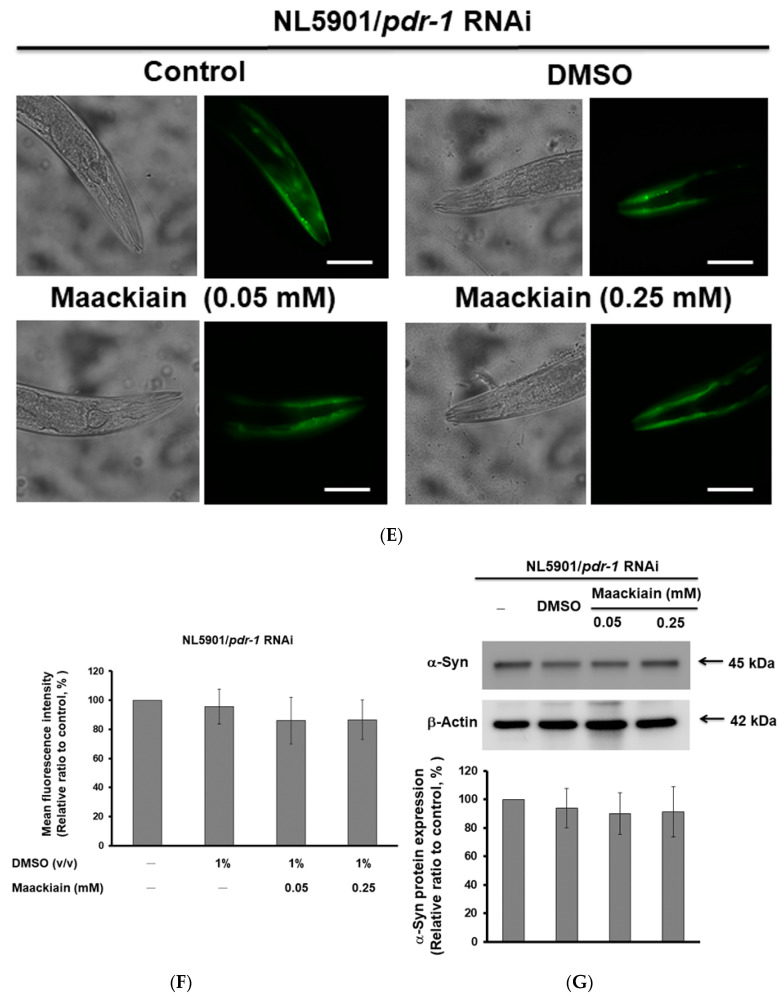
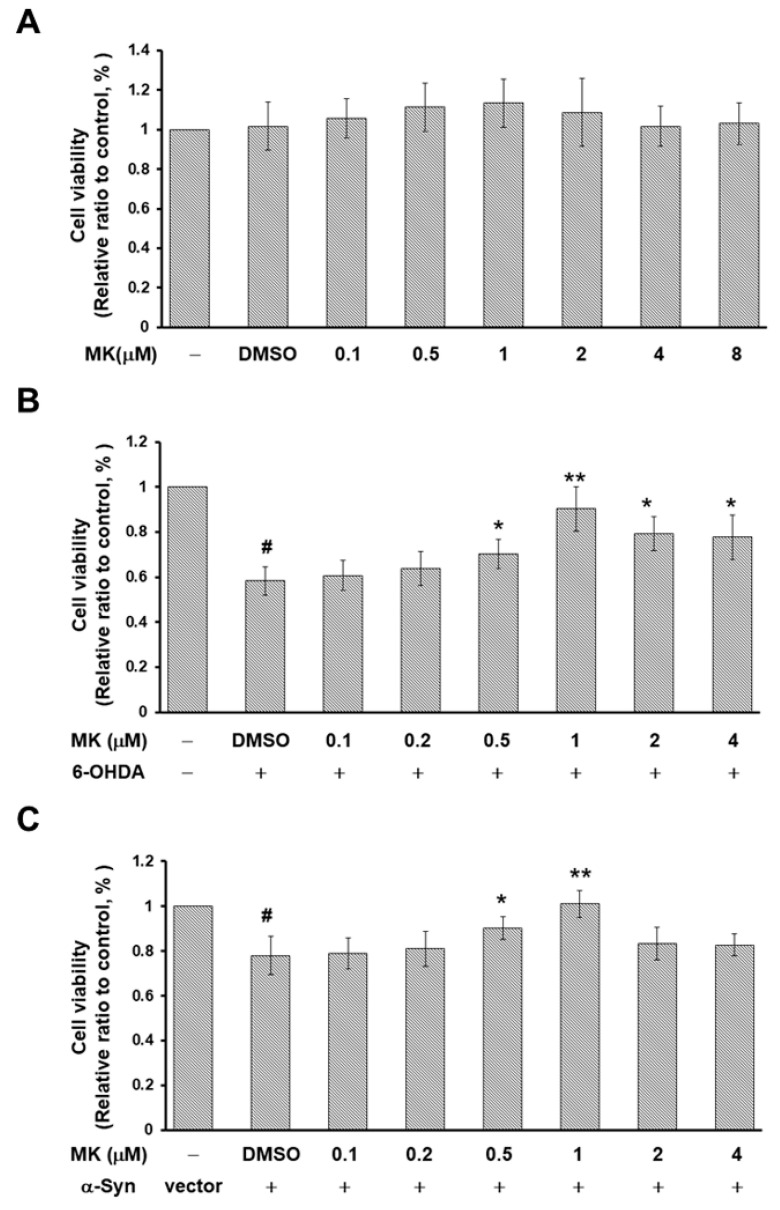
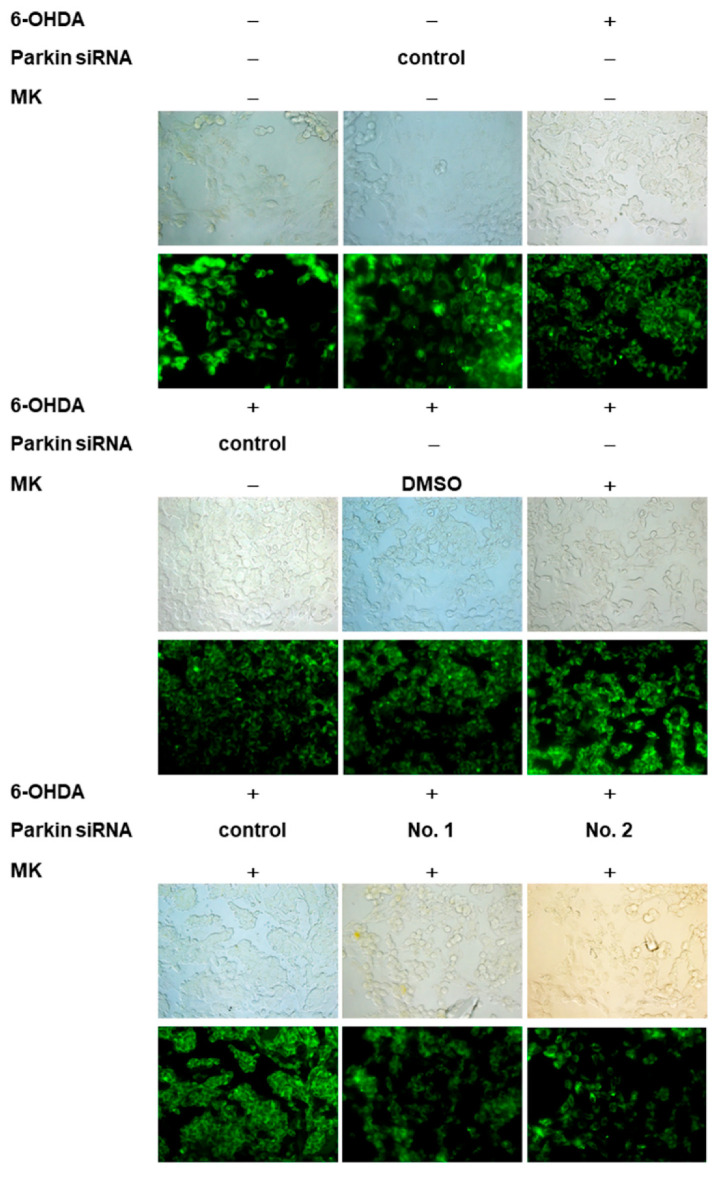
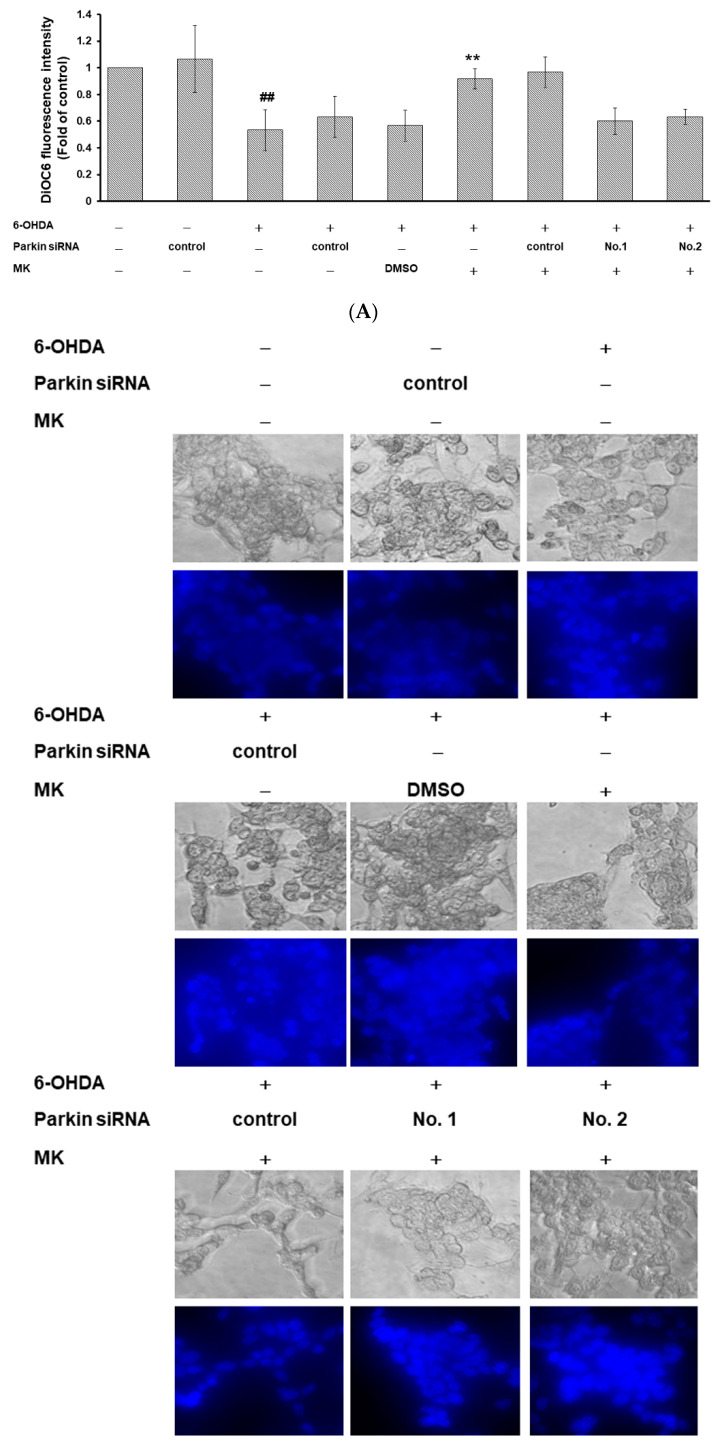
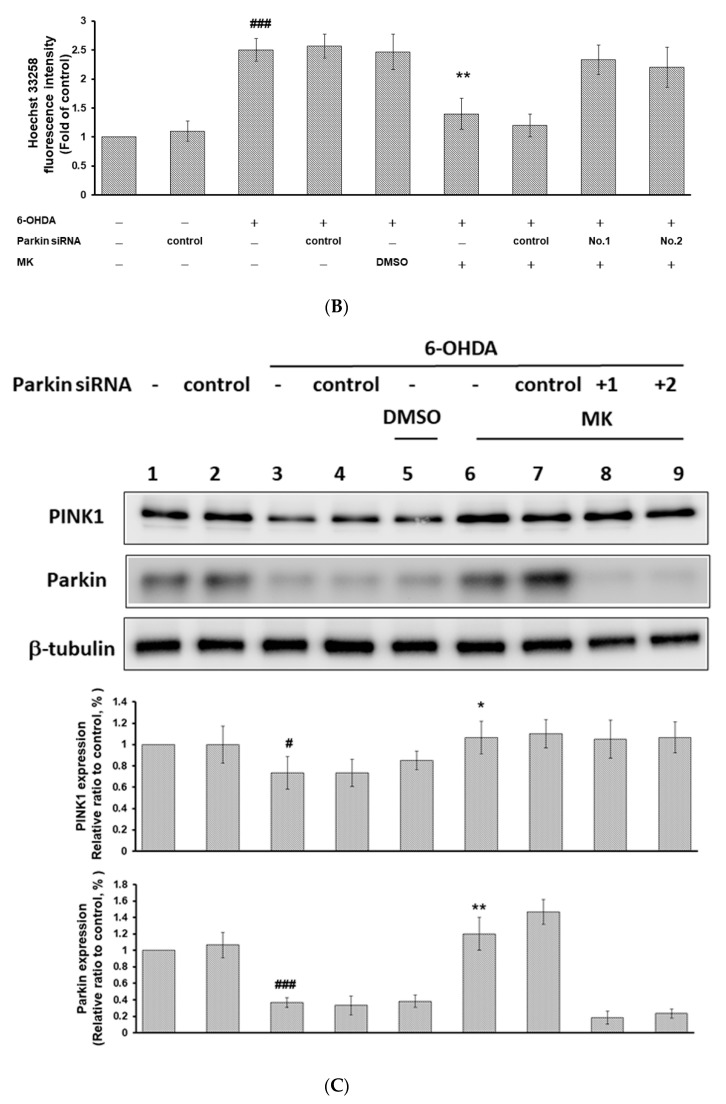
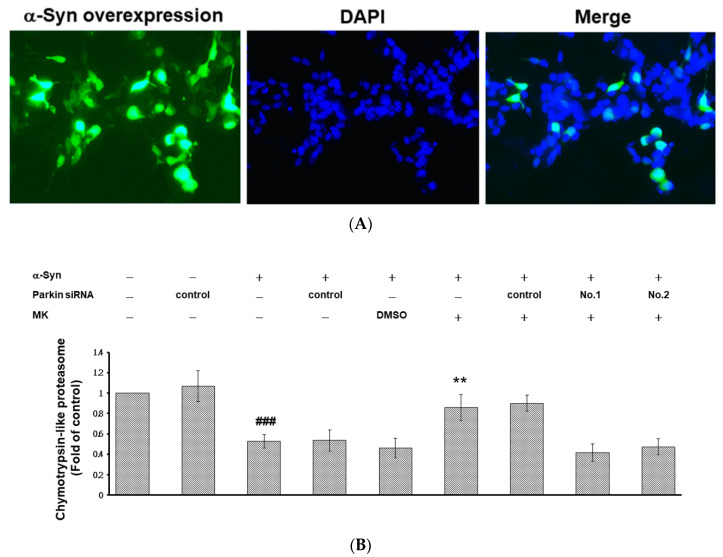
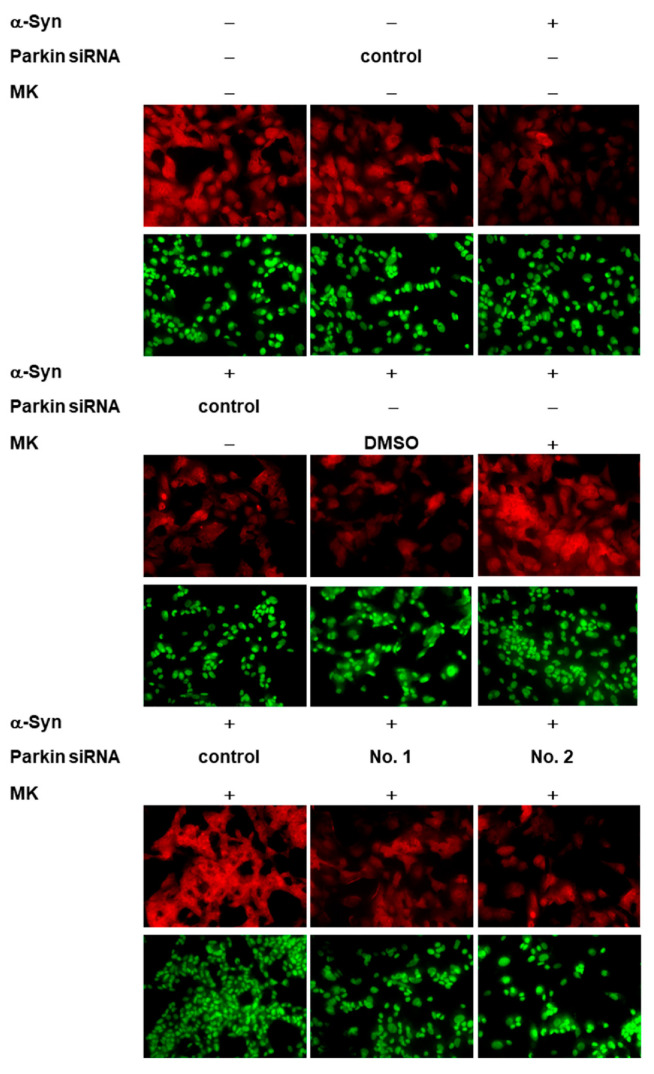
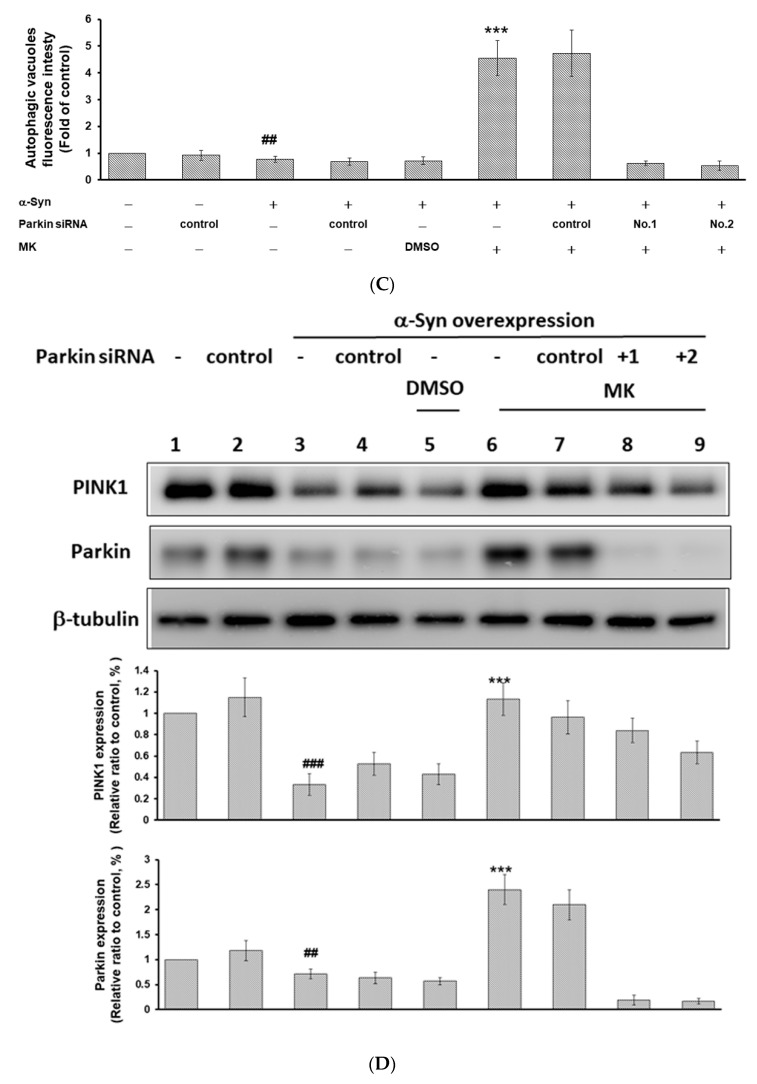
The movement disorder Parkinson's disease (PD) is the second most frequently diagnosed neurodegenerative disease, and is associated with aging, the environment, and genetic factors. The intracellular aggregation of α-synuclein and the loss of dopaminergic neurons in the substantia nigra pars compacta are the pathological hallmark of PD. At present, there is no successful treatment for PD. Maackiain (MK) is a flavonoid extracted from dried roots of Sophora flavescens Aiton. MK has emerged as a novel agent for PD treatment that acts by inhibiting monoamine oxidase B. In this study, we assessed the neuroprotective potential of MK in Caenorhabditis elegans and investigated possible mechanism of this neuroprotection in the human SH-SY5Y cell line. We found that MK significantly reduced dopaminergic neuron damage in 6-hydroxydopamine (6-OHDA)-exposed worms of the BZ555 strain, with corresponding improvements in food-sensing behavior and life-span. In transgenic worms of strain NL5901 treated with 0.25 mM MK, the accumulation of α-synuclein was diminished by 27% (p < 0.01) compared with that in untreated worms. Moreover, in worms and the SH-SY5Y cell line, we confirmed that the mechanism of MK-mediated protection against PD pathology may include blocking apoptosis, enhancing the ubiquitin-proteasome system, and augmenting autophagy by increasing PINK1/parkin expression. The use of small interfering RNA to downregulate parkin expression in vivo and in vitro could reverse the benefits of MK in PD models. MK may have considerable therapeutic applications in PD.

Keywords: 6-Hydroxydopamine; Caenorhabditis elegans; Parkinson’s disease; SH-SY5Y cell; apoptosis; autophagy; maackiain; parkin; proteasome; α-Synuclein.


Conflict of interest statement

The authors declare no conflict of interest.

Figures

Figure 1
Figure 1
Chemical structure of maackiain.
Figure 2
Figure 2
The concentration of maackiain (MK) used in the C. elegans model was determined by a food clearance test. In a 96-well plate, synchronized L1 worms of N2, BZ555, NL5901, and DA2123 strains were cultured with E. coli in OP50 (OD A595 = 0.6) feeding medium containing 0, 0.01, 0.05, 0.25 or 1.25 mM MK for 6 days. During this period, the OD value of each treatment was measured and recorded daily.
Figure 3
Figure 3
6-hydroxydopamine (6-OHDA)-induced degeneration of dopaminergic (DA) neurons, defects in food-sensing behavior, and shortening of life-span in the BZ555 strain were ameliorated by maackiain (MK) treatment. MK-pretreated or untreated L3 stage BZ555 worms were exposed to 6-OHDA and then cultured for an additional 3 days. (A) Representative fluorescence images of GFP expression in DA neurons. Scale bar = 50 µm. (B) Quantifying of GFP fluorescence intensity pattern in 50 animals per group using ImageJ software. (C) Degenerative phenotypic defects of DA neurons were scored for 50 animals per group. Data are presented as a percentage of the total population with abnormal phenotypes in each treatment group. (D) Slowing rates were calculated as the percentage lessening in frequency of body bending (20 s) in the bacterial lawn compared to without a bacterial lawn for 50 animals per group. (E) Cumulative survival curves for worms cultured in OP50/NGM plates until all worms died (50 animals per group). In the above experiments, # shows significant differences between 6-OHDA-exposed and control worms (# p < 0.001); * shows significant differences between the MK-pretreated 6-OHDA-exposed and MK-untreated 6-OHDA-exposed groups (* p < 0.05, ** p < 0.01).
Figure 3
Figure 3
6-hydroxydopamine (6-OHDA)-induced degeneration of dopaminergic (DA) neurons, defects in food-sensing behavior, and shortening of life-span in the BZ555 strain were ameliorated by maackiain (MK) treatment. MK-pretreated or untreated L3 stage BZ555 worms were exposed to 6-OHDA and then cultured for an additional 3 days. (A) Representative fluorescence images of GFP expression in DA neurons. Scale bar = 50 µm. (B) Quantifying of GFP fluorescence intensity pattern in 50 animals per group using ImageJ software. (C) Degenerative phenotypic defects of DA neurons were scored for 50 animals per group. Data are presented as a percentage of the total population with abnormal phenotypes in each treatment group. (D) Slowing rates were calculated as the percentage lessening in frequency of body bending (20 s) in the bacterial lawn compared to without a bacterial lawn for 50 animals per group. (E) Cumulative survival curves for worms cultured in OP50/NGM plates until all worms died (50 animals per group). In the above experiments, # shows significant differences between 6-OHDA-exposed and control worms (# p < 0.001); * shows significant differences between the MK-pretreated 6-OHDA-exposed and MK-untreated 6-OHDA-exposed groups (* p < 0.05, ** p < 0.01).
Figure 4
Figure 4
Accumulation of α-synuclein (α-Syn) was diminished by maackiain (MK) treatment in the NL5901 strain of C. elegans. L3 stage worms were treated with or without MK and cultured until the third day of adulthood. (A) The representative YFP fluorescence images of α-Syn accumulation in the muscles of the head region of worms. Scale bar = 50 µm. (B) ImageJ software was used to quantify YFP fluorescence intensity for 50 animals per group. (C) The protein level of α-Syn in the MK-treated and MK-untreated worms was determined by Western blotting. A representative result from one of three independent experiments is shown. The level of β-actin was used as an internal control for loading. The relative fold in α-Syn level is represented as the ratio of the MK-treated groups relative to the MK-untreated groups. In the above experiments, * shows significant differences between the MK-untreated and the MK-treated worms (* p < 0.05, ** p < 0.01).
Figure 5
Figure 5
Maackiain (MK) significantly diminished the intracellular reactive oxygen species (ROS) level and increased pink1 and pdr-1 expression in 6-hydroxydopamine (6-OHDA)-exposed N2 C. elegans. MK-pretreated or untreated L3 stage worms were exposed to 6-OHDA for 1 h and were then cultured in the NGM plate for 3 days. (A) Thirty randomly selected worms from each experimental group were transferred to the well of a 96-well plate. The intracellular ROS level was evaluated. # shows significant differences between 6-OHDA-exposed and control worms (# p < 0.01); * shows significant differences between the MK-untreated 6-OHDA-exposed worms and MK-pretreated 6-OHDA-exposed worms (** p < 0.01). (B) The expression level of PD-associated genes in C. elegans was quantified by qPCR. # shows significant differences between 6-OHDA-exposed and control worms (# p < 0.05); * shows significant differences between the MK-untreated 6-OHDA-exposed worms and MK-pretreated 6-OHDA-exposed worms (* p < 0.05, ** p < 0.01).
Figure 5
Figure 5
Maackiain (MK) significantly diminished the intracellular reactive oxygen species (ROS) level and increased pink1 and pdr-1 expression in 6-hydroxydopamine (6-OHDA)-exposed N2 C. elegans. MK-pretreated or untreated L3 stage worms were exposed to 6-OHDA for 1 h and were then cultured in the NGM plate for 3 days. (A) Thirty randomly selected worms from each experimental group were transferred to the well of a 96-well plate. The intracellular ROS level was evaluated. # shows significant differences between 6-OHDA-exposed and control worms (# p < 0.01); * shows significant differences between the MK-untreated 6-OHDA-exposed worms and MK-pretreated 6-OHDA-exposed worms (** p < 0.01). (B) The expression level of PD-associated genes in C. elegans was quantified by qPCR. # shows significant differences between 6-OHDA-exposed and control worms (# p < 0.05); * shows significant differences between the MK-untreated 6-OHDA-exposed worms and MK-pretreated 6-OHDA-exposed worms (* p < 0.05, ** p < 0.01).
Figure 6
Figure 6
Maackiain (MK) treatment enhanced proteasome and autophagy activity and increased pdr-1 expression in the transgenic C. elegans models. L3 stage worms of the NL5901 or DA2123 strain were treated with or without MK and cultured until the third day of adulthood. (A) The activity of the proteasome was monitored in the extract of NL5901 worms from different groups containing equal amounts of total protein. # shows significant differences between N2 and NL5901 worms (p < 0.01); * shows significant differences between the MK-untreated and MK-treated worms (** p < 0.01). (B) Representative GFP fluorescence images of positive puncta in lateral hypodermal seam cells of DA2123 worms are displayed. Scale bar = 10 µm. (C) The number of positive puncta was counted in the lateral epidermal seam cell of DA2123 worms. At least 50 worms were counted in each experimental group, and at least 100 seam cells were counted for each worm. * shows significant differences between MK-untreated and MK-treated worms (* p < 0.05, ** p < 0.01). (D) The expression level of the PD-associated genes was quantified by qPCR in NL5901 worms. # shows significant differences between N2 and NL5901 worms (p < 0.05); * shows significant differences between the MK-untreated and MK-treated NL5901 worms (* p < 0.05, ** p < 0.01).
Figure 6
Figure 6
Maackiain (MK) treatment enhanced proteasome and autophagy activity and increased pdr-1 expression in the transgenic C. elegans models. L3 stage worms of the NL5901 or DA2123 strain were treated with or without MK and cultured until the third day of adulthood. (A) The activity of the proteasome was monitored in the extract of NL5901 worms from different groups containing equal amounts of total protein. # shows significant differences between N2 and NL5901 worms (p < 0.01); * shows significant differences between the MK-untreated and MK-treated worms (** p < 0.01). (B) Representative GFP fluorescence images of positive puncta in lateral hypodermal seam cells of DA2123 worms are displayed. Scale bar = 10 µm. (C) The number of positive puncta was counted in the lateral epidermal seam cell of DA2123 worms. At least 50 worms were counted in each experimental group, and at least 100 seam cells were counted for each worm. * shows significant differences between MK-untreated and MK-treated worms (* p < 0.05, ** p < 0.01). (D) The expression level of the PD-associated genes was quantified by qPCR in NL5901 worms. # shows significant differences between N2 and NL5901 worms (p < 0.05); * shows significant differences between the MK-untreated and MK-treated NL5901 worms (* p < 0.05, ** p < 0.01).
Figure 7
Figure 7
Using RNA interference (RNAi) approaches to downregulate the expression of pdr-1 lessened the ability of maackiain (MK) to ameliorate the pathology of Parkinson’s disease (PD) in C. elegans models. (A) Pdr-1 RNAi of BZ555 worms was performed by the method of feeding with bacteria expressing dsRNA. The mRNA level of pdr-1 was measured by qPCR. The expression of β-actin was used as an internal control. * shows significant differences between the control RNAi-treated and prd-1 RNAi-treated worms (*** p < 0.001). (B) Representative GFP fluorescence images of DA neurons are shown from different experimental groups. Scale bar = 50 µm. (C) ImageJ software was used to quantify the GFP fluorescence intensity of DA neurons from different groups. Comparisons are between the MK-untreated 6-OHDA-exposed and MK-pretreated 6-OHDA-exposed group. # shows significant differences between 6-OHDA-exposed and control worms (# p < 0.001) (D) Pdr-1 RNAi of NL5901 worms was performed by the method of feeding with bacteria expressing dsRNA. The mRNA level of pdr-1 was evaluated by qPCR. The expression of β-actin was used as an internal control. * shows significant differences between the control RNAi and pdr-1 RNAi-treated worms (*** p < 0.001). (E) Representative YFP fluorescence images of α-synuclein (α-Syn) accumulation of muscle cells in the head region are shown from different groups of the NL5901 strain. Scale bar = 50 µm. (F) ImageJ software was used to quantify the YFP fluorescence intensity from different groups of the NL5901 strain. Comparisons are between the MK-untreated and MK-treated worms. (G) Western blotting analysis was used to quantify the protein level of α-Syn from different groups of the NL5901 strain. One representative result is shown. The expression of β-actin was used as an internal control. The relative fold protein level is represented as the ratio of the MK-treated worms relative to the MK-untreated worms.
Figure 7
Figure 7
Using RNA interference (RNAi) approaches to downregulate the expression of pdr-1 lessened the ability of maackiain (MK) to ameliorate the pathology of Parkinson’s disease (PD) in C. elegans models. (A) Pdr-1 RNAi of BZ555 worms was performed by the method of feeding with bacteria expressing dsRNA. The mRNA level of pdr-1 was measured by qPCR. The expression of β-actin was used as an internal control. * shows significant differences between the control RNAi-treated and prd-1 RNAi-treated worms (*** p < 0.001). (B) Representative GFP fluorescence images of DA neurons are shown from different experimental groups. Scale bar = 50 µm. (C) ImageJ software was used to quantify the GFP fluorescence intensity of DA neurons from different groups. Comparisons are between the MK-untreated 6-OHDA-exposed and MK-pretreated 6-OHDA-exposed group. # shows significant differences between 6-OHDA-exposed and control worms (# p < 0.001) (D) Pdr-1 RNAi of NL5901 worms was performed by the method of feeding with bacteria expressing dsRNA. The mRNA level of pdr-1 was evaluated by qPCR. The expression of β-actin was used as an internal control. * shows significant differences between the control RNAi and pdr-1 RNAi-treated worms (*** p < 0.001). (E) Representative YFP fluorescence images of α-synuclein (α-Syn) accumulation of muscle cells in the head region are shown from different groups of the NL5901 strain. Scale bar = 50 µm. (F) ImageJ software was used to quantify the YFP fluorescence intensity from different groups of the NL5901 strain. Comparisons are between the MK-untreated and MK-treated worms. (G) Western blotting analysis was used to quantify the protein level of α-Syn from different groups of the NL5901 strain. One representative result is shown. The expression of β-actin was used as an internal control. The relative fold protein level is represented as the ratio of the MK-treated worms relative to the MK-untreated worms.
Figure 8
Figure 8
Protective effect of maackiain (MK) against 6-hydroxydopamine (6-OHDA) and α-synuclein (α-Syn)-induced toxicity in SH-SY5Y cell line. (A) Cell viability was measured by the 3-(4,5-dimethylthiazol-2-yl)2,5-diphenyltetrazolim bromide (MTT) assay. Cells were pretreated with 0.1, 0.5, 1, 2, 4, or 8 μM MK for 24 h. (B) Cell viability was measured by MTT assay. Cells were pretreated with 0.1, 0.2, 0.5, 1, 2, or 4 μM MK for 24 h and were then exposed with 100 μM 6-OHDA for an additional 24 h. # shows significant differences between 6-OHDA-exposed and control cells (# p < 0.001); * shows significant differences between the MK-pretreated 6-OHDA-exposed and MK-untreated 6-OHDA-exposed cells (* p < 0.05, ** p < 0.01). (C) α-Syn-overexpressing cell viability was measured by MTT assay. α-Syn-overexpressing cells were pretreated with 0.1, 0.2, 0.5, 1, 2, or 4 μM MK for 24 h. # shows significant differences between α-Syn-overexpressing and control cells (# p < 0.01); * shows significant differences between the α-Syn-overexpressing MK-pretreated and α-Syn-overexpressing MK-untreated groups (* p < 0.05, ** p < 0.01).
Figure 9
Figure 9
Parkin-siRNA reversed the anti-apoptotic effect of maackiain (MK) in the 6-hydroxydopamine (6-OHDA)-exposed SH-SY5Y cell line. SH-SY5Y cells were transfected with control siRNA or parkin-siRNA for 24 h. Transfected cells were incubated with 1 μM MK for 24 h and then exposed to 100 μM 6-OHDA for 18 h. (A) The loss in mitochondrial membrane potential (MMP) was observed by using DiOC6 dye (1 μM). Top, representative phase contrast images and fluorescent images; bottom, the fluorescence intensity of DiOC6 was analyzed by using ImageJ. The relative fold fluorescence intensity is represented as the ratio relative to the control experiment. (B) Nuclear condensation was observed by using Hoechst 33258 staining. Top, representative phase contrast images and fluorescent images; bottom, the fluorescence intensity of Hoechst 33258 (5 μg/mL) was analyzed by using ImageJ. The relative fold fluorescence intensity is represented as the ratio relative to the control experiment. (C) Western blotting analysis was used to quantify the protein level of PINK1 and parkin. One representative result is shown. The expression of β-tubulin was used as an internal control. The relative fold protein level is represented as the ratio relative to the control experiment. In the above experiments, # shows significant differences between 6-OHDA-exposed and control groups (# p < 0.05, ## p < 0.01, ### p < 0.001); * shows significant differences between the MK-pretreated 6-OHDA-exposed and MK-untreated 6-OHDA-exposed groups (* p < 0.05, ** p < 0.01).
Figure 9
Figure 9
Parkin-siRNA reversed the anti-apoptotic effect of maackiain (MK) in the 6-hydroxydopamine (6-OHDA)-exposed SH-SY5Y cell line. SH-SY5Y cells were transfected with control siRNA or parkin-siRNA for 24 h. Transfected cells were incubated with 1 μM MK for 24 h and then exposed to 100 μM 6-OHDA for 18 h. (A) The loss in mitochondrial membrane potential (MMP) was observed by using DiOC6 dye (1 μM). Top, representative phase contrast images and fluorescent images; bottom, the fluorescence intensity of DiOC6 was analyzed by using ImageJ. The relative fold fluorescence intensity is represented as the ratio relative to the control experiment. (B) Nuclear condensation was observed by using Hoechst 33258 staining. Top, representative phase contrast images and fluorescent images; bottom, the fluorescence intensity of Hoechst 33258 (5 μg/mL) was analyzed by using ImageJ. The relative fold fluorescence intensity is represented as the ratio relative to the control experiment. (C) Western blotting analysis was used to quantify the protein level of PINK1 and parkin. One representative result is shown. The expression of β-tubulin was used as an internal control. The relative fold protein level is represented as the ratio relative to the control experiment. In the above experiments, # shows significant differences between 6-OHDA-exposed and control groups (# p < 0.05, ## p < 0.01, ### p < 0.001); * shows significant differences between the MK-pretreated 6-OHDA-exposed and MK-untreated 6-OHDA-exposed groups (* p < 0.05, ** p < 0.01).
Figure 10
Figure 10
Parkin-siRNA reversed the clearance ability of maackiain (MK) in the α-synuclein (α-Syn)-overexpressing SH-SY5Y cell line. α-Syn-overexpressing SH-SY5Y cells were transfected with control siRNA or parkin-siRNA for 24 h. Transfected Cells were incubated with 1 μM MK for 24 h. (A) A representative fluorescence image of α-Syn-overexpressing SH-SY5Y Cells. Recombinant α-Syn was detected by Myc antibody (Green). Hoechst 33258 was used as a marker of nuclear morphology (blue). (B) Suc-Leu-Leu-Val-Tyr-AMC was used as a substrate to measure proteasome activity. The relative fold proteasome activity is represented as the ratio relative to the control experiment. (C) Autophagic vacuoles were observed by using acidic vesicular organelle (AVO) staining. Top, representative phase contrast images and fluorescent images; bottom, the fluorescence intensity of acridine orange (0.5 μg/mL) was analyzed by using ImageJ. The relative fold fluorescence intensity is represented as the ratio relative to the control experiment. (D) Western blotting analysis was used to quantify the protein level of PINK1 and parkin. One representative result is shown. The expression of β-tubulin was used as an internal control. The relative fold protein level is represented as the ratio relative to the control experiment. In the above experiments, # shows significant differences between α-Syn-overexpressing and control (## p < 0.01, ### p < 0.001); * shows significant differences between the MK-treated α-Syn-overexpressing and MK-untreated α-Syn-overexpressing experiments (** p < 0.01, *** p < 0.001).
Figure 10
Figure 10
Parkin-siRNA reversed the clearance ability of maackiain (MK) in the α-synuclein (α-Syn)-overexpressing SH-SY5Y cell line. α-Syn-overexpressing SH-SY5Y cells were transfected with control siRNA or parkin-siRNA for 24 h. Transfected Cells were incubated with 1 μM MK for 24 h. (A) A representative fluorescence image of α-Syn-overexpressing SH-SY5Y Cells. Recombinant α-Syn was detected by Myc antibody (Green). Hoechst 33258 was used as a marker of nuclear morphology (blue). (B) Suc-Leu-Leu-Val-Tyr-AMC was used as a substrate to measure proteasome activity. The relative fold proteasome activity is represented as the ratio relative to the control experiment. (C) Autophagic vacuoles were observed by using acidic vesicular organelle (AVO) staining. Top, representative phase contrast images and fluorescent images; bottom, the fluorescence intensity of acridine orange (0.5 μg/mL) was analyzed by using ImageJ. The relative fold fluorescence intensity is represented as the ratio relative to the control experiment. (D) Western blotting analysis was used to quantify the protein level of PINK1 and parkin. One representative result is shown. The expression of β-tubulin was used as an internal control. The relative fold protein level is represented as the ratio relative to the control experiment. In the above experiments, # shows significant differences between α-Syn-overexpressing and control (## p < 0.01, ### p < 0.001); * shows significant differences between the MK-treated α-Syn-overexpressing and MK-untreated α-Syn-overexpressing experiments (** p < 0.01, *** p < 0.001).

Similar articles

Cited by

References

    1. Calabrese V., Santoro A., Monti D., Crupi R., Di Paola R., Latteri S., Cuzzocrea S., Zappia M., Giordano J., Calabrese E.J., et al. Aging and Parkinson’s Disease: Inflammaging, neuroinflammation and biological remodeling as key factors in pathogenesis. Free. Radic. Biol. Med. 2018;115:80–91. doi: 10.1016/j.freeradbiomed.2017.10.379. - DOI - PubMed
    1. Bouca-Machado R., Duarte G.S., Patriarca M., Castro Caldas A., Alarcao J., Fernandes R.M., Mestre T.A., Matias R., Ferreira J.J. Measurement Instruments to Assess Functional Mobility in Parkinson’s Disease: A Systematic Review. Mov. Disord. Clin. Pract. 2020;7:129–139. doi: 10.1002/mdc3.12874. - DOI - PMC - PubMed
    1. Marras C., Beck J.C., Bower J.H., Roberts E., Ritz B., Ross G.W., Abbott R.D., Savica R., Van Den Eeden S.K., Willis A.W., et al. Prevalence of Parkinson’s disease across North America. NPJ Parkinsons Dis. 2018;4:21. doi: 10.1038/s41531-018-0058-0. - DOI - PMC - PubMed
    1. Borrageiro G., Haylett W., Seedat S., Kuivaniemi H., Bardien S. A review of genome-wide transcriptomics studies in Parkinson’s disease. Eur. J. Neurosci. 2018;47:1–16. doi: 10.1111/ejn.13760. - DOI - PubMed
    1. Lionnet A., Leclair-Visonneau L., Neunlist M., Murayama S., Takao M., Adler C.H., Derkinderen P., Beach T.G. Does Parkinson’s disease start in the gut? Acta Neuropathol. 2018;135:1–12. doi: 10.1007/s00401-017-1777-8. - DOI - PubMed

MeSH terms