Review
. 2020 Jun 23;9(6):1528.
doi: 10.3390/cells9061528.

A Single-Neuron: Current Trends and Future Prospects

Affiliations
Review

A Single-Neuron: Current Trends and Future Prospects

Pallavi Gupta et al. Cells. .

Abstract

The brain is an intricate network with complex organizational principles facilitating a concerted communication between single-neurons, distinct neuron populations, and remote brain areas. The communication, technically referred to as connectivity, between single-neurons, is the center of many investigations aimed at elucidating pathophysiology, anatomical differences, and structural and functional features. In comparison with bulk analysis, single-neuron analysis can provide precise information about neurons or even sub-neuron level electrophysiology, anatomical differences, pathophysiology, structural and functional features, in addition to their communications with other neurons, and can promote essential information to understand the brain and its activity. This review highlights various single-neuron models and their behaviors, followed by different analysis methods. Again, to elucidate cellular dynamics in terms of electrophysiology at the single-neuron level, we emphasize in detail the role of single-neuron mapping and electrophysiological recording. We also elaborate on the recent development of single-neuron isolation, manipulation, and therapeutic progress using advanced micro/nanofluidic devices, as well as microinjection, electroporation, microelectrode array, optical transfection, optogenetic techniques. Further, the development in the field of artificial intelligence in relation to single-neurons is highlighted. The review concludes with between limitations and future prospects of single-neuron analyses.

Keywords: artificial intelligence; electrophysiological recording; isolation; mapping; micro/nanofluidic devices; microelectrode array; single-neuron models; therapy; transfection.


Conflict of interest statement

The authors declare no conflict of interest.

Figures

Figure 1
Figure 1
Model for neural responses and decoding: (a) tuning curves f(s) showing the mean neural responses to a stimulus s (thin lines), curve from the von Mises functions (thick curves) model with parameters including the preferred stimulus sk (dots). (b) The relationship of two neurons generalizing to high-dimensional response spaces under varying stimulus s. (c) Linear decoding projects the neural responses, both noise and signal, towards a specific direction w for the estimation of ŝ of the stimulus. (d) The phenomenon of showing neurons having similar tuning has higher correlated fluctuations. Noise correlation coefficients Rij between distinct neurons i and j are modeled as being proportional on average to the signal correlations Rijsig, with proportionality c0. (e) Two components to the noise covariance Σ: information-limiting correlations are distinguished; present along the signal direction f′ and therefore show covariance εf′f′T (front, matrix boxed in red), and the remaining noise with covariance Σ0 (back, the matrix in the green box). The two types of noise show distinctive structures; apparent in the covariance matrices. The striations in the matrices correspond to the heterogeneous tuning curve amplitudes. Reprinted with permission from the authors of [50].
Figure 2
Figure 2
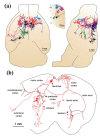
Complete reconstruction of axonal morphology. (a) Complete reconstruction of the five projection neurons, superimposed on a horizontal (left) and sagittal (right) position while imaging the mouse brain. The subset comprises pyramidal neurons in layer II (blue, purple), layer V (red, black), and layer VI (green). (b) Axonal and dendritic reconstruction of the layer, five pyramidal cells (colored red in (a) presented in the coronal plane. The black dashed line depicts the profile of the coronal section at the rostrocaudal position of the cell body. Colored segments highlight axonal arbors initiating from common branch points. Reprinted with the permission of the authors of [63].
Figure 3
Figure 3
Multiplexed Analysis of Projections by Sequencing (MAPseq) procedure for mapping single-neuron projections. (A) Various underlying projection patterns develop identical bulk mapping. (B) Random labeling of single neurons with barcodes. (C) The expected fraction of uniquely labeled cells is given by F = (1-1/N)(k-1), where N is the number of barcodes and k is the number of infected cells, assuming a uniform distribution of barcodes. (A1, primary auditory cortex; Ctx, neocortex). (D) In MAPseq, neurons are infected at low MOI with a barcoded virus library. Barcode mRNA is expressed, trafficked, and can be extracted from distal sites as a measure of single-neuron projections. Reprinted with the permission from [61].
Figure 4
Figure 4
Axonal arbor for three cortical projection neurons of layer five of the motor cortex collapsed in the sagittal plane (a) and coronal plane (b). Intratelencephalic neurons shown in yellow and green color are projected to other cortical areas and the striatum with a higher level of projection heterogeneity. Pyramidal tract neurons (red) are connecting the motor cortex with hindbrain and midbrain. Reconstructions are retrieved from MouseLight Neuron Browser [76]. Total axonal lengths of shown neurons are 44.7, 30.1 and 13.4 cm for yellow (ID: AA0100), blue (ID: AA0267), and red (ID: AA0180), respectively. Reprinted with the permission of [75].
Figure 5
Figure 5
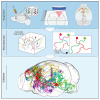
Schematic representation of 1000 projection neurons reconstruction deciphering new cell types and long-range connectivity organization present in mouse brain. Reprinted with the permission of [77].
Figure 6
Figure 6
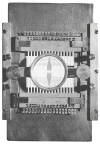
The microelectrode array consists of 36 photoetched microelectrodes with electrode holders, culture ring, and contact strips to study the single-unit neuronal activity. Reprinted with the permission of [81].
Figure 7
Figure 7
(a) Electrophysiological platform integrated with a complementary metal–oxide–semiconductor (CMOS) microelectrode array chip, the interface board, and a workstation. (b) Immunofluorescence imaging of single-neurons on the chip and the electrophysiological activity of three selected neurons. Reproduced from [83] with the permission of the Royal Society of Chemistry.
Figure 8
Figure 8
(a) Position of multielectrode array (MEA) on the mouse brain and the cranial window. (b) Implantation of the MEA in the mouse brain. (c) Epifluorescence of the brain and the surrounding areas. (d) Simultaneous electrophysiological recording, arousal, and two-photon imaging with single-neuron Ca++ activity. Reprinted with the permission of [98].
Figure 9
Figure 9
Testing of viral spread in the pre- and post-synaptic cells. (a) Image of the slice and recording pipettes with cells. (b) Merger of the fluorescent image. (c) Transfected cell with viral spread. (d) Transfected cell with TVA (cellular receptor for subgroup A avian leukosis viruses (ALV-A)) and rabies-virus glycoprotein (e) coinciding postsynaptic currents and action potentials in the cell with a monosynaptic connection. Reprinted with the permission of [107].
Figure 10
Figure 10
CRISPR/Cas9 (Clustered regularly interspaced short palindromic repeats- associated protein 9) -induced disruption of green fluorescence protein (GFP) expression in the daughter cells of single microinjected aRGCs in organotypic slices of the telencephalon of Tis21::GFP mouse embryos. (a) Scheme of the Cas9/gRNA complex microinjection. (b) Reconstruction of optical sections with maximum intensity projections for daughter cells of single aRGCs microinjected with either Cas9/control gRNA (top) or Cas9/gGFP (bottom) revealed by Dx-A555 immunofluorescence (magenta); cell 1, aRGC daughter; cell 2, BP daughter. Dashed lines depict ventricular surface. Scale bars, 20 μm. (c) Single optical sections of cells 1 and 2 shown in (b), showing the effects of Cas9 and control gRNA (top) or gGFP (bottom) on GFP expression. Scale bars, 5 μm. (d) Quantification of the proportion of daughter cells (Dx-A555+) of microinjected cells showing GFP expression 24 h after control (Con, white) or gGFP (black) microinjection. (* p < 0.05, Fisher’s test) Reprinted with the permission of [147].
Figure 11
Figure 11
Cortical neurons expressing brain-derived neurotrophic factor (BDNF): (a) with green fluorescence protein after 24 h of delivery; (b) stained with anti-BDNF antibody; (c) merge image of both green fluorescence protein and anti-BDNF antibody. Reprinted with permission from [148].
Figure 12
Figure 12
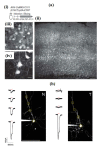
Microinjectrode system and its application. Briefly, a thin microelectrode passes through a 32 G cannula (OD: 236 m) which is connected to a T-junction via a ferrule. The electrode goes into a T-junction and a polyimide-coated glass tube with the terminal soldered to a gold pin. The polyimide tubing, gold pin, and ferrule are all pasted together. The middle part shows cross-sections through different parts of microinjectrode, i.e., the top ferrule, middle T-junction and bottom the cannula. An enlarged view of the microelectrode and cannula tips shows their relative position and size. A sample experiment is also displayed with single-neuron recording, electrical microstimulation and microinjection being performed in the frontal eye field (FEF). The single-neuron waveforms (black traces) segregated from background (gray traces) are also presented. Reprinted with the permission of [149].
Figure 13
Figure 13
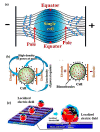
(a) Schematic showing distribution of electric field facilitating single-cell electroporation (SCEP); the induced transmembrane potential is found to be highest at the cell pole and decreases towards the equator. (b) Microfluidic SCEP with cell trapping. Reprinted with permission from [154]. (c) Localized SCEP with electric field (b) membrane area dependent density of pore formation and distribution due to non-uniform electric field application (c) nano-localized single-cell nano-electroporation. Reprinted with permission from [156].
Figure 14
Figure 14
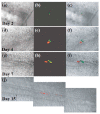
(aj) Cell transfection is shown with cytoplasmic DsRed2-N1 and nuclear green fluorescent protein plasmids (b,c). The merged fluorescence and differential interference contrast (DIC) images after 2 days of amputation depict both the cells in the spinal cord with a distance of approximately 250–300 µm from the amputation plane (c). In the next 2 days, the cells undergo division and recruitment to the regenerating spinal cord (e,f). (The panels show only regenerating tissue.) The cell division continues and spinal cord growth continues rapidly (gj). (j) A composite image of DIC images merged with the fluorescent image (15 days). Here, the initial two cells give rise to approximately ten cells on both the dorsal and ventral sides of the midportion of the developing spinal cord. The cell group is present over 560 µm length along the anterior/posterior axis. The original amputation plane is depicted by an arrow sign. Scale bar 100 µm in (j) (applicable to aj). Reprinted with permission from [124].
Figure 15
Figure 15
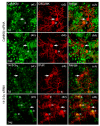
Immunostaining images of single-cell electroporated Purkinje cells small interfering RNA (siRNA) against calcium/calmodulin-dependent protein kinase ß (CaMKIIß) or 14-3-3η). SCEP was done at 11 days in vitro (DIV). The cell fixation was performed on day 7 (a,c) or day 14 (b,d) post electroporation (18 or 25 DIV, respectively) and double fluorescent immunostaining against CaMKIIß (green in a,b) and calbindin-D-28 K (CBD28K) (red in a,b) or 14-3-3η (green in c,d) and IP3R (red in c,d) was performed. Therefore, 1, 2 and 3 correspond to green, red and merged stains respectively. CaMKIIß or 14-3-3η signals decreased in electroporated Purkinje cells (arrows), but not in nearby non-electroporated Purkinje cells (asterisks). It is noteworthy that CaMKIIß and 14-3-3η expression was present for both Purkinje cells and granule cells. Scale: 20 µm. Reprinted with permission from [168].
Figure 16
Figure 16
Optical transfection system using femtosecond laser (a) Schematic of the optical transfection system. (b) Side view of the Petri dish containing a single-neuron for transfection. (c) Irradiation patterns (red dots) superimposed on phase-contrast images of cortical neurons. Reprinted with permission from [175].
Figure 17
Figure 17
(a) Two-photon activates of individual neurons present in mouse brain slices with C1V1T. (i) The experimental scheme shows the opsin C1V1T and EYFP genes encoded by Adeno-associated virus (AAV) are inserted in the somatosensory cortex of the mouse. Brain slices were prepared at a designated time point from the infected region. (ii) Two-photon fluorescence image of a living cortical brain slice expressing EYFP (940-nm excitation, 15 mW on the sample, 25×/1.05-NA objective; scale bar, 100 μm). (iii, iv) Magnified images from (b) show cells with C1V1T-expression present in higher (iii) and lower (iv) layers (scale bars, 20 μm (iii), and 10 μm (iv) Reprinted with permission from [180]. (b) Illustrative two-photon highest intensity projections of Alexa 594 fluorescence and current responses against a single 150 ms temporal focusing (TF) stimulation pulse (red bar) for patched and dye-filled pyramidal cells present in acute slices expressing targeted (T) and nontargeted (N) ChR2. Scale bar = 100 mm. Reprinted with permission from [181].
Figure 18
Figure 18
Schematic showing a microelectrode device fabricated by photolithography with microwells and microchannels on a planar multielectrode array, in which neurons were individually positioned in microwells, view from top (a) and side (b). Redrawn from [188].
Figure 19
Figure 19
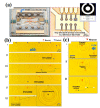
(a) The geometry of the microfluidic device on the microelectrode array. (b) Image of the packaged chip with the device on the top. (c) Magnified image of the electrodes and the channels; channels are highlighted with red, and the scale bar is 10 µm. (d) Cross-section of chip depicted with dimensions. (e) The images of the channels are highlighted in red; the scale bar is 20 µm. (f) The device with a small chamber and channels with an array marked inside the black box. Reprinted with permission from [193].
Figure 20
Figure 20
(a) Image of the microfabricated device and bright-field microscopic image of the electrode array. (b) Recorded images of single-neuronal cell manipulation on the array of ring-shaped traps. Incoming neuron (I) entering the 1st trap. (II) The neuron gets immobilized in the 1st trap electrode against a fluid flow. (III) When a neuron is trapped, the repelled particle keeps on moving in the flow of media. (IV) The released neuron gets trapped in the 2nd trap. (V and VI) The neuron is trapped in the 3rd and the 4th ring trap in turn. (c) The images show bouncing motion of the neuron subjected to a repulsive force. When the target neuron gets trapped in the desired electrode, the incoming neuron faces repulsion due to DEP force. At the end, when the incoming neuron reaches the outside of the electrode, the repulsive force pushed the neuron out of the ring. Reprinted with permission from [58].

Similar articles

Cited by

References

    1. Herculano-Houzel S. The human brain in numbers: A linearly scaled-up primate brain. Front. Hum. Neurosci. 2009;3:1–11. doi: 10.3389/neuro.09.031.2009. - DOI - PMC - PubMed
    1. Li C.Y.T., Poo M.M., Dan Y. Burst spiking of a single cortical neuron modifies global brain state. Science. 2009;324:643–646. doi: 10.1126/science.1169957. - DOI - PMC - PubMed
    1. Santra T.S., Tseng F.-G. Handbook of Single Cell Technologies. Springer Nature: Singapore Pte. Ltd; Singapore: 2018.
    1. Hu P., Zhang W., Xin H., Deng G. Single cell isolation and analysis. Front. Cell Dev. Biol. 2016;4:1–12. doi: 10.3389/fcell.2016.00116. - DOI - PMC - PubMed
    1. Santra T.S., Tseng F.-G. Micro/Nanofluidic Devices for Single Cell Analysis. J. Micromach. 2014;5:154–157. doi: 10.3390/mi5020154. - DOI

Publication types

LinkOut - more resources