

Integrative analyses of gene expression profile reveal potential crucial roles of mitotic cell cycle and microtubule cytoskeleton in pulmonary artery hypertension
- PMID: 32586319
- PMCID: PMC7318763
- DOI: 10.1186/s12920-020-00740-x
Integrative analyses of gene expression profile reveal potential crucial roles of mitotic cell cycle and microtubule cytoskeleton in pulmonary artery hypertension
Abstract
Background: Pulmonary arterial hypertension (PAH) is a life-threatening condition. The aim of this study was to explore potential crucial genes and pathways associated with PAH based on integrative analyses of gene expression and to shed light on the identification of biomarker for PAH.
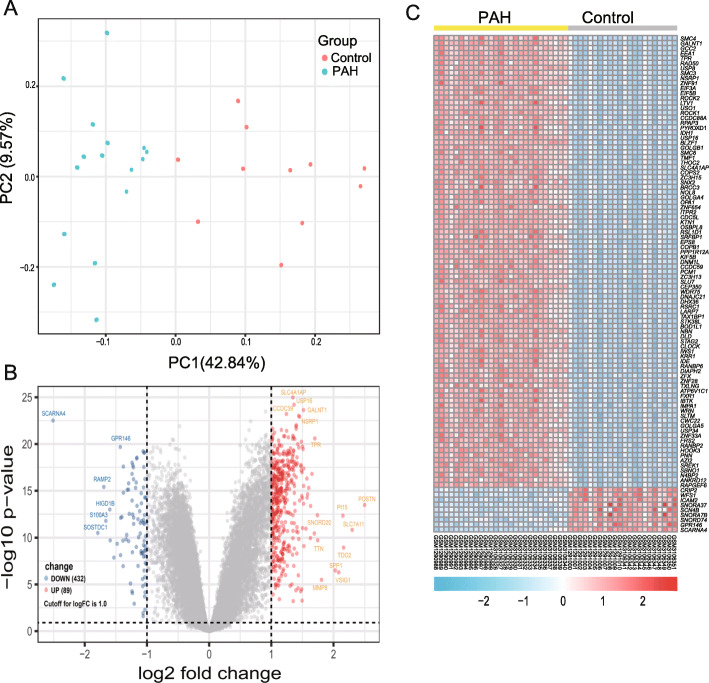
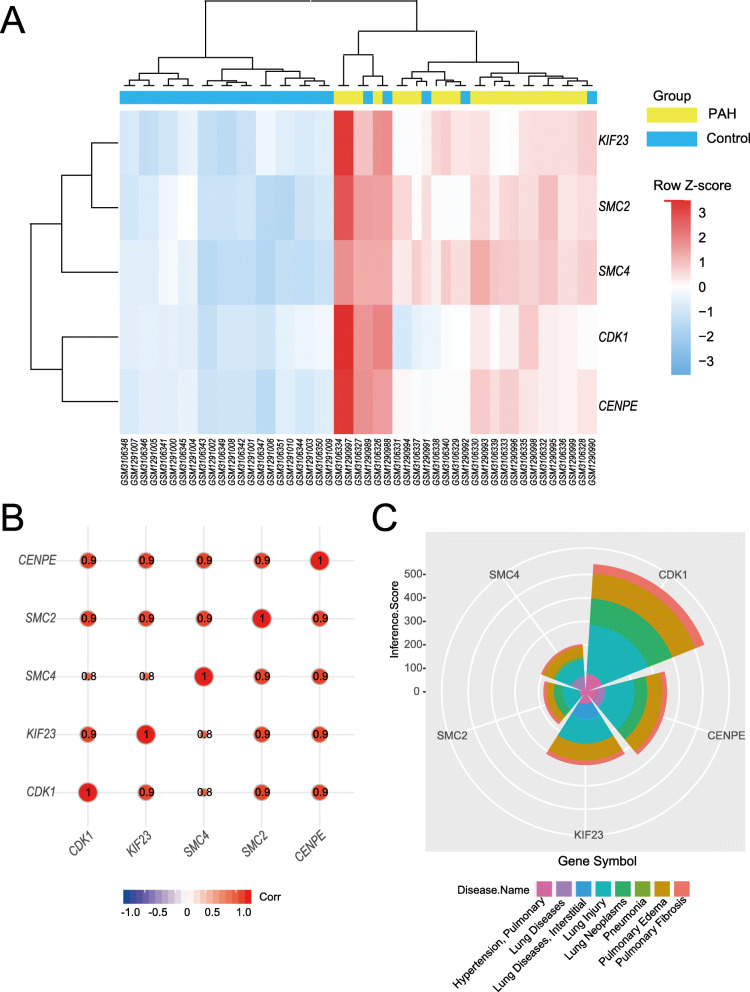
Methods: Gene expression profile of pulmonary tissues from 27 PAH patients and 22 normal controls were downloaded from public database (GSE53408 and GSE113439). After the identification of differentially expressed genes (DEGs), hub pathways and genes were identified based on the comprehensive evaluation of protein-protein interaction (PPI) network analysis, modular analysis and cytohubba's analysis, and further validated in another PAH transcriptomic dataset (GSE33463). Potentially associated micro-RNAs (miRNAs) were also predicted.
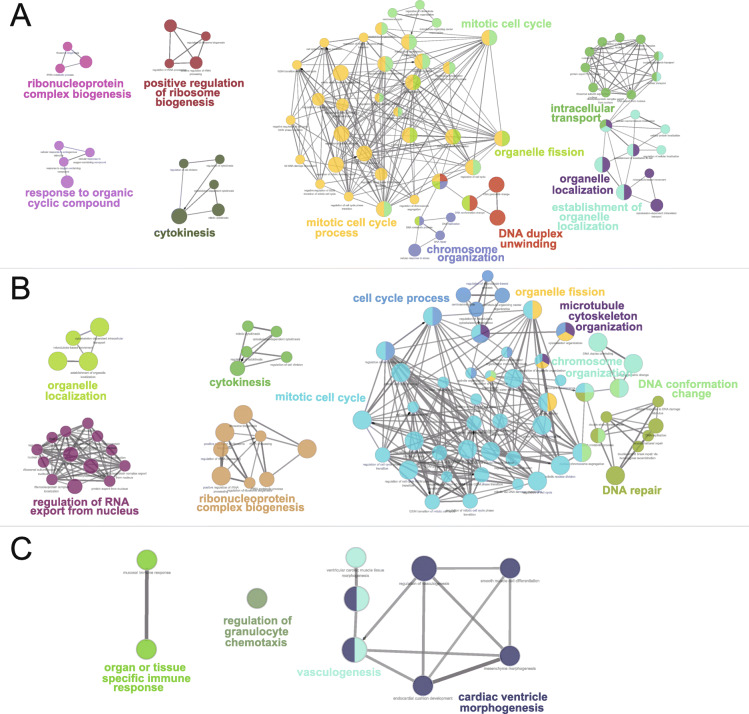
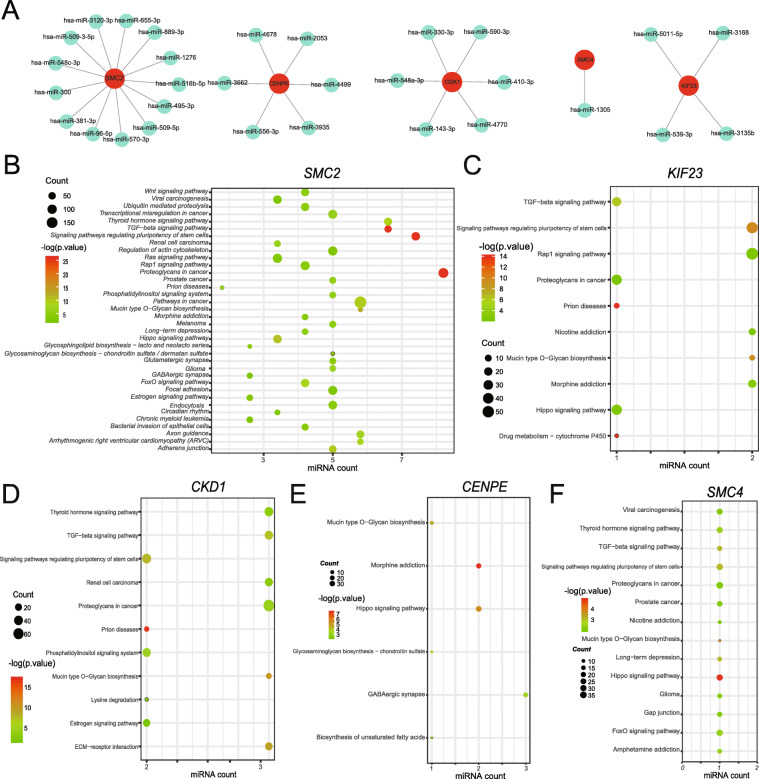
Results: A total of 521 DEGs were found between PAH and normal controls, including 432 up-regulated DEGs and 89 down-regulated DEGs. Functional enrichment analysis showed that these DEGs were mainly enriched in mitotic cell cycle process, mitotic cell cycle and microtubule cytoskeleton organization. Moreover, five key genes (CDK1, SMC2, SMC4, KIF23, and CENPE) were identified and then further validated in another transcriptomic dataset associated with special phenotypes of PAH. Furthermore, these hub genes were mainly enriched in promoting mitotic cell cycle process, which may be closely associated with the pathogenesis of PAH. We also found that the predicted miRNAs targeting these hub genes were found to be enriched in TGF-β and Hippo signaling pathway.
Conclusion: These findings are expected to gain a further insight into the development of PAH and provide a promising index for the detection of PAH.
Keywords: Differentially expressed gene; Functional enrichment analysis; Protein-protein interaction network; Pulmonary arterial hypertension; miRNAs.
Conflict of interest statement
All authors declare that they have no competing interests.
Figures


Similar articles
-
Identification of novel biomarkers involved in pulmonary arterial hypertension based on multiple-microarray analysis.Biosci Rep. 2020 Sep 30;40(9):BSR20202346. doi: 10.1042/BSR20202346. Biosci Rep. 2020. PMID: 32886110 Free PMC article.
-
Identification of TFRC as a biomarker for pulmonary arterial hypertension based on bioinformatics and experimental verification.Respir Res. 2024 Aug 3;25(1):296. doi: 10.1186/s12931-024-02928-6. Respir Res. 2024. PMID: 39097701 Free PMC article.
-
Screening of Hub Genes Associated with Pulmonary Arterial Hypertension by Integrated Bioinformatic Analysis.Biomed Res Int. 2021 Mar 22;2021:6626094. doi: 10.1155/2021/6626094. eCollection 2021. Biomed Res Int. 2021. PMID: 33816621 Free PMC article.
-
Application of transcriptomics and proteomics in pulmonary arterial hypertension.Per Med. 2023 Mar;20(2):183-192. doi: 10.2217/pme-2023-0020. Epub 2023 May 17. Per Med. 2023. PMID: 37195212 Review.
-
Epigenetic Regulation of Endothelial Dysfunction and Inflammation in Pulmonary Arterial Hypertension.Int J Mol Sci. 2021 Nov 9;22(22):12098. doi: 10.3390/ijms222212098. Int J Mol Sci. 2021. PMID: 34829978 Free PMC article. Review.
Cited by
-
Identification of Signal Pathways and Hub Genes of Pulmonary Arterial Hypertension by Bioinformatic Analysis.Can Respir J. 2022 Aug 29;2022:1394088. doi: 10.1155/2022/1394088. eCollection 2022. Can Respir J. 2022. PMID: 36072642 Free PMC article.
-
Identification of the Key Pathways and Genes in Hypoxia Pulmonary Arterial Hypertension Following Intrauterine Growth Retardation.Front Mol Biosci. 2022 Mar 31;9:789736. doi: 10.3389/fmolb.2022.789736. eCollection 2022. Front Mol Biosci. 2022. PMID: 35433826 Free PMC article.
-
Comprehensive analysis and validation of novel immune and vascular remodeling related genes signature associated with drug interactions in pulmonary arterial hypertension.Front Genet. 2022 Sep 6;13:922213. doi: 10.3389/fgene.2022.922213. eCollection 2022. Front Genet. 2022. PMID: 36147486 Free PMC article.
-
ECM2 and GLT8D2 in human pulmonary artery hypertension: fruits from weighted gene co-expression network analysis.J Thorac Dis. 2021 Apr;13(4):2242-2254. doi: 10.21037/jtd-20-3069. J Thorac Dis. 2021. PMID: 34012575 Free PMC article.
-
Blocking cholesterol formation and turnover improves cellular and mitochondria function in murine heart microvascular endothelial cells and cardiomyocytes.Front Physiol. 2023 Sep 7;14:1216267. doi: 10.3389/fphys.2023.1216267. eCollection 2023. Front Physiol. 2023. PMID: 37745244 Free PMC article.
References
-
- McLaughlin VV, Archer SL, Badesch DB, Barst RJ, Farber HW, Lindner JR, Mathier MA, Mcgoon MD, Park MH, Rosenson RS, et al. ACCF/AHA 2009 expert consensus document on pulmonary hypertension a report of the American college of cardiology foundation task force on expert consensus documents and the american heart association developed in collaboration with the American college of chest physicians; American Thoracic Society, Inc.; and the pulmonary hypertension association. J Am Coll Cardiol. 2009;53(17):1573–1619. - PubMed
-
- Vonk-Noordegraaf A, Haddad F, Chin KM, Forfia PR, Kawut SM, Lumens J, Naeije R, Newman J, Oudiz RJ, Provencher S, et al. Right heart adaptation to pulmonary arterial hypertension: physiology and pathobiology. J Am Coll Cardiol. 2013;62(25 Suppl):D22–D33. - PubMed
-
- Hatton N, Ryan JJ. Sex differences in response to pulmonary arterial hypertension therapy : is What's good for the goose, good for the Gander? Chest. 2014;145(6):1184–1186. - PubMed
Publication types
MeSH terms
Substances
Grants and funding
- 81700062/the National Natural Science Foundation/International
- LQ16H010003/the Natural Science Foundation of Zhejiang Province grants/International
- 2019RC050/Science and Technology Project of Zhejiang Provincial Health Commission/International
- 2019R413082/Zhejiang Xinmiao Talents Program/International
- Y201942208/the General scientific projects of Zhejiang Education Department/International
LinkOut - more resources
Full Text Sources
Miscellaneous
