. 2020 Jul 14;117(28):16302-16312.
doi: 10.1073/pnas.1918519117. Epub 2020 Jun 25.

Dynamic human MutSα-MutLα complexes compact mismatched DNA

Affiliations

Dynamic human MutSα-MutLα complexes compact mismatched DNA

Kira C Bradford et al. Proc Natl Acad Sci U S A. .

Abstract

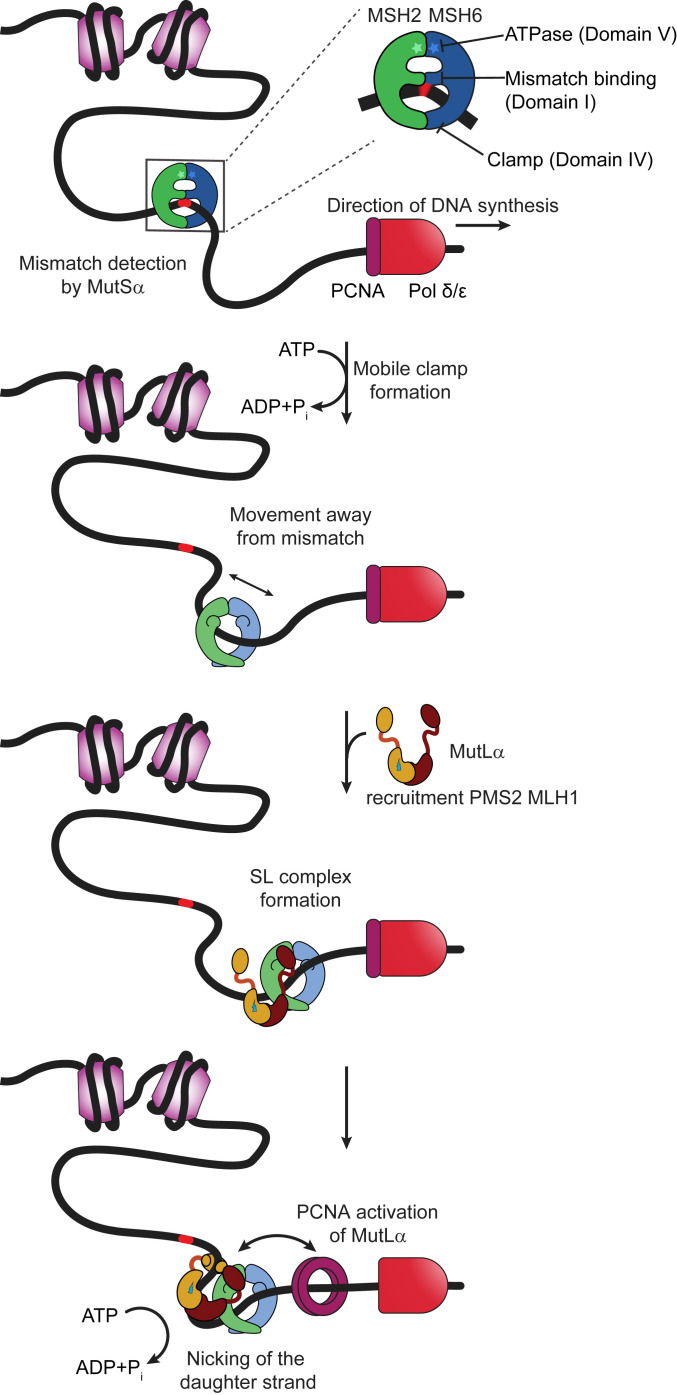
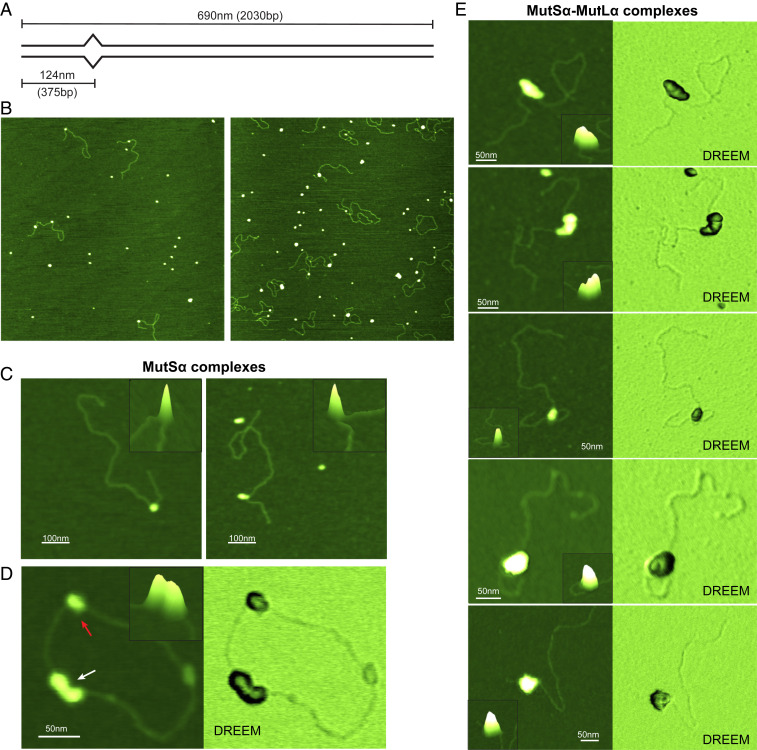
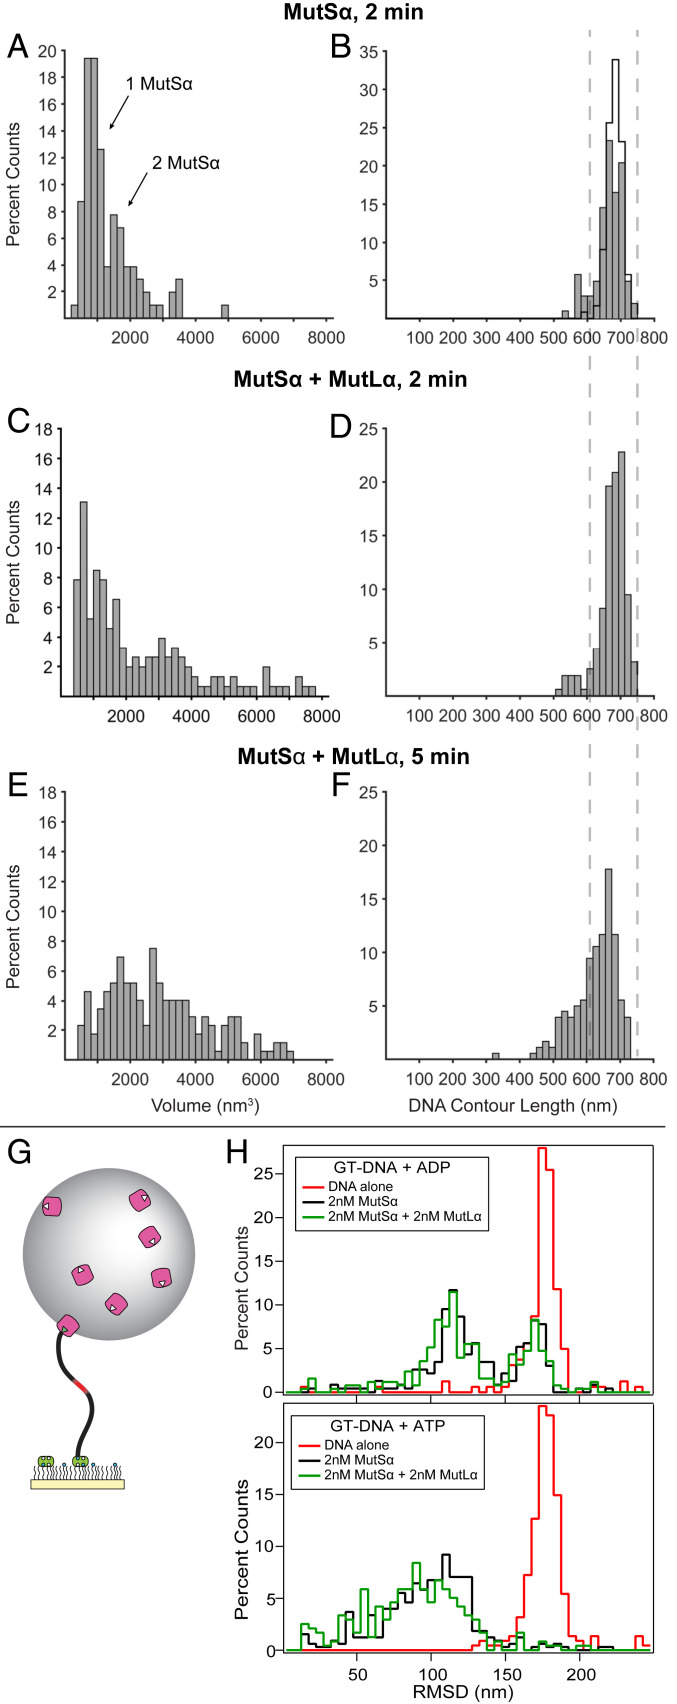
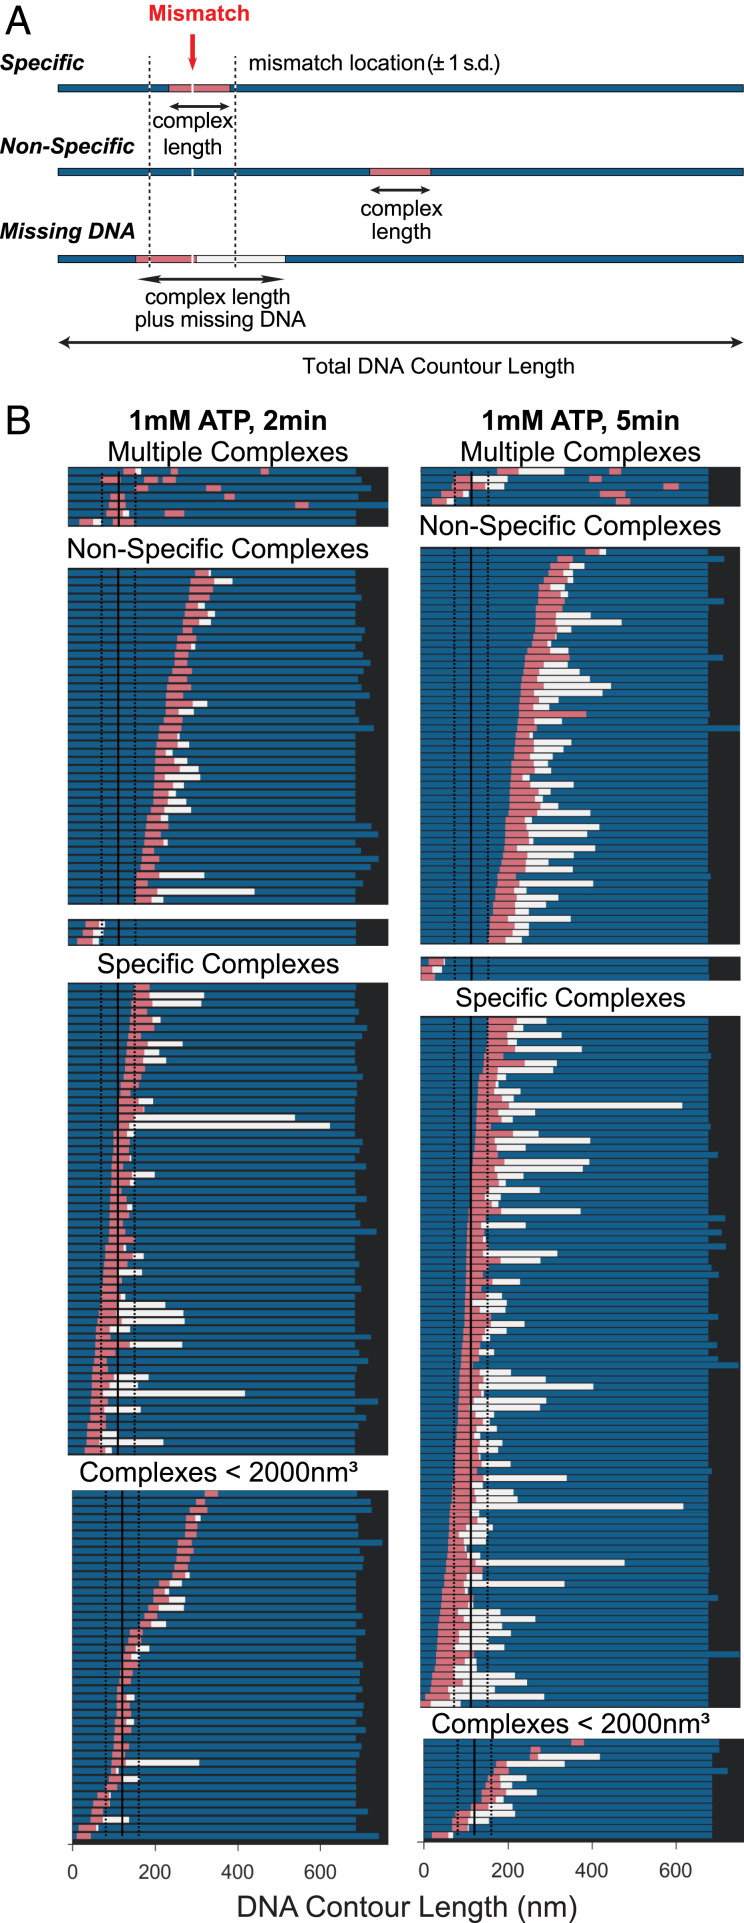
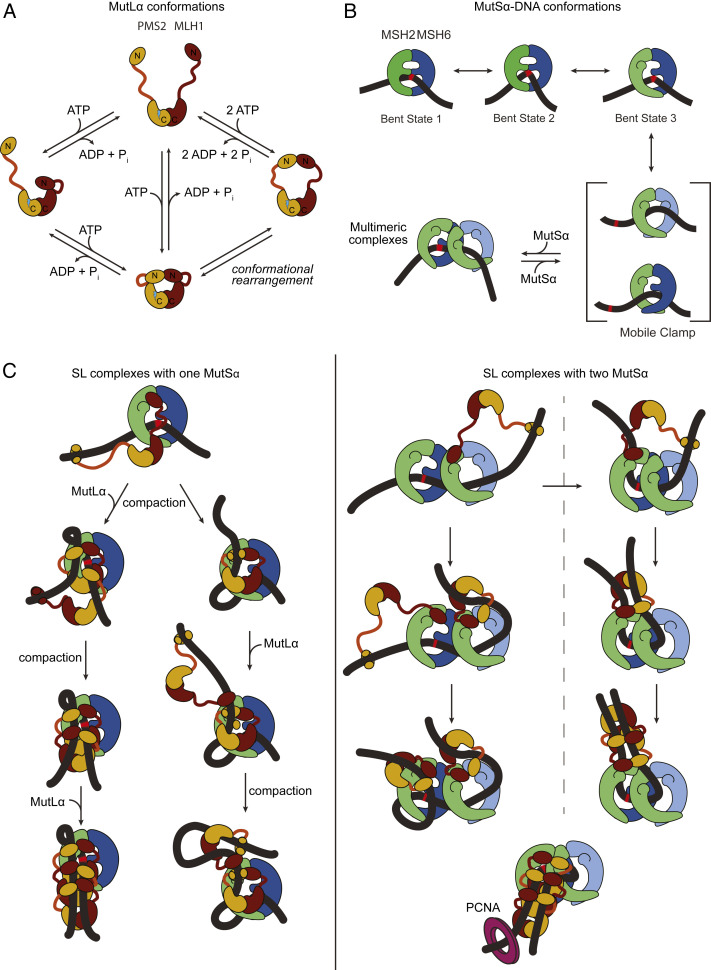
DNA mismatch repair (MMR) corrects errors that occur during DNA replication. In humans, mutations in the proteins MutSα and MutLα that initiate MMR cause Lynch syndrome, the most common hereditary cancer. MutSα surveilles the DNA, and upon recognition of a replication error it undergoes adenosine triphosphate-dependent conformational changes and recruits MutLα. Subsequently, proliferating cell nuclear antigen (PCNA) activates MutLα to nick the error-containing strand to allow excision and resynthesis. The structure-function properties of these obligate MutSα-MutLα complexes remain mostly unexplored in higher eukaryotes, and models are predominately based on studies of prokaryotic proteins. Here, we utilize atomic force microscopy (AFM) coupled with other methods to reveal time- and concentration-dependent stoichiometries and conformations of assembling human MutSα-MutLα-DNA complexes. We find that they assemble into multimeric complexes comprising three to eight proteins around a mismatch on DNA. On the timescale of a few minutes, these complexes rearrange, folding and compacting the DNA. These observations contrast with dominant models of MMR initiation that envision diffusive MutS-MutL complexes that move away from the mismatch. Our results suggest MutSα localizes MutLα near the mismatch and promotes DNA configurations that could enhance MMR efficiency by facilitating MutLα nicking the DNA at multiple sites around the mismatch. In addition, such complexes may also protect the mismatch region from nucleosome reassembly until repair occurs, and they could potentially remodel adjacent nucleosomes.

Keywords: AFM; DNA repair; DREEM; MutL; MutS.


Conflict of interest statement

The authors declare no competing interest.

Figures

Fig. 1.
Fig. 1.
Schematic of mammalian mismatch repair initiation showing mismatch recognition, mobile clamp formation, MutLα recruitment, and PCNA activation of MutLα. Further description is provided in the text. MutSα is depicted as a green (MSH2) and blue (MSH6) theta-like dimer, with the ATPase sites indicated by stars at the top of the theta. The middle DNA binding domain of MSH6 interacts specifically with the mismatch. Nucleosomes are represented as light purple cylinders, DNA polymerase as red bullet, and PCNA as a dark purple ring. MutLα is depicted showing the C-terminal dimerization domains of MLH1 (burgundy) and PMS2 (ochre) connected by long flexible linker arms to the N-terminal DNA binding and ATPase domains. The endonuclease site on PMS2 is shown as a lightning bolt.
Fig. 2.
Fig. 2.
Images of MutSα and MutSα–MutLα complexes bound to GT-DNA. (A) Schematic view of the GT-DNA substrate used in this study. The length of the DNA fragment and the position of the mismatch (depicted as bulge) in base pairs and in nanometers from the nearest end are shown. (B) Representative 2-μm × 2-μm top-view images of MutSα (Left) or MutSα+MutLα (Right) deposited in the presence of GT-DNA and ATP. (C) Zoomed 3D topographic images of MutSα–GT–DNA complexes containing one (Left) or two (Right) MutSα proteins. (D) Topographic (Left) and DREEM (Right) images of MutSα on circular GT-DNA showing complexes containing one (red arrow) and three MutSα (white arrow) proteins in the complex. DREEM images show the DNA passing through the MutSα proteins. (E) Topographic and DREEM images of MutSα–MutLα–GT-DNA complexes showing different sizes and increasingly compacted structures. Control experiments show that the larger complexes seen in the presence of MutSα, MutLα, and ATP do not form on GC-DNA and that MutLα alone with ATP exhibits no significant binding to DNA (SI Appendix, Figs. S2H and S4). Scale bars are shown in white. (Insets, CE) Zoomed-in 3D topographic views of the complexes. Cartoons depicting possible complex conformations are shown in Fig. 5. Additional images are shown in SI Appendix, Figs. S1 and S5 A and B.
Fig. 3.
Fig. 3.
MutSα–MutLα complexes compact GT-DNA. (AF) Distributions of AFM volumes (left column) and total DNA contour lengths (right column) for MutSα and MutSα–MutLα complexes bound to GT-DNA. Volumes (A, C, and E) and lengths (B, D, and F) of protein–DNA complexes for MutSα incubated in the presence of GT-DNA and ATP for 2 min (A and B; n = 103) and for MutSα+MutLα incubated in the presence of GT-DNA and ATP for 2 min (C and D; n = 199) and 5 min (E and F; n = 173). Both specific and nonspecific complexes are included in the analyses. Cityscape in B shows the length distribution for free DNA. Dashed lines across B, D, and F show ±1 SD of the measured free DNA length. Additional data using nicked plasmid GT-DNA as a substrate are included in SI Appendix, Figs. S2E and S5. (G) Cartoon of tethered particle motion assay showing mismatched DNA tethered to a surface with bead attached (not to scale). (H) Histograms of the RMSDs of many DNA molecules using the tethered particle motion assay with 550-bp GT-DNA. (Upper) Experiments with 2 mM ADP without protein (red; n = 161), with 2 nM MutSα (black; n = 231), and with 2 nM each of MutSα+MutLα (green; n = 252). (Lower) Experiments with 2 mM ATP without protein (red; n = 224), with 2 nM MutSα (black; n = 326), and with 2 nM each of MutSα+MutLα (green; n = 238). No significant changes in bead motion were observed with GC-DNA for either MutSα alone or MutSα and MutLα in the presence of ATP (SI Appendix, Fig. S6).
Fig. 4.
Fig. 4.
Position analysis of MutSα–MutLα complexes bound to GT-DNA. (A) Schematics of DNA molecules (represented as bars) showing location of MutSα–MutLα complex and extent of DNA contained within the complex. Schematics for three types of complexes are shown: specific, mismatch within complex (Top); nonspecific, complex away from the mismatch (Middle); and missing DNA, complexes where the DNA is shorter than ±1 SD of the distribution of DNA contour length (Bottom). For all, the bar denotes the total DNA contour length and the pink section is the length of the complex on the DNA. The blue sections represent the length of the DNA observed on either side of the complex. The white section (in missing DNA example) represents the missing DNA length for molecules with lengths less than 1 SD of free DNA. The total amount of DNA that the protein complex covers is the summation of the pink and white bars. On the top example, a red arrow points to the mismatch site, and dashed black lines on either side indicate ±1 SD of the measured position of the mismatch on the DNA. (B) Positions of MutSα–MutLα complexes on GT-DNA in the presence of 1 mM ATP incubated for 2 min (Left) or 5 min (Right). Complexes are first separated into two groups: complex volumes <2,000 nm3 consistent with one or two MutSα (Bottom) and >2,000 nm3 consistent with MutSα–MutLα complexes (Upper). Those complexes with volumes >2,000 nm3 (SL complexes) are separated into specific and nonspecific complexes. Each group is sorted from top to bottom based on the position of the complex relative to the nearest end to the mismatch, and those with multiple complexes are shown on the top. DNA is only considered to be compacted if the contour length is shorter than the 1 SD in the length measurements. These plots are generated from the same data as in Fig. 3 CF.
Fig. 5.
Fig. 5.
Example models of potential pathways to the formation of compacted MutSα–MutLα–GT-DNA complexes. (A) Previously identified conformational states of MutLα (42). MLH1 and PMS2 are shown in burgundy and ochre, respectively. The C-terminal dimerization domains are connected to the N-terminal ATPase and DNA binding domains by a flexible linker. The endonuclease site of PMS2 is shown as a lightning bolt. (B) Model for MutSα recognition, mobile clamp formation, and association of multiple MutSα. The early states (bent states 1 to 3) are from studies of Taq MutS (19), and the two mobile clamp conformations are based on the crystal structure of E. coli MutS mobile clamp in complex with the N-terminal domains of MutL (20), in conjunction with our recent single-molecule fluorescence studies that indicate that Taq MutS mobile clamps can exist in two conformations (87). (C) Example models for formation of SL complexes containing a single MutSα (Left) or two MutSα (Right). The Discussion includes a detailed description. Complexes are shown at the mismatch, but they can also occur at nonspecific sites on GT-DNA. These models also suggest that loop formation and DNA compaction could both result from the MutLα N-terminal domain binding distally on the DNA with one of its arms in an extended state (as in A), followed by nucleotide-induced retraction of that arm toward the C-terminal domain containing the endonuclease site. The lower right model depicts how PCNA (purple ring) could interact with an SL complex with antiparallel DNA strands to activate MutLα to nick on either side of the mismatch depending on the orientation of MutLα (15). The conformations of MutSα and MutLα depicted in the model are based on the conformations shown in A and B, and the location of the interactions between MutSα and MutLα are derived from the crystal structure of E. coli MutS sliding clamp in complex with the N-terminal domains of MutL (20) and from hydrogen/deuterium exchange mass spectrometry studies of E. coli MutS and MutL coupled with functional studies of yeast MutSα and MutLα (92). Models are only representative and are not intended to imply specific pathways or any structural details, but rather to provide ideas of how MutSα–MutLα complexes could compact the DNA.

References

    1. Kunkel T. A., Erie D. A., DNA mismatch repair. Annu. Rev. Biochem. 74, 681–710 (2005). - PubMed
    1. Iyer R. R., Pluciennik A., Burdett V., Modrich P. L., DNA mismatch repair: Functions and mechanisms. Chem. Rev. 106, 302–323 (2006). - PubMed
    1. Hsieh P., Yamane K., DNA mismatch repair: Molecular mechanism, cancer, and ageing. Mech. Ageing Dev. 129, 391–407 (2008). - PMC - PubMed
    1. Modrich P., Mechanisms in E. coli and human mismatch repair (Nobel Lecture). Angew. Chem. Int. Ed. Engl. 55, 8490–8501 (2016). - PMC - PubMed
    1. Chakraborty U., Alani E., Understanding how mismatch repair proteins participate in the repair/anti-recombination decision. FEMS Yeast Res. 16, fow071 (2016). - PMC - PubMed

Publication types

LinkOut - more resources