. 2020 Jul 24;147(14):dev190330.
doi: 10.1242/dev.190330.

How affinity of the ELT-2 GATA factor binding to cis- acting regulatory sites controls Caenorhabditis elegans intestinal gene transcription

Affiliations

How affinity of the ELT-2 GATA factor binding to cis- acting regulatory sites controls Caenorhabditis elegans intestinal gene transcription

Brett R Lancaster et al. Development. .

Abstract

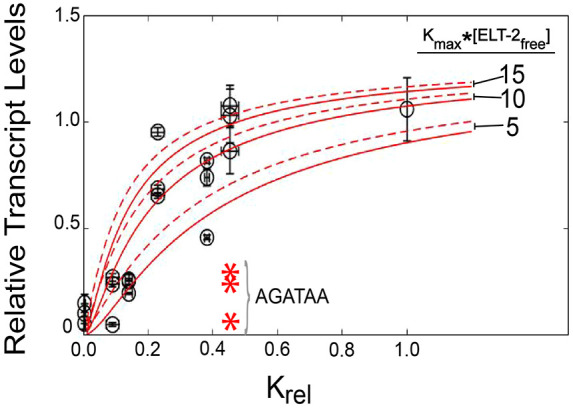
We define a quantitative relationship between the affinity with which the intestine-specific GATA factor ELT-2 binds to cis-acting regulatory motifs and the resulting transcription of asp-1, a target gene representative of genes involved in Caenorhabditis elegans intestine differentiation. By establishing an experimental system that allows unknown parameters (e.g. the influence of chromatin) to effectively cancel out, we show that levels of asp-1 transcripts increase monotonically with increasing binding affinity of ELT-2 to variant promoter TGATAA sites. The shape of the response curve reveals that the product of the unbound ELT-2 concentration in vivo [i.e. (ELT-2free) or ELT-2 'activity'] and the largest ELT-XXTGATAAXX association constant (Kmax) lies between five and ten. We suggest that this (unitless) product [Kmax×(ELT-2free) or the equivalent product for any other transcription factor] provides an important quantitative descriptor of transcription-factor/regulatory-motif interaction in development, evolution and genetic disease. A more complicated model than simple binding affinity is necessary to explain the fact that ELT-2 appears to discriminate in vivo against equal-affinity binding sites that contain AGATAA instead of TGATAA.

Keywords: Binding affinity; C. elegans; ELT-2; GATA Factor; Intestine; Protease; Transcription; asp-1; cis-acting regulatory motif.


Conflict of interest statement

Competing interestsThe authors declare no competing or financial interests.

Figures

Fig. 1.
Fig. 1.
Genes expressed in the differentiated C. elegans intestine are controlled by extended TGATAA sites. Sequence logo displaying the information content of 44 …GATA… sequences that activate transcription of a variety of C. elegans intestinal genes (details and references are provided in Table S1). Information content is calculated using the base composition of the full promoters (2000 repeat-masked base pairs upstream of the initiation codon) as background (64% AT). Information content is shown for 12 bp upstream and downstream of the extended XXTGATAAXX motif.
Fig. 2.
Fig. 2.
Analysis of competitive band shift assays in order to determine Krel. (A) Full-length ELT-2 protein was incubated with a mixture of two self-complementary hairpin oligodeoxynucleotides. Oligodeoxynucleotide A contained the highest affinity sequence, …ACTGATAAGA…, and was labelled with fluorescein. Competitor oligodeoxynucleotide C contained a variant, …XXTGATAAXX…, and was unlabelled. Bound and free species were separated by electrophoresis and the amount of bound A was measured by fluorescence, as a function of increasing amounts of total competitor C. Data were analyzed as described in the supplementary Materials and Methods in order to obtain numerical estimates of the relative binding constant Krel=KC/KA. These numerical estimates were used to calculate the competition curves; two sets of representative data are shown. (B) Numerical estimates of Krel derived from competition curves, such as those shown in A, and as explained in more detail in the text and in the supplementary Materials and Methods. Estimates of Krel in column 1 were derived by direct competition with the highest affinity sequence, …ACTGATAAGA…; estimates of Krel in column 2 were obtained independently by direct competition with the more weakly binding sequence, …GCTGATAATG…; Krel was then calculated by simple ratio. (C) Competitive band shift assay to show that ELT-2 binds to an ACAGATAAGA motif with approximately half of the affinity that it binds to the most tightly bound motif, ACTGATAAGA.
Fig. 3.
Fig. 3.
The SQRIPT assay for simultaneous quantitation of reporter transcripts. (A) The C. elegans asp-1 gene encodes a highly expressed intestine-specific aspartic protease. asp-1 transcription is controlled by two TGATAA sites that lie immediately upstream of the transcription start site and that align with the only significant peak (black bar) of ELT-2 bound in vivo [ChIP-seq data from Wiesenfahrt et al. (2016)]. Two distinguishable reporter versions of the asp-1 gene, R1 (green) and R2 (red), were constructed by the insertion of KpnI sites, as indicated. (B) Key steps in the SQRIPT assay to compare the transcriptional influence of two versions of the asp-1 promoter. Reporter R1 is controlled by the wild-type asp-1 promoter; reporter R2 is controlled by an asp-1 promoter variant (indicated by the red ‘X’). Equal concentrations of R1 and R2 plasmid DNA are injected into strain JM189 (unc-119 III; elt-7 asp-1V; elt-4 X). Transgenic animals are identified by UNC-119 rescue and propagated as a stable multicopy transgenic strain. The arrangement of reporters R1 and R2 in the array is not known and could occur in both orientations. The basis of the SQRIPT assay is that, overall, the environments of R1 and R2 are expected to be highly similar. RNA is isolated, reporter cDNA is synthesized by RT-PCR and the different levels of reporter R1 and R2 are measured quantitatively by KpnI digestion and subsequent electrophoresis to separate the distinguishable digestion products.
Fig. 4.
Fig. 4.
SQRIPT assay characterization of asp-1 transcription. (A) The two TGATAA sites in the asp-1 promoter act synergistically to drive reporter expression. ‘Wildtype’ data represent the relative transcript levels measured when the expression of both reporter R1 and R2 are driven by the wild-type asp-1 promoter. ‘GATA1 Knockout’ and ‘GATA2 Knockout’ data measure the effect on relative reporter transcript levels of ablating the upstream or the downstream asp-1 promoter TGATAA site, respectively. ‘GATA1+GATA2 Knockout’ data measure relative reporter transcript levels produced when both upstream and downstream TGATAA sites are ablated. Different colour points correspond to data obtained from independent transgenic strains; different points of the same colour correspond to data obtained from replicate assays with a single transgenic strain. Unpaired, two-tailed Student's t-test probabilities are as indicated. (B) Relative reporter transcript levels are the same when measured from either total RNA or from nascent RNA. Individual data points represent replicate assays. Unpaired, two-tailed Student's t-test probability indicated. (C) Relative reporter transcript levels do not strongly depend on the developmental stage. Relative transcript levels were measured for transgenic strains in which reporter R2 was driven by a promoter containing two copies of a CCTGATAAGA motif replacing the wild-type TGATAA versions. Plots were assembled using RStudio; whiskers encompass all data points not judged to be outliers; boxes represent the interquartile range (i.e. 25–75% of the data).
Fig. 5.
Fig. 5.
Relationship between reporter transcript levels and the ELT-2-binding affinity to extended XXTGATAAXX sites in the asp-1 promoter. Test reporters were constructed in which both of the wild-type TGATAA sites were replaced by variant XXTGATAAXX, in which the two base pairs flanking the core TGATAA sites were varied to produce values of Krel ranging from ∼0 to 1. Transgenic strains were produced and relative reporter transcript levels were measured using the SQRIPT assay. Individual data points (circles) for the same Krel represent independent transgenic strains produced by the same reporter constructs; error bars derive from replicate assays within one transgenic strain. Solid red lines are calculated as described in the text, assuming that the two TGATAA sites are completely synergistic and with trial Kmax×[ELT-2free] values of 5, 10 or 15, and for a single trial value of maximum relative transcription activity of 1.3 (at infinite ELT-2 levels). The dashed lines are calculated using the same parameters but allowing for partial synergy between the two TGATAA sites. The red asterisks correspond to the relative transcript levels measured for a reporter in which the TGATAA sites in the asp-1 promoter were replaced with variant AGATAA sites with Krel corresponding to 0.45 (see Fig. 2B,C).

Similar articles

Cited by

References

    1. Bain D. L., Yang Q., Connaghan K. D., Robblee J. P., Miura M. T., Degala G. D., Lambert J. R. and Maluf N. K. (2012). Glucocorticoid receptor-DNA interactions: binding energetics are the primary determinant of sequence-specific transcriptional activity. J. Mol. Biol. 422, 18-32. 10.1016/j.jmb.2012.06.005 - DOI - PubMed
    1. Boulin T., Etchberger J. F. and Hobert O. (2006). Reporter gene fusions. WormBook. 1-23. (ed. The C. elegans Research Community): http://www.wormbook.org. 10.1895/wormbook.1.106.1 - DOI
    1. Carey M. F., Peterson C. L. and Smale S. T. (2009). Transcriptional Regulation in Eukaryotes: Concepts, Strategies, and Techniques, 2nd edn Cold Spring Harbor, New York: Cold Spring Harbor Laboratory Press.
    1. Crocker J., Abe N., Rinaldi L., McGregor A. P., Frankel N., Wang S., Alsawadi A., Valenti P., Plaza S., Payre F. et al. (2015). Low affinity binding site clusters confer hox specificity and regulatory robustness. Cell 160, 191-203. 10.1016/j.cell.2014.11.041 - DOI - PMC - PubMed
    1. Deplancke B., Alpern D. and Gardeux V. (2016). The genetics of transcription factor DNA binding variation. Cell 166, 538-554. 10.1016/j.cell.2016.07.012 - DOI - PubMed

Publication types

MeSH terms

Substances