. 2020 Jun 26;368(6498):eaba3203.
doi: 10.1126/science.aba3203.

Muscle and neuronal guidepost-like cells facilitate planarian visual system regeneration

Affiliations

Muscle and neuronal guidepost-like cells facilitate planarian visual system regeneration

M Lucila Scimone et al. Science. .

Abstract

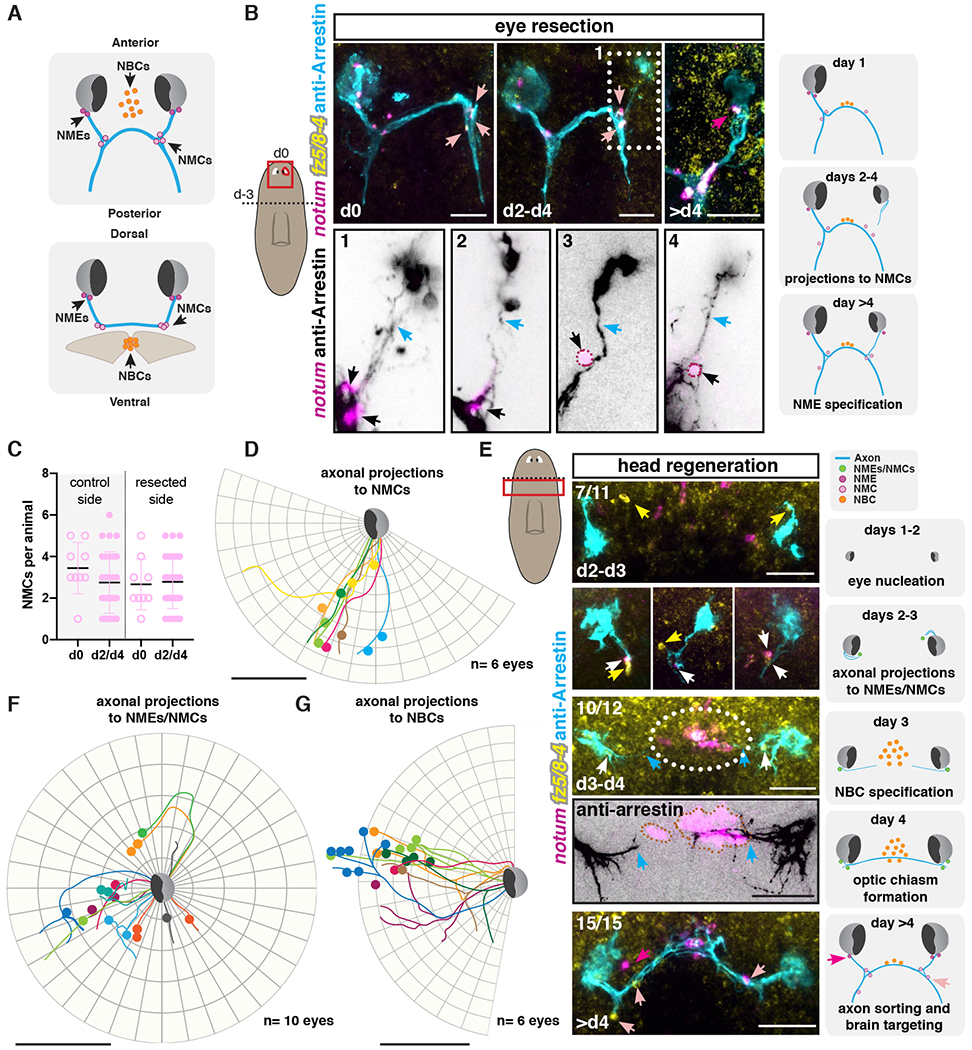
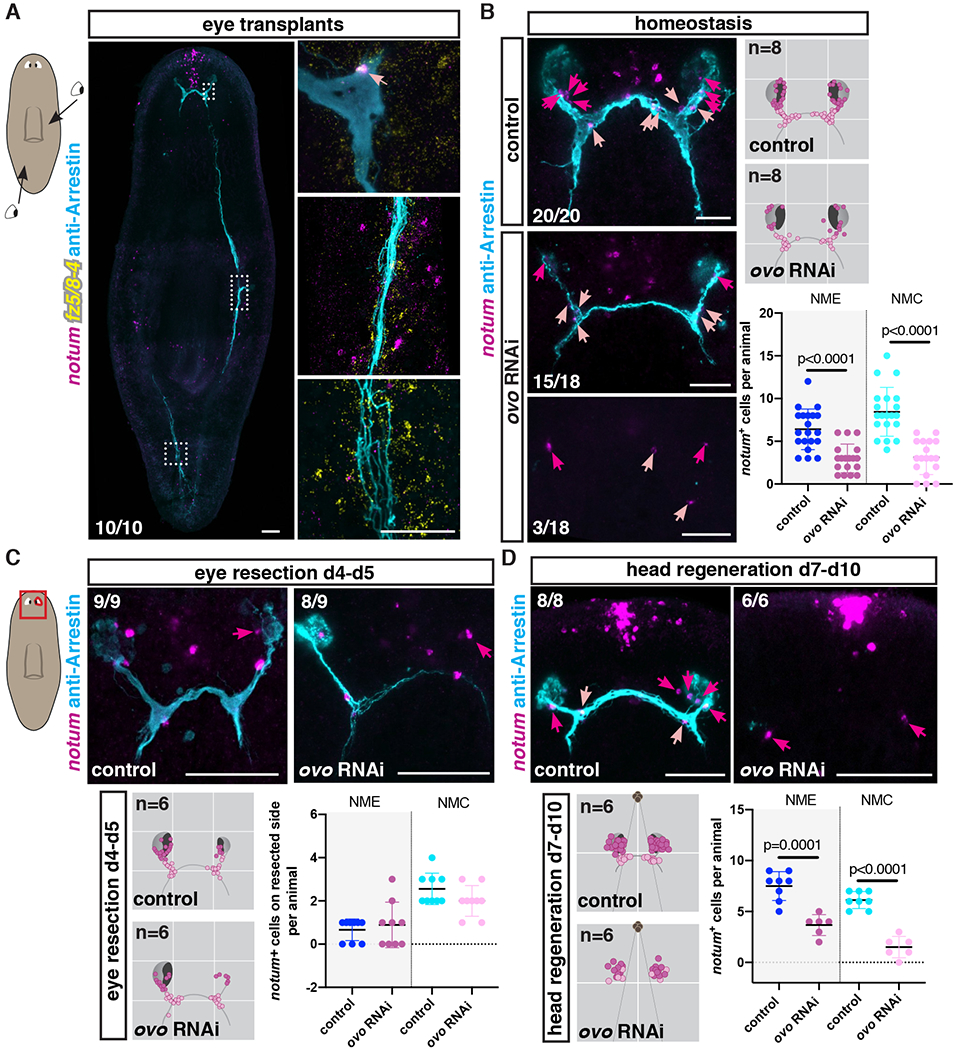
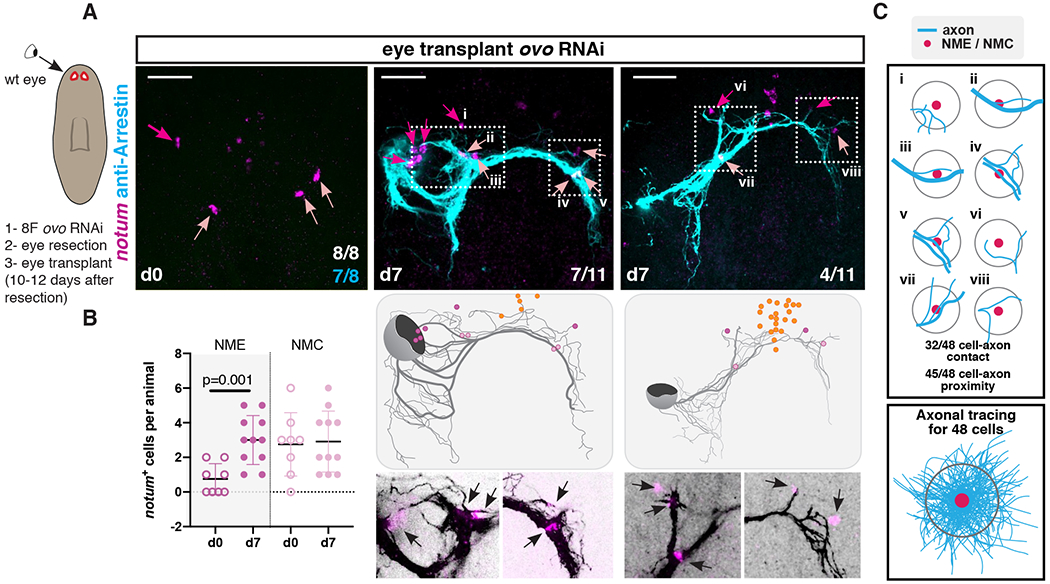
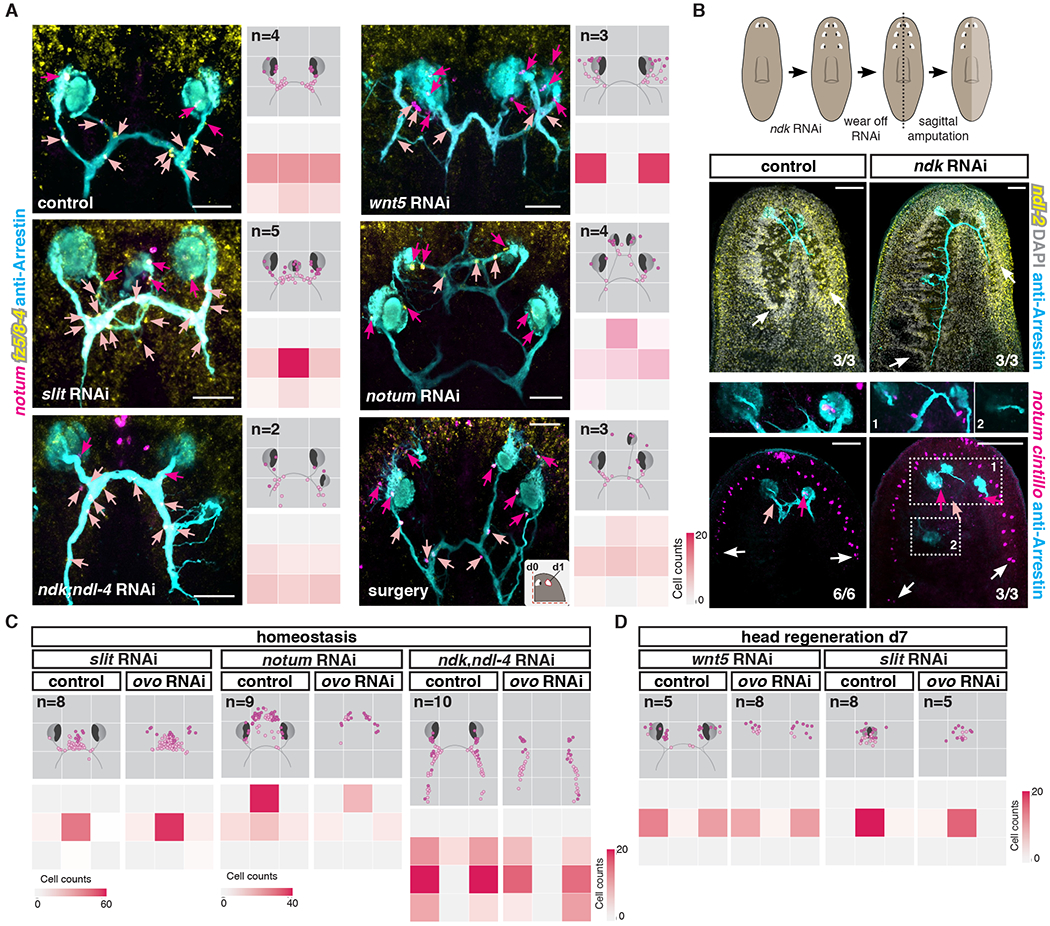
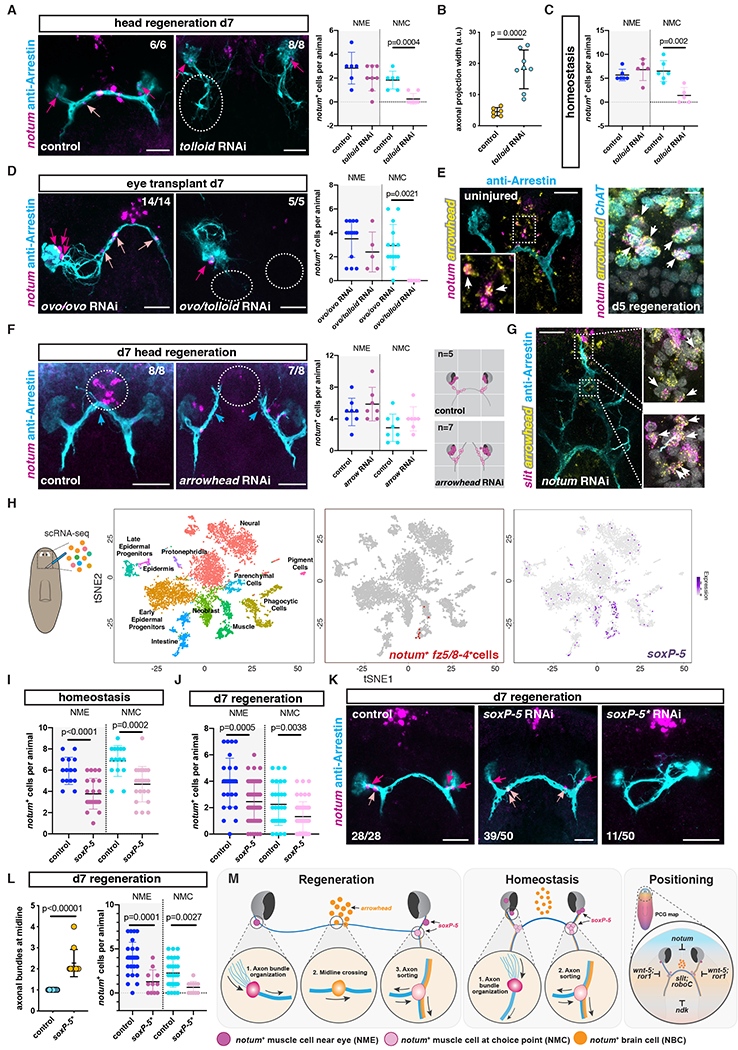
Neuronal circuits damaged or lost after injury can be regenerated in some adult organisms, but the mechanisms enabling this process are largely unknown. We used the planarian Schmidtea mediterranea to study visual system regeneration after injury. We identify a rare population of muscle cells tightly associated with photoreceptor axons at stereotyped positions in both uninjured and regenerating animals. Together with a neuronal population, these cells promote de novo assembly of the visual system in diverse injury and eye transplantation contexts. These muscle guidepost-like cells are specified independently of eyes, and their position is defined by an extrinsic array of positional information cues. These findings provide a mechanism, involving adult formation of guidepost-like cells typically observed in embryos, for axon pattern restoration in regeneration.


Conflict of interest statement

Competing interests: The authors have no competing interests.

Figures

Figure 1.
Figure 1.. notum+ fz5/8-4+ muscle cells are tightly associated with the planarian visual system.
(A) Schematic diagram of planarian visual system. (B) notum+ cells associated with visual axons. (C) Co-expression and (D) density map (top) of notum and fz5/8-4 in cells associated with visual axons. Dark pink, cells near the eye; light pink, cells at choice points. Bottom: Graph shows positive correlation between number of cells associated with visual circuit and animal size (length). Red line, best fit for linear regression. (E) Transverse cut (red line) shows nuclei position of three notum+ cell subsets. Yellow dotted line, notum+ fz5/8-4+ cells. Dorsal, top; ventral, bottom. (F) SMEDWI-1 expression in a cell associated with visual circuit indicates recent specification. (G-J) notum+ cells associated with visual axons do not express eye-specific markers (G), neuron-specific markers (H), or glia-specific markers (I), but express muscle-specific markers (J; pool: troponin, tropomyosin, colF-2, colF-10). (K) Muscle notum+ cells are associated with visual axons in Schmidtea polychroa embryos. Cartoon shows embryonic stages. White arrows point to notum+ cells associated with visual circuit. Cartoon red box shows location of image taken. Scale bars, 50μm (B, C, E, G, H, I, J, K) and 10μm for all zoom-ins (C, F, H, I, J).
Figure 2.
Figure 2.. notum+ fz5/8-4+ muscle cells are associated with regenerating visual axons.
(A) Illustrations show NME, NMC, and NBC positions across different axes. (B) Regeneration of visual system at different timepoints following unilateral eye resection. Bottom: zoom-ins of visual axonal projection examples (1-4) 2-4 days after eye resection. Dotted outline, NMEs/NMCs. Left cartoon shows surgical procedure: head decapitation (dotted line; day −3) and unilateral eye resection three days later (d0; red line). Red box, location of image taken. Right cartoons summarize events observed following eye resection. (C) Graph shows no change in NMC numbers between resected and control sides. (D, F, G) Circular plots show tracing of photoreceptor axonal trajectories (lines) from independent right eyes during regeneration (d2 to d4) of a resected eye (D) or decapitation (F, G). Colored dots represent NMCs (D), NMEs/NMCs (F) or NBCs (G). (E) Regenerating visual system following decapitation. Dotted line in left cartoon indicates amputation line, red box shows location of image taken. Illustrations (right) summarize events observed after decapitation. Blue arrows, axons; white arrows, NMEs and/or NMCs, dark pink arrows or dots, NMEs; light pink arrows or dots and black arrows, NMCs. Orange dots or dotted outline, NBCs; white arrows, NMEs/NMCs; yellow arrows NMEs/NMCs expressing only frizzled 5/8-4. Scale bars, 50μm (B, D-G).
Figure 3.
Figure 3.. Visual axons are not required for NME and NMC specification but maintenance.
(A) NMCs are observed associated with original visual axons but not with axons from transplanted eyes. Cartoon on left shows location of transplanted eyes. (B) NMEs/NMCs are present in uninjured animals with few or no visual axons (ovo RNAi). Right top: Density map shows NME/NMC distributions in an idealized visual system cartoon. n indicates number of animals mapped. Right bottom: Graph shows NME/NMC numbers in uninjured RNAi animals. Regeneration of NMEs (C) and NMEs/NMCs (D) in ovo RNAi animals after eye resection (C) or head amputation (D). Bottom left: Mapping shows NME/NMC distributions in an idealized visual system cartoon. n indicates number of animals mapped. Bottom right: Graph shows NME/NMC numbers. Red box shows location of image taken. Dark pink arrows or dots, NMEs; light pink arrows or dots, NMCs. Scale bars, 100μm (A) and 50μm (B-D).
Figure 4.
Figure 4.. NMEs and NMCs facilitate visual system patterning after eye transplantation.
(A) Top: NMEs/NMCs are still present 10-12 days after double-eye resection in ovo RNAi animals before a wild-type eye is transplanted (left). Complete (middle) or incomplete (right) recapitulation of stereotypical visual axonal projections after eye transplantation in double-eye resected ovo RNAi animals. Cartoon on left shows summarized surgical procedure: animals were RNAi fed 8 times (8F), double-eye resection performed, and wild-type eye transplanted 10 to 12 days after eye resection. Animals were fixed just before (d0) or 7 days after (d7) transplantation. Cartoons show axonal tracings of the image shown above and position of NMEs, NMCs, and NBCs. Below: zoom-ins (white dotted box) showing axonal projections from transplanted eyes in close association with NMEs/NMCs (black arrows). (B) Graph shows NME/NMC numbers before and after transplantation. (C) Cartoons show examples from A (i-viii) of NME/NMC associations with visual axons. Numbers of cells that contact an axonal tract or found within two cell-diameter distance to the axonal tract are shown. Bottom: axonal tracing observed near 48 NMEs/NMCs after transplantation. Dark pink arrows or dots, NMEs; light pink arrows or dots, NMCs. Scale bars, 50μm (A).
Figure 5.
Figure 5.. Axial patterning is required for positioning of NMEs and NMCs.
(A) Left: Visual system and NMEs/NMCs in different uninjured RNAi conditions or following surgery. Right top: Density map shows NME/NMC distributions in an idealized visual system illustration. n indicates number of animals mapped. Right bottom: Heatmap shows numbers of NMEs/NMCs in each quadrant. (B) Top: Illustration summarizing experimental procedure. Middle: Rescaling of ndl-2 PCG expression, maintenance of posteriorized brain lobe in old tissue, and regeneration of normal size brain lobe in blastema. Bottom: NMEs/NMCs are present near eyes located at the correct position following PCG rescaling (1) but not near ectopic posterior eyes (2) in an ndk RNAi animal. White arrows point to brain lobes or neurons (cintillo+). (C) Mapping shows NME/NMC distributions in an idealized visual system cartoon of uninjured PCG RNAi animals in the presence (control) or absence (ovo RNAi) of eyes. n indicates number of animals mapped. Heatmap shows total number of NMEs/NMCs located in each quadrant. slit RNAi leads to medialization, notum RNAi leads to anteriorization, and ndk; ndl-4 RNAi leads to posteriorization of NME and NMCs – in each case independently of eyes. (D) wnt5 RNAi animals show lateralized a NME/NMC distribution, whereas slit RNAi animals show medialized cell distribution independently of visual axons during regeneration. Dotted lines in cartoons show amputation planes. Dark pink arrows or dots, NMEs; light pink arrows or dots, NMCs; blue arrows, visual axons. Scale bars, 50μm(A), 100μm (B).
Figure 6.
Figure 6.. tolloid, arrowhead, and soxP-5 are required for specification of guidepost-like cells and precise wiring of the visual system.
(A) Defasciculation of visual axons (white dotted circle) and absence of NMCs in a regenerating tolloid RNAi animal. Right graph shows NME/NMC numbers after head regeneration. (B) Graph shows axonal projection width in RNAi animals. (C) Graph shows NME/NMC numbers in uninjured animals. (D) Lack of NMCs and inability of transplanted eyes to cross the midline in tolloid RNAi animals. Right graph shows NME/NMC numbers after transplantation. (E) NBCs expressed the transcription factor arrowhead in intact (left) or regenerating (right) animals. (F) Left: Absence of NBCs and lack of optic chiasm (dotted circles) in a regenerating arrowhead RNAi animal. Middle: Graph shows normal NME/NMC numbers in regenerating arrowhead RNAi animals. Right: Mappings show distribution of NMEs/NMCs in an idealized visual system, n indicates total number of animals mapped. (G) slit+; arrowhead+ cells (white arrows) in ectopic anterior brain commissures in a notum RNAi animal coinciding with ectopic optic chiasm. (H) scRNA-sequencing analysis of cells from region depicted in left cartoon. Left: t-SNE representation of clustered cells (dots) colored based on planarian cell types. Middle: t-SNE representation of clustered muscle cells expressing notum; fz5/8-4 (red). Right: t-SNE plot colored by expression of the transcription factor soxP-5(I, L) Graph shows total NME/NMC numbers in uninjured (I) or regenerating (J) RNAi animals. (K) Visual system in presence of normal (middle) or severely reduced (right, soxP-5*) numbers of NMEs/NMCs. (L) Graphs show number of axon bundles at the midline (left), number of NMEs/NMCs (right) in soxP-5* RNAi animals. (M) Model summarizing findings (see text for details). Dark pink arrows or dots, NMEs; light pink arrows or dots, NMCs. Scale bars, 50μm (A, D, E, F, G, K).

Comment in

References

    1. Edwards JS, Chen SW, Berns MW, Cercal sensory development following laser microlesions of embryonic apical cells in Acheta domesticus. J Neurosci 1, 250–258 (1981). - PMC - PubMed
    1. Hutter H, Extracellular cues and pioneers act together to guide axons in the ventral cord of C. elegans. Development 130, 5307–5318 (2003). - PubMed
    1. Klose M, Bentley D, Transient pioneer neurons are essential for formation of an embryonic peripheral nerve. Science 245, 982–984 (1989). - PubMed
    1. Pike SH, Melancon EF, Eisen JS, Pathfinding by zebrafish motoneurons in the absence of normal pioneer axons. Development 114, 825–831 (1992). - PubMed
    1. Kolodkin AL, Tessier-Lavigne M, Mechanisms and molecules of neuronal wiring: a primer. Cold Spring Harb Perspect Biol 3, (2011). - PMC - PubMed

Publication types