. 2020 Jun 26;368(6498):eaaz5667.
doi: 10.1126/science.aaz5667.

Exploring whole-genome duplicate gene retention with complex genetic interaction analysis

Affiliations

Exploring whole-genome duplicate gene retention with complex genetic interaction analysis

Elena Kuzmin et al. Science. .

Abstract

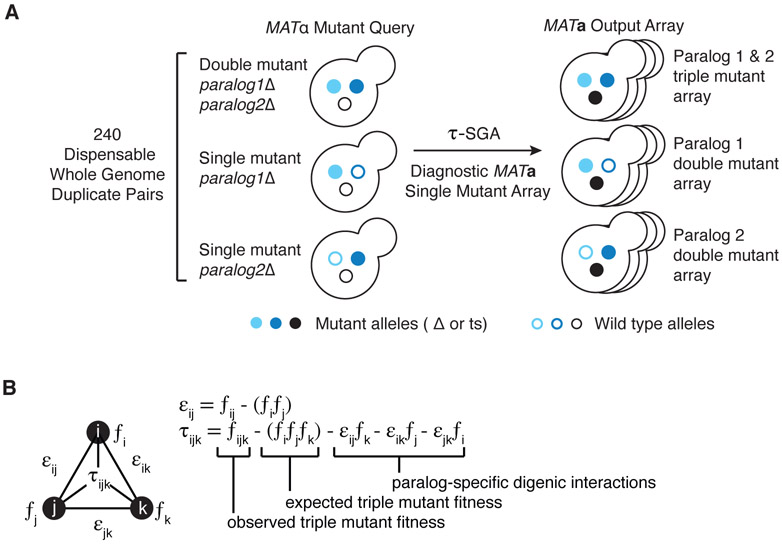
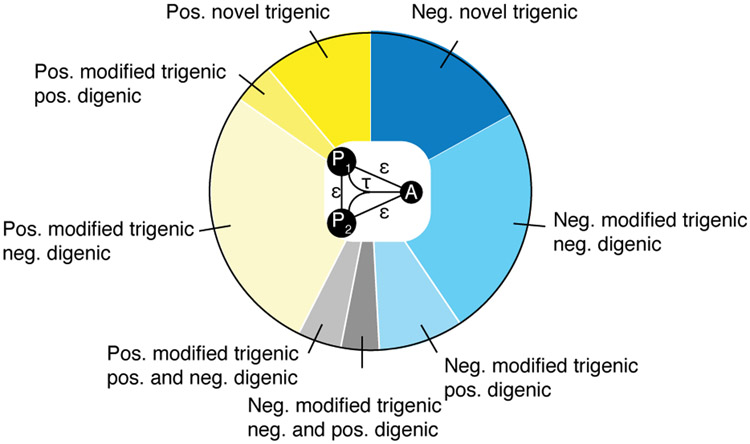
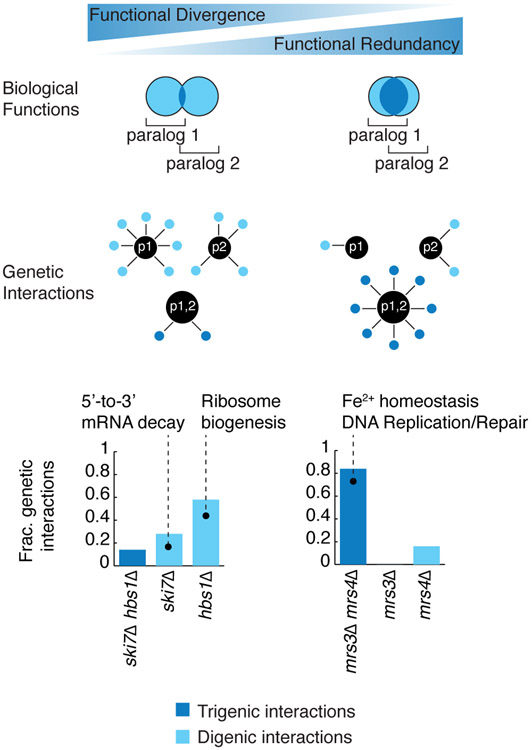
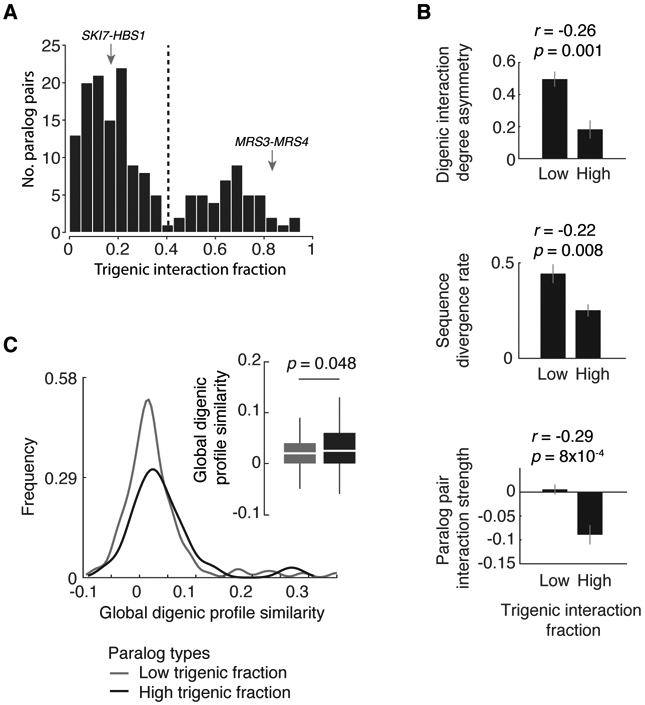
Whole-genome duplication has played a central role in the genome evolution of many organisms, including the human genome. Most duplicated genes are eliminated, and factors that influence the retention of persisting duplicates remain poorly understood. We describe a systematic complex genetic interaction analysis with yeast paralogs derived from the whole-genome duplication event. Mapping of digenic interactions for a deletion mutant of each paralog, and of trigenic interactions for the double mutant, provides insight into their roles and a quantitative measure of their functional redundancy. Trigenic interaction analysis distinguishes two classes of paralogs: a more functionally divergent subset and another that retained more functional overlap. Gene feature analysis and modeling suggest that evolutionary trajectories of duplicated genes are dictated by combined functional and structural entanglement factors.


Figures

Fig. 1.
Fig. 1.. Triple-mutant synthetic genetic array (SGA) analysis for paralogs.
(A) An illustration of triple-mutant SGA experimental approach in which a query set of 240 dispensable paralog pairs originating from the whole-genome duplication in yeast was screened for trigenic interactions. Three types of screens were carried out in parallel, whereby triple mutant fitness was estimated by crossing a double mutant query strain deleted for both paralogs (light and dark blue filled circles) is crossed into a diagnostic array of single mutants (black filled circles) (37). After induction of meiosis in heterozygous triple mutants, sequential replica pinning steps are used to select haploid triple-mutant progeny. Single-mutant control query strains are screened in parallel to estimate paralog-specific double mutant fitness. (B) We used the τ-SGA scoring method, to identify trigenic interactions quantitatively by combining double and triple mutant fitness estimates derived from colony size measurements (37).
Fig. 2.
Fig. 2.. Distribution of different types of trigenic interactions for paralogs.
Pie chart comparing the different types of trigenic interactions for all paralogs depicts negative ((τ or ε ) < −0.08, p < 0.05) and positive ((τ or ε) > 0.08, p < 0.05) genetic interactions in blue and yellow, respectively. A trigenic interaction between a double mutant query and the array strain is called ‘novel’ (dark blue/dark yellow), if there is no significant digenic interaction between either single mutant control query and the array strain or between the query gene pair. Trigenic interactions that overlap with one or more negative or positive digenic interactions are called ‘modified’ and are further classified by the type of the digenic interaction. All trigenic interactions of double mutant query strains (P1-P2) that show a negative or a positive digenic interaction between query gene pair (P1-P2) (∣ε∣ > 0.08, p < 0.05), are considered ‘modified’. Interactions may be further classified by digenic interactions (if any) between a single mutant query control strain and the array strain (P1 and/or P2-A negative, P1 and/or P2-A positive). Modified trigenic interactions that overlap: 1) digenic interactions of the same sign are in medium blue/yellow, 2) digenic interactions of the opposite sign are in light blue/yellow and 3) a mix of positive and negative digenic interactions are depicted in grey.
Fig. 3.
Fig. 3.. Mapping functional relationship of paralogs through their digenic and trigenic interactions.
This schematic depicts highly divergent paralogs with little functional overlap and functionally redundant paralogs with an extensive functional overlap, which are represented by the Venn diagrams. Diverged paralogs are predicted to exhibit many digenic interactions, indicative of their paralog-specific functions and few trigenic interactions, whereas functionally redundant paralogs are expected to show sparse digenic interactions and numerous trigenic interactions, indicative of their functional overlap. Divergent paralogs, such as SKI7-HBS1 behave consistent with the expectation and display fewer trigenic than digenic interactions. However, functional redundant paralogs, such as MRS3-MRS4, display a higher fraction of trigenic interactions with a corresponding drop in the fraction of paralog-specific digenic interactions. The fraction of different types of genetic interactions is illustrated using bar graphs. The fraction of total genetic interactions attributed to the trigenic interactions associated with a par1Δ par2Δ double mutant query, deleted for both paralogs, is depicted as a dark blue bar, whereas the fraction of digenic interactions associated with each paralog single deletion mutant, par1Δ or par2Δ, is shown as a light blue bar.
Fig. 4.
Fig. 4.. Trigenic interaction fraction correlates with fundamental physiological and evolutionary properties.
(A) Negative trigenic interaction fraction distribution of screened paralogs, (τ or ε) < −0.08, p < 0.05; paralogs with at least 6 trigenic or digenic interactions in one of the screens are considered. Representative examples of paralogs with a low (SKI7-HBS1) and high (MRS3-MRS4) trigenic interaction fraction are marked with an arrow. (B) Physiological and evolutionary properties for paralogs characterized by varying fraction of trigenic interactions were measured. Spearman correlation coefficient is denoted by ‘r’ with its associated p value and was used to measure the strength of the correlation between the trigenic interaction fraction and the three features being examined: digenic interaction degree asymmetry, sequence divergence rate and paralog pair interaction strength. The correlation was measured on the entire data set and is noted above the bar plots. The bar plots serve to visualize the trend, in which trigenic interaction fraction cut-off of 0.4 was used based on negative interactions (τ or ε) < −0.08, p < 0.05 to identify paralogs with low and high trigenic interaction fraction. Mean of specified features are depicted; error bars reflect SEM. (C) The distribution of global digenic profile correlation similarity (30) was compared for paralogs with high and low trigenic interaction fraction. A trigenic interaction fraction cut-off of 0.4 was used based on negative interactions (τ or ε) < −0.08, p < 0.05. Analyses are restricted to paralogs with at least 6 total trigenic or digenic interactions in one of the screens. Significance was assessed using one-tailed Wilcoxon rank sum test.
Fig. 5.
Fig. 5.. Trigenic interaction fraction reveals the functional divergence of duplicated genes and illuminates gene function.
(A) SAFE (70) analysis was used to visualize regions of the global digenic interaction profile similarity network (30) that were enriched for genes in the trigenic interaction profiles of the following paralog pairs (B) SBE2-SBE22 and (C) ECM13-YJR115W. Blue indicates the enrichment related to negative trigenic interactions, τ < −0.08, p < 0.05.
Fig. 6.
Fig. 6.. The evolution of retained overlap due to evolutionary constraints acting on duplicated gene sequences.
(A) Schematic depiction of the analysis of correlated evolutionary sequence changes across paralog sequences reflecting evolutionary constraints on paralogs. Correlated rates of evolution for specific columns in multiple sequence alignments for the pre-WGD homolog and each paralog are denoted with a grey to black gradient, from low to high, respectively. High correlation of position specific evolutionary rate patterns identify residues with similar evolutionary constraints. Paralogs with correlated rates (r par1:par2) that are greater than or equal to that of each paralog and with the corresponding preWGD (r par1:preWGD and r par1:preWGD ) were designated as having a high correlation of position specific evolutionary rate pattern, and paralogs with correlated rates (r par1:par2) that were less than that of either paralog or both paralogs with the preWGD (r par1:preWGD and/or r par1:preWGD ) were designated as having a low correlation of position specific evolutionary rate pattern. r refers to the Pearson correlation coefficient between the respective sequences. (B) Examples of evolutionary rates for positions in the alignments for representative paralogs, which show a high correlation of position-specific evolutionary rate patterns (MRS3-MRS4) and a low correlation of position-specific evolutionary rate patterns (SKI7-HBS1). The position in the alignment is plotted on the x-axis and the rate of evolution at a particular position divided by the average rate of evolution for all residues in the given sister paralog is plotted on the y-axis. The scale of the y-axis has been fixed for each paralog pair. Pfam domains are annotated. The MRS3-MRS4 alignment shows three mitochondrial carrier repeats, each composed of two α-helices (H1&H2 (blue), H3&H4 (red), H5&H6 (yellow)) followed by a characteristic motif PX[D/E]XX[K/R]X[K/R](20-30 residues)[D/E]GXXXX[W/Y/F][K/R]G connecting each pair of membrane-spanning domains by a loop. SKI7-HBS1 alignment shows GTP EFTU (blue) and C-terminal GTP EFTU (red) domains. The Hbs1-like N-terminal motif lies outside of the alignment window. (C) Fraction of nonessential and essential paralogs that show a high or low correlation of position-specific evolutionary rate patterns. The paralogs with low and high trigenic interaction fraction belong to the part of the distribution shown above; trigenic interaction fraction cut-off of 0.4 was used based on negative interactions score (τ or ε) < −0.08, p < 0.05 and contains the set of paralogs that were used for the correlated evolution analysis. Significance was assessed with Fisher’s exact test.
Fig. 7.
Fig. 7.. In silico evolutionary model.
(A) Schematic depiction of the in silico evolutionary model. The pair evolves through random mutations until it reaches an evolutionarily stable-state that can sustain no further mutations without a loss of function. Top panel shows a pair at the start of the evolutionary trajectory and bottom panel shows a pair that achieves a division of labor with a retention of a common function (dark blue blocks), the loss of which is prevented because it would compromise the unique functions of each paralog (yellow, light blue, red). (B-D) Evolutionary fates of paralogs with functional and structural entanglement. Paralogs were generated to represent a range of overlapping functional domains at the onset of their evolutionary trajectory and the propensity to assume specific paralog properties was quantified. In each case, x-axis represents bins of initial functional overlap as a fraction of “gene” length at the start of the simulations (< 10%, 30%, 50%, 70%, 90%, 100%, respectively); y-axis depicts the propensities of paralogs to (B) revert to a singleton state, (C) evolve functional asymmetry, (D) retain functional overlap at the evolutionary steady-state. (E) The structural and functional entanglement model of paralog divergence. A pair will evolve by sub-functionalization, if it is modular and is composed of partitionable functions (left). A paralog pair that is very structurally and functionally entangled will have a high probability of reversion to a singleton state since one of the sisters will quickly degenerate (right). Paralogs with an intermediate level of entanglement at the time of duplication will tend to partition some and retain some overlapping functions, allowing for specialization of a common activity (middle).

Comment in

  • Evolution after genome duplication.
    Ehrenreich IM. Ehrenreich IM. Science. 2020 Jun 26;368(6498):1424-1425. doi: 10.1126/science.abc1796. Science. 2020. PMID: 32587005 No abstract available.

References

    1. Bowers JE, Chapman BA, Rong J, Paterson AH, Unravelling angiosperm genome evolution by phylogenetic analysis of chromosomal duplication events. Nature 422, 433–438 (2003). - PubMed
    1. Dehal P, Boore JL, Two Rounds of Whole Genome Duplication in the Ancestral Vertebrate. PLoS Biol 3, e314 (2005). - PMC - PubMed
    1. Guan Y, Dunham MJ, Troyanskaya OG, Functional analysis of gene duplications in Saccharomyces cerevisiae. Genetics 175, 933–943 (2007). - PMC - PubMed
    1. Maere S et al., Modeling gene and genome duplications in eukaryotes. Proc Natl Acad Sci US A 102, 5454–5459 (2005). - PMC - PubMed
    1. Eichler EE, Recent duplication, domain accretion and the dynamic mutation of the human genome. Trends Genet 17, 661–669 (2001). - PubMed

Publication types