. 2020 Jun 25;10(1):10320.
doi: 10.1038/s41598-020-67292-z.

Loss of Complement Factor H impairs antioxidant capacity and energy metabolism of human RPE cells

Affiliations

Loss of Complement Factor H impairs antioxidant capacity and energy metabolism of human RPE cells

Angela Armento et al. Sci Rep. .

Abstract

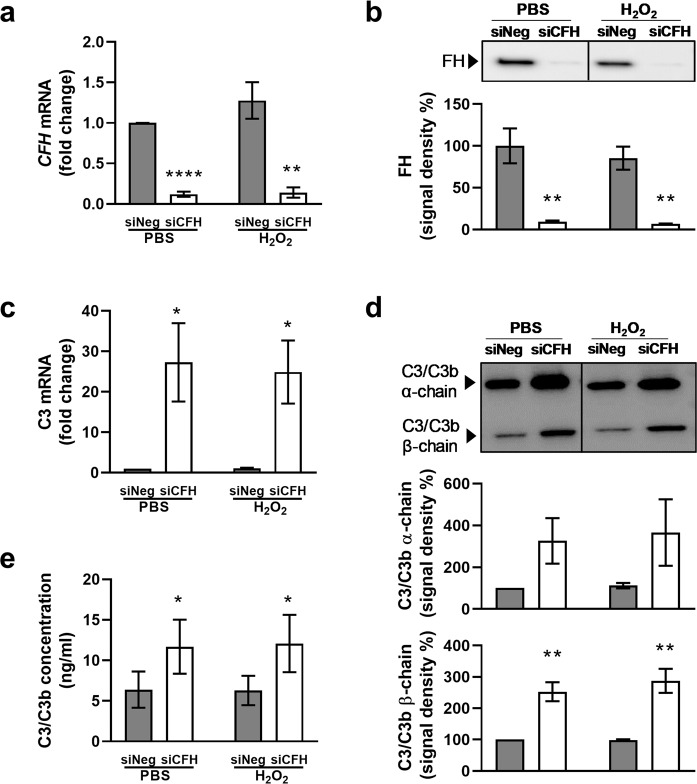
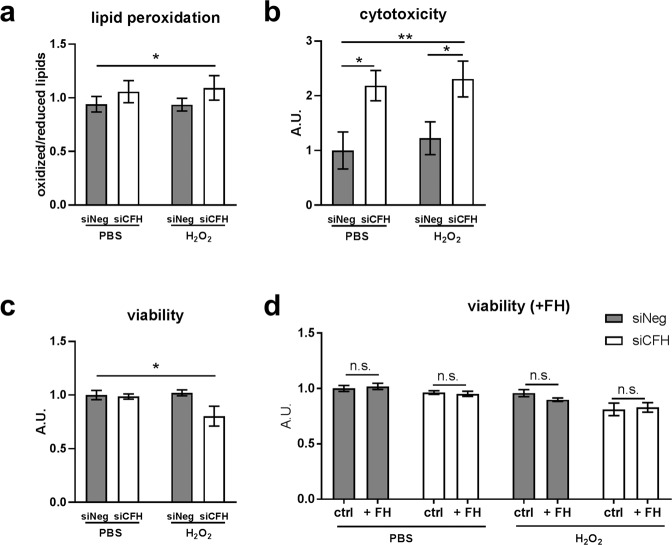
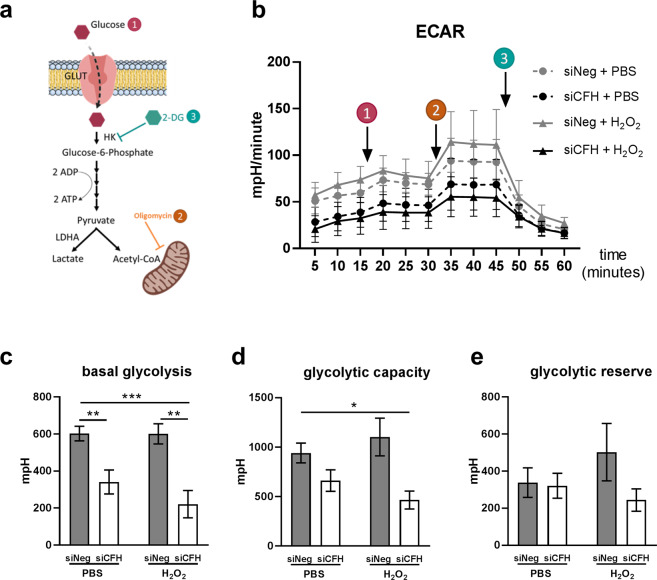
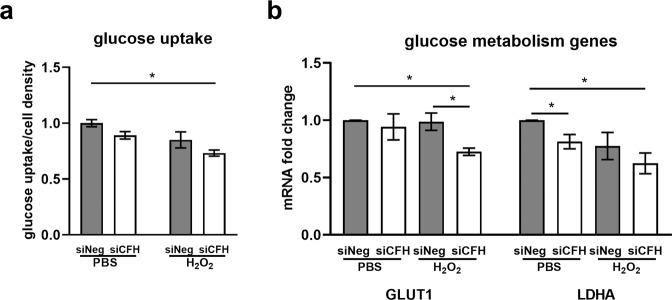
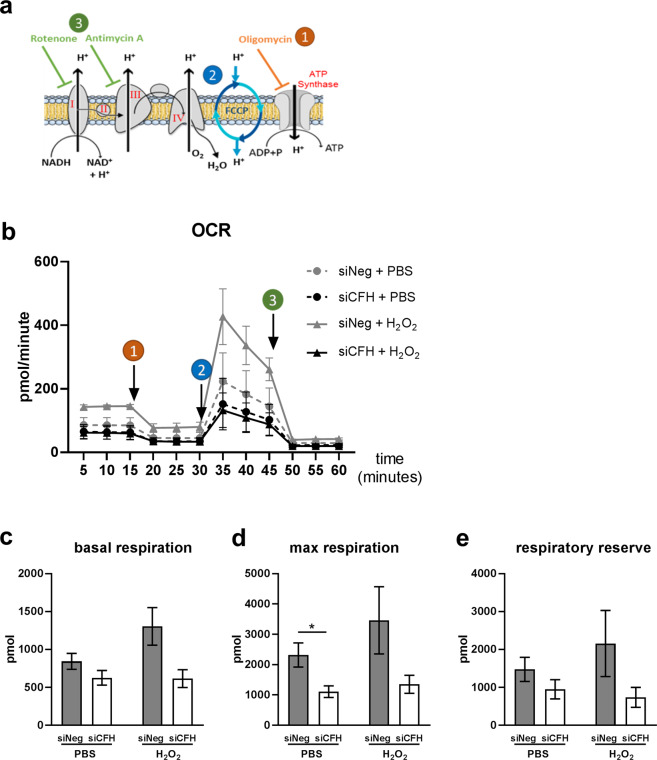
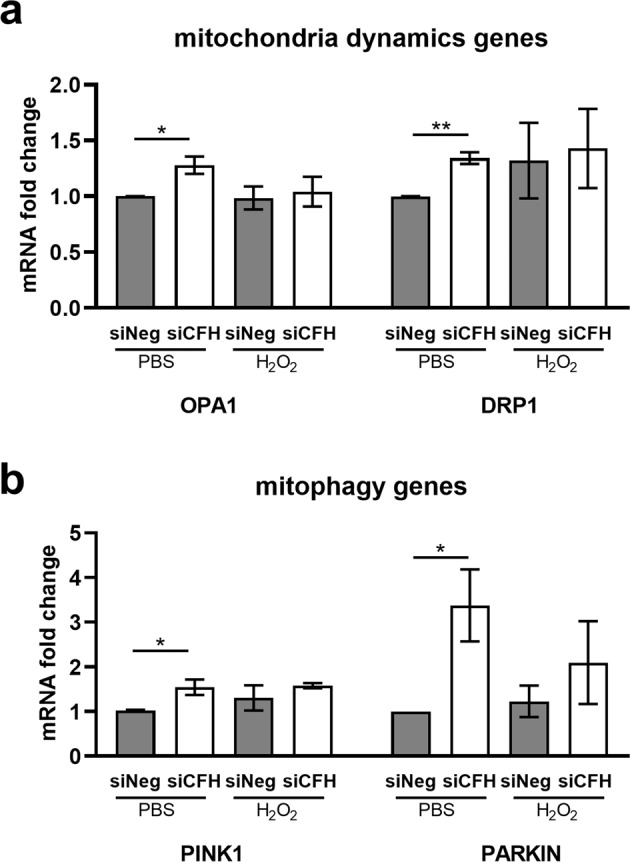
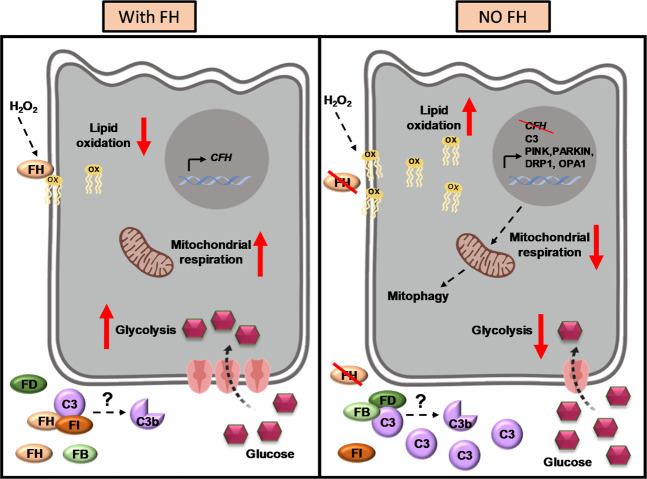
Polymorphisms in the Complement Factor H (CFH) gene, coding for the Factor H protein (FH), can increase the risk for age-related macular degeneration (AMD). AMD-associated CFH risk variants, Y402H in particular, impair FH function leading to complement overactivation. Whether this alone suffices to trigger AMD pathogenesis remains unclear. In AMD, retinal homeostasis is compromised due to the dysfunction of retinal pigment epithelium (RPE) cells. To investigate the impact of endogenous FH loss on RPE cell balance, we silenced CFH in human hTERT-RPE1 cells. FH reduction led to accumulation of C3, at both RNA and protein level and increased RPE vulnerability toward oxidative stress. Mild hydrogen-peroxide exposure in combination with CFH knock-down led to a reduction of glycolysis and mitochondrial respiration, paralleled by an increase in lipid peroxidation, which is a key aspect of AMD pathogenesis. In parallel, cell viability was decreased. The perturbations of energy metabolism were accompanied by transcriptional deregulation of several glucose metabolism genes as well as genes modulating mitochondrial stability. Our data suggest that endogenously produced FH contributes to transcriptional and metabolic homeostasis and protects RPE cells from oxidative stress, highlighting a novel role of FH in AMD pathogenesis.


Conflict of interest statement

The authors declare no competing interests.

Figures

Figure 1
Figure 1
FH reduction leads to extracellular C3/C3b accumulation. hTERT-RPE1 cells were seeded, left to attach overnight and silenced for 24 hours with negative control (siNeg) or CFH specific (siCFH) siRNA. Cells were exposed for 90 minutes to 200 µM H2O2 or PBS and cell pellets and cell culture supernatants were collected for further processing after 48 hours. (a) Monitoring of CFH expression by qRT-PCR analyses in silencing negative control (siNeg) and specific CFH silenced (siCFH) hTERT-RPE1 cells. Data are normalized to the housekeeping gene PRPL0 using Δ ΔCt methods. SEM is shown, n = 3. (b) Western blot analyses of FH protein levels in cell culture supernatants of hTERT-RPE1 in the same conditions as (a). Quantification of signal density of 4 independent experiments is shown. (c) Monitoring of C3 expression by qRT-PCR analyses in silencing negative control (siNeg) and specific CFH silenced (siCFH) hTERT-RPE1 cells. Data are normalized to housekeeping gene PRPL0 using Δ ΔCt method. SEM is shown, n = 4. (d) Western blot analyses of C3 α-chain and β-chain protein levels in cell culture supernatants of hTERT-RPE1 cells. Quantification of signal density of 3 independent experiments is shown. (e) C3/C3b ELISA analyses of cell culture supernatants of hTERT-RPE1 cells. SEM is shown, n = 4. Western Blot images were cropped, and full-length blots are presented in Supplementary Fig. S5. Significance was assessed by Student’s t-test. *p < 0.05, **p < 0.01, *** p < 0.001, ****p < 0.0001.
Figure 2
Figure 2
FH loss increases vulnerability of RPE cells toward oxidative stress. hTERT-RPE1 cells were seeded, left to attach overnight and silenced for 24 hours with negative control (siNeg) or CFH specific (siCFH) siRNA. Cells were exposed for 90 minutes to 200 µM H2O2 or PBS and specific dyes were added after 48 hours. (a) Lipid peroxidation levels were assessed via BODIPY® 581⁄591 C11 fluorescent dye. Fluorescence shift was measured at ~590 nm and ~510 nm. Data are shown as ratio oxidized/reduced lipids, higher bars indicate higher lipid peroxidation levels. SEM is shown, n = 7. (b) Cytotoxicity levels were assessed by cell-impermeable fluorescent dye bis-AAF-R110. SEM is shown, n = 5. (c) Viability was assessed by cell-permeable fluorescent dye GF-AFC (glycyl-phenylalanyl-aminofluorocoumarin). SEM is shown, n = 5. (d) Following addition of purified FH (1 µl/ml), viability was assessed by cell-permeable fluorescent dye GF-AFC (glycyl-phenylalanyl-aminofluorocoumarin). SEM is shown, n = 3. A.U. arbitrary units. Significance was assessed by Student’s t-test (single effect) and two-way ANOVA (combined effects) as described in the methods section. *p < 0.05, **p < 0.01.
Figure 3
Figure 3
FH loss impairs glycolysis in RPE cells. (a) Schematic representation of glycolysis and steps targeted during Seahorse analyses (1,2,3). (b) hTERT-RPE1 cells were seeded, let attach overnight and silenced for 24 hours with negative control (siNeg) or CFH specific (siCFH) siRNA. 30,000 cells were transferred to Seahorse plates overnight and pre-treated for 90 minutes with 200 µM H2O2 or PBS. Curves show extracellular acidification rate (ECAR) measured after 48 hours. SEM is shown, n = 4–8. Arrows indicate injection of glucose (1), oligomycin (2) and 2-deoxyglucose (2-DG,3). (c–e) Parameters of glycolytic function are calculated from data shown in (b) and are expressed as total values for the 3 measurements (15 minutes). Basal glycolysis (c), glycolytic capacity (d) and glycolytic reserve (e). Significance was assessed by Student’s t-test (single effect) and two-way ANOVA (combined effects) as described in the methods section. *p < 0.05, **p < 0.01, ***p < 0.001.
Figure 4
Figure 4
FH modulates glucose uptake and expression of glucose metabolism genes. hTERT-RPE1 cells were seeded, let attach overnight and silenced for 24 hours with negative control (siNeg) or CFH specific (siCFH) siRNA. Cells were exposed for 90 minutes to 200 µM H2O2 or PBS. (a) Glucose uptake was measured 48 hours after H2O2 pre-treatment in siNeg control cells and in siCFH cells. SEM is shown, n = 3. (b) gene expression analysis by qRT-PCR of glucose transporter 1 (GLUT1/SLC2A1) and glycolysis enzyme gene lactate dehydrogenase A (LDHA). SEM is shown, n = 3. Data are normalized to housekeeping gene PRPL0 using Δ ΔCt method. Significance was assessed by Student’s t-test (single effect) and two-way ANOVA (combined effects) as described in the methods section *p < 0.05.
Figure 5
Figure 5
FH loss impairs mitochondrial respiration in RPE cells. (a) Schematic representation of oxidative phosphorylation chain and targeted steps during Seahorse analyses (1,2,3) (b) hTERT-RPE1 cells were seeded, let attach overnight and silenced for 24 hours with negative control (siNeg) or CFH specific (siCFH) siRNA. 30.000 cells were transferred to seahorse plates overnight and pre-treated for 90 minutes with 200 µM H2O2 or PBS. Curves show oxygen consumption rate (OCR) measured after 48 hours in hTERT-RPE1. SEM is shown, n = 4–8. Arrows indicate injection of oligomycin (1), FCCP (2) and antimycin and rotenone (3). (c–e) Parameters of mitochondrial function are calculated from data shown in (b) and are expressed as total values for the 3 measurements (15 minutes). Basal respiration (c), maximal respiration (d) and reserve respiratory capacity (e). Significance was assessed by Student’s t-test (single effect) and two-way ANOVA (combined effects) as described in the methods section *p < 0.05.
Figure 6
Figure 6
FH modulates expression of mitophagy and mitochondria dynamics genes. hTERT-RPE1 cells were seeded, left to attach overnight and silenced for 24 hours with negative control (siNeg) or CFH specific (siCFH) siRNA. Cells were exposed for 90 minutes to 200 µM H2O2 or PBS and RNA was collected after 48 hours. (a) gene expression analysis by qRT-PCR of genes involved in mitophagy processes: PTEN Induced Kinase 1 (PINK1) and E3 Ubiquitin-Protein Ligase Parkin (PARKIN) SEM is shown, n = 3. (b) Gene expression analysis by qRT-PCR of genes involved in mitochondria dynamics: OPA1 Mitochondrial Dynamin Like GTPase (OPA1) and Dynamin-Related Protein 1 (DRP1). SEM is shown, n = 3. Data are normalized to housekeeping gene PRPL0 using Δ ΔCt method. Significance was assessed by Student’s t-test *p < 0.05, **p < 0.01.
Figure 7
Figure 7
Schematic representation of RPE cell behaviour in presence (left panel) and absence (right panel) of Factor H (FH).

Similar articles

Cited by

References

    1. Strauss O. The retinal pigment epithelium in visual function. Physiol Rev. 2005;85:845–881. doi: 10.1152/physrev.00021.2004. - DOI - PubMed
    1. Quillen DA. Common causes of vision loss in elderly patients. Am Fam Physician. 1999;60:99–108. - PubMed
    1. van Lookeren Campagne M, LeCouter J, Yaspan BL, Ye W. Mechanisms of age-related macular degeneration and therapeutic opportunities. The Journal of Pathology. 2014;232:151–164. doi: 10.1002/path.4266. - DOI - PubMed
    1. Armstrong RA, Mousavi M. Overview of Risk Factors for Age-Related Macular Degeneration (AMD) J Stem Cells. 2015;10:171–191. - PubMed
    1. Rudolf M, et al. Prevalence and morphology of druse types in the macula and periphery of eyes with age-related maculopathy. Invest Ophthalmol Vis Sci. 2008;49:1200–1209. doi: 10.1167/iovs.07-1466. - DOI - PMC - PubMed

Publication types

MeSH terms