

Impact of chronic HCV treatment on quality of life of patients with metabolic disorders in context of immunological disturbances
- PMID: 32587314
- PMCID: PMC7316785
- DOI: 10.1038/s41598-020-67296-9
Impact of chronic HCV treatment on quality of life of patients with metabolic disorders in context of immunological disturbances
Abstract
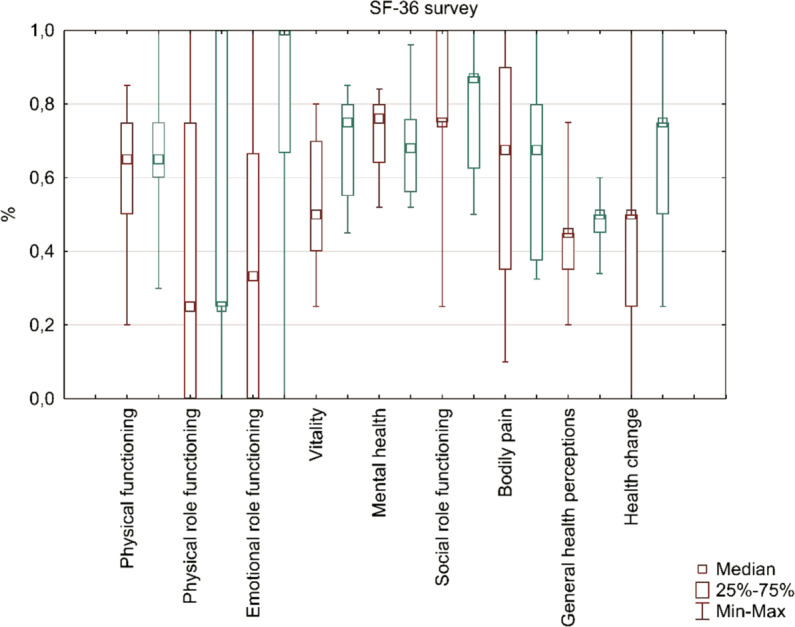
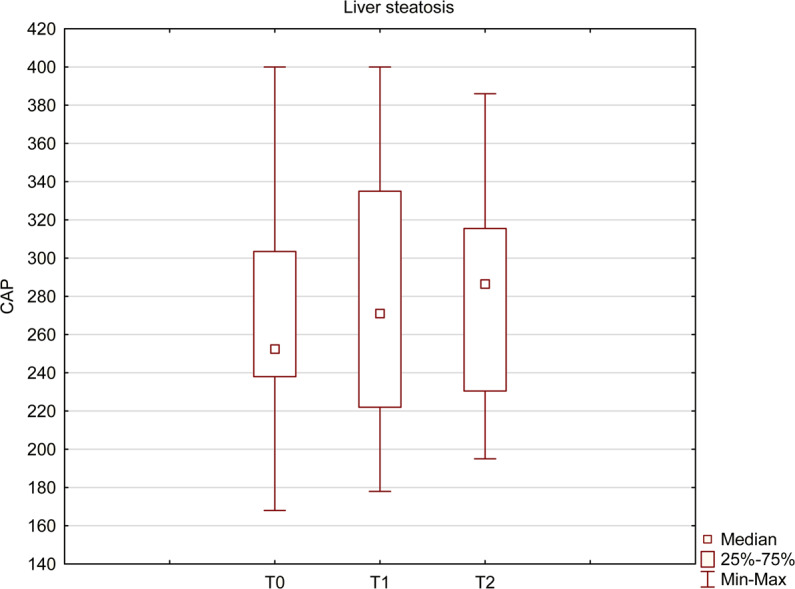
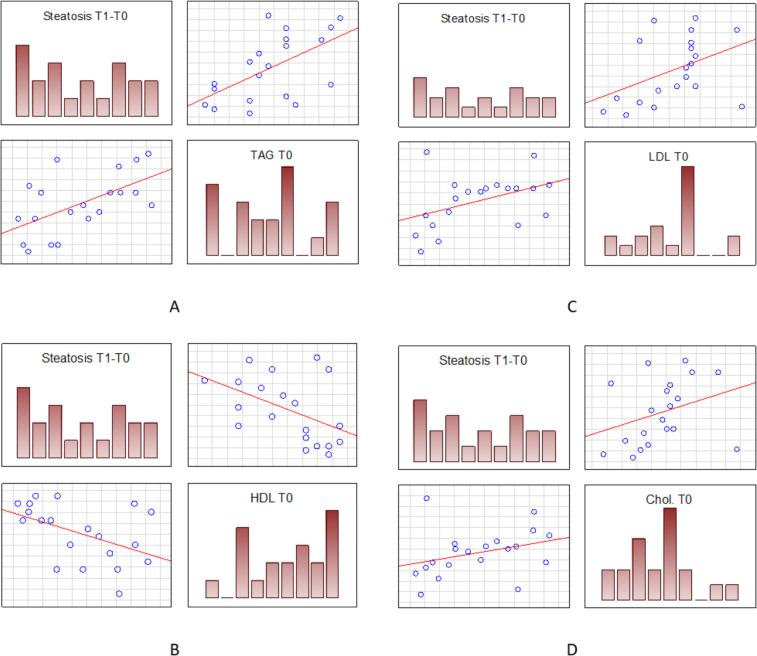
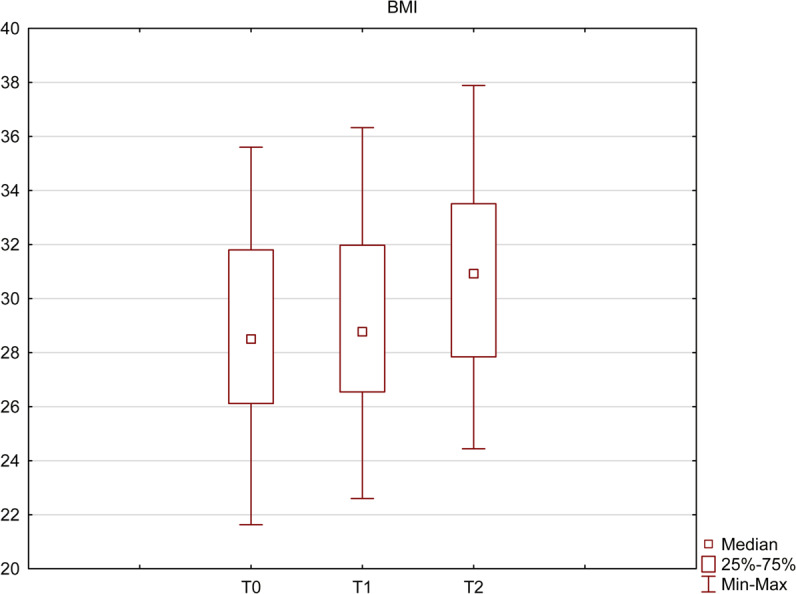
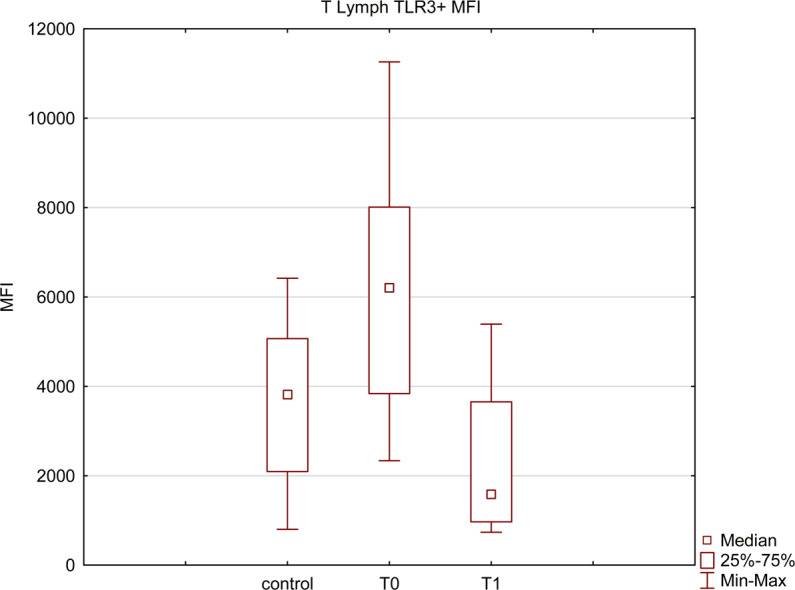
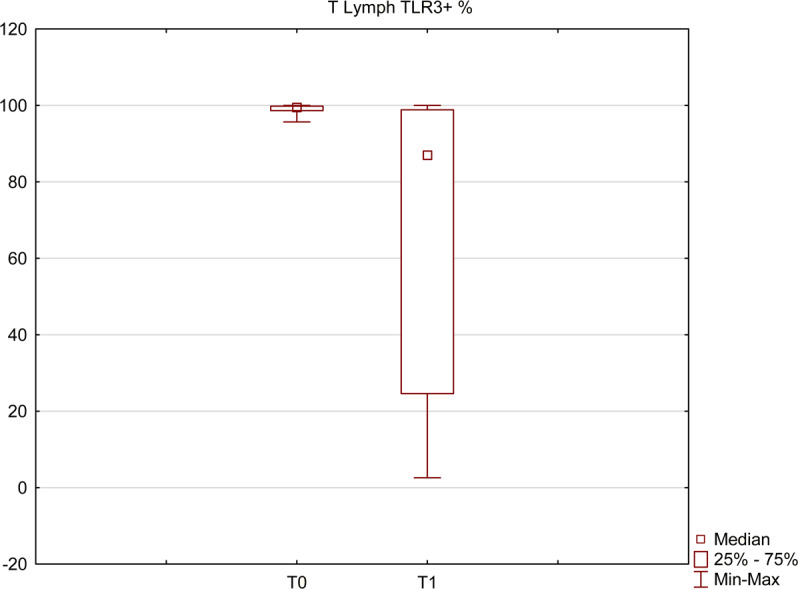
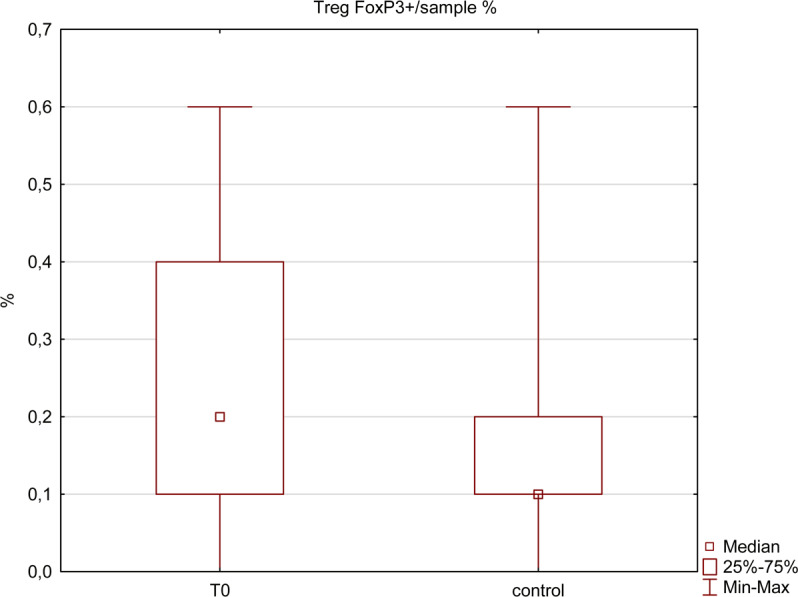
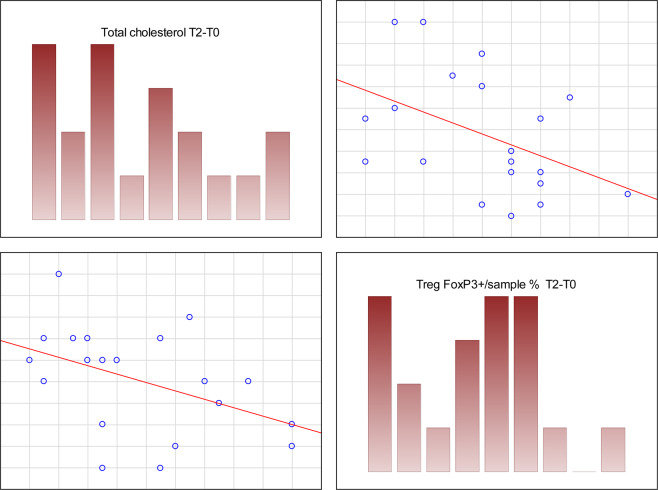
Chronic viral hepatitis C (CHC) and its complications have a negative effect on patient's quality of life. We evaluated the impact of a successful interferon-free treatment on the quality of life of patients with obesity and metabolic disorders in the context of immunological disturbances. Twenty overweight or obese (BMI > 25) patients with CHC were tested before the therapy and after a successful treatment regimen. After the therapy, patient's emotional well-being improved (p = 0.02), while physical well-being remained unchanged. There was a decrease of patient's liver fibrosis and an increase of steatosis along with body mass. Among HCV-infected individuals, the expression of toll-like receptor 3 (TLR3) on lymphocytes was higher than in the control group (p = 0.03), but it decreased (p = 0.001) after the treatment. There was also a decrease of the intensity of immunofluorescence of FoxP3+ after the treatment (p = 0.04). Our study showed an improvement in mental aspects of patient's quality of life after the treatment. Unfortunately, probably due to rapid immunological changes, patient's BMI, serum cholesterol levels and hepatic steatosis have a tendency to increase and may lead to cardiovascular and other complications, like hepatocellular carcinoma.
Conflict of interest statement
The authors declare no competing interests.
Figures
Similar articles
-
Clinical implications of hepatic steatosis in patients with chronic hepatitis C: a multicenter study of U.S. veterans.Dig Dis Sci. 2007 Feb;52(2):570-8. doi: 10.1007/s10620-006-9418-4. Epub 2007 Jan 17. Dig Dis Sci. 2007. PMID: 17226072 Clinical Trial.
-
Sustained virological response: a milestone in the treatment of chronic hepatitis C.World J Gastroenterol. 2013 May 14;19(18):2793-8. doi: 10.3748/wjg.v19.i18.2793. World J Gastroenterol. 2013. PMID: 23687416 Free PMC article.
-
Prevalence and impact of hepatic steatosis on the response to antiviral therapy in Saudi patients with genotypes 1 and 4 chronic hepatitis C.Dig Dis Sci. 2011 Apr;56(4):1222-8. doi: 10.1007/s10620-010-1417-9. Epub 2010 Oct 8. Dig Dis Sci. 2011. PMID: 20931285
-
Hepatic steatosis and hepatitis C: Still unhappy bedfellows?J Gastroenterol Hepatol. 2011 Jan;26 Suppl 1:96-101. doi: 10.1111/j.1440-1746.2010.06542.x. J Gastroenterol Hepatol. 2011. PMID: 21199519 Review.
-
Hepatitis C virus-specific cytotoxic T cell response restoration after treatment-induced hepatitis C virus control.World J Gastroenterol. 2015 Mar 28;21(12):3480-91. doi: 10.3748/wjg.v21.i12.3480. World J Gastroenterol. 2015. PMID: 25834312 Free PMC article. Review.
Cited by
-
Impact of a minimal monitoring HCV treatment approach on Health-Related Quality of Life.Qual Life Res. 2025 Jun;34(6):1683-1694. doi: 10.1007/s11136-025-03922-1. Epub 2025 Feb 28. Qual Life Res. 2025. PMID: 40019678
-
Gender as a factor affecting NK cell activity in patients successfully treated for chronic hepatitis C with direct-acting antivirals.Cent Eur J Immunol. 2021;46(4):481-491. doi: 10.5114/ceji.2021.109846. Epub 2021 Dec 6. Cent Eur J Immunol. 2021. PMID: 35125947 Free PMC article.
-
Metabolic aspects of hepatitis C virus.World J Gastroenterol. 2022 Jun 14;28(22):2429-2436. doi: 10.3748/wjg.v28.i22.2429. World J Gastroenterol. 2022. PMID: 35979265 Free PMC article. Review.
-
Chronic hepatitis D associated with worse patient-reported outcomes than chronic hepatitis B.JHEP Rep. 2021 Mar 17;3(3):100280. doi: 10.1016/j.jhepr.2021.100280. eCollection 2021 Jun. JHEP Rep. 2021. PMID: 34041466 Free PMC article.
-
Treg cells in the course of chronic hepatitis C virus infection partially normalize in longitudinal observation after successful DAA treatment regardless of hepatic fibrosis stage.Clin Exp Hepatol. 2021 Jun;7(2):196-204. doi: 10.5114/ceh.2021.107122. Epub 2021 Jun 30. Clin Exp Hepatol. 2021. PMID: 34295988 Free PMC article.
References
-
- WHO | Guidelines for the screening, care and treatment of persons with chronic hepatitis C infection. WHO (2016). - PubMed
Publication types
MeSH terms
Substances
LinkOut - more resources
Full Text Sources
Medical
