. 2020 Jun 25;3(1):329.
doi: 10.1038/s42003-020-1051-9.

Analysis of genetically independent phenotypes identifies shared genetic factors associated with chronic musculoskeletal pain conditions

Affiliations

Analysis of genetically independent phenotypes identifies shared genetic factors associated with chronic musculoskeletal pain conditions

Yakov A Tsepilov et al. Commun Biol. .

Abstract

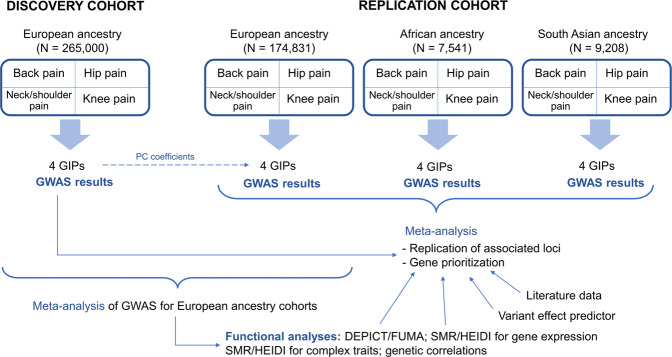
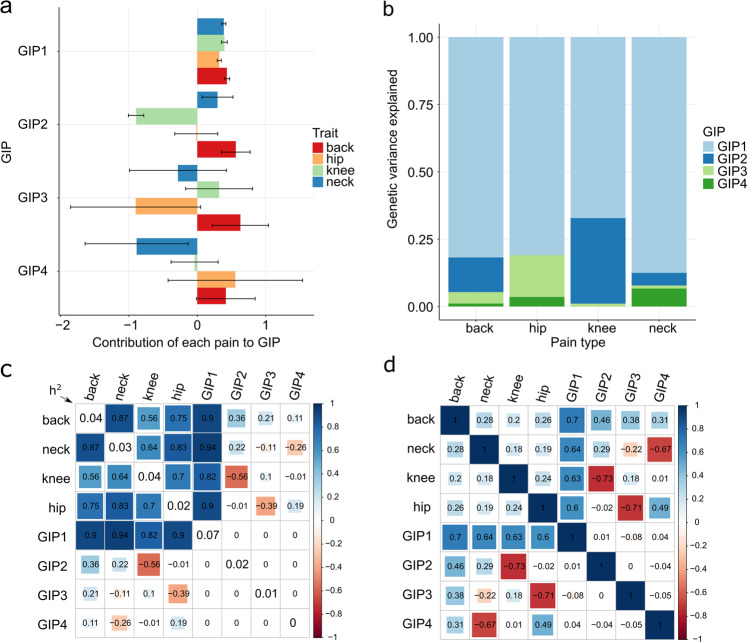
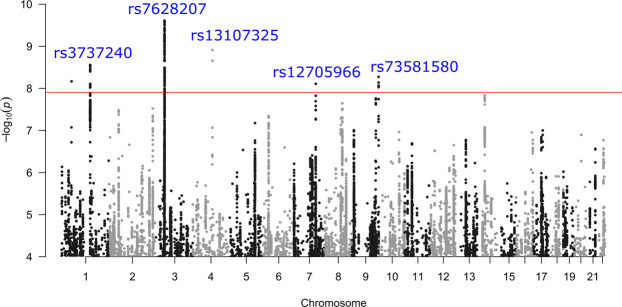
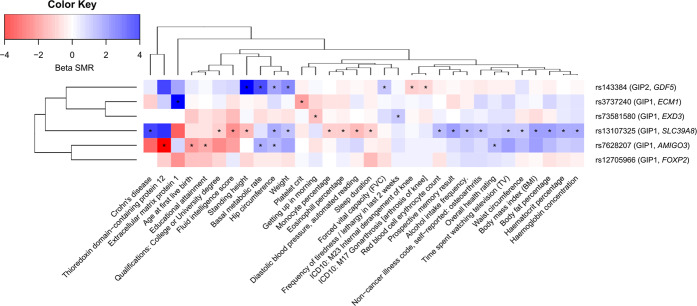
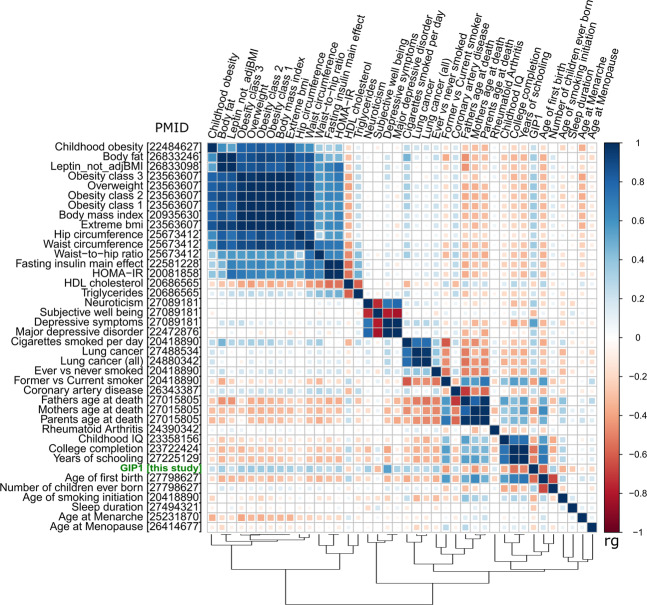
Chronic musculoskeletal pain affects all aspects of human life. However, mechanisms of its genetic control remain poorly understood. Genetic studies of pain are complicated by the high complexity and heterogeneity of pain phenotypes. Here, we apply principal component analysis to reduce phenotype heterogeneity of chronic musculoskeletal pain at four locations: the back, neck/shoulder, hip, and knee. Using matrices of genetic covariances, we constructed four genetically independent phenotypes (GIPs) with the leading GIP (GIP1) explaining 78.4% of the genetic variance of the analyzed conditions, and GIP2-4 explain progressively less. We identified and replicated five GIP1-associated loci and one GIP2-associated locus and prioritized the most likely causal genes. For GIP1, we showed enrichment with multiple nervous system-related terms and genetic correlations with anthropometric, sociodemographic, psychiatric/personality traits and osteoarthritis. We suggest that GIP1 represents a biopsychological component of chronic musculoskeletal pain, related to physiological and psychological aspects and reflecting pain perception and processing.


Conflict of interest statement

Y.S.A. and L.C.K. declare the following competing interests: Y.S.A. and L.C.K. are owners of Maatschap PolyOmica and PolyKnomics B.V., private organizations, providing services, research and development in the field of computational and statistical, and quantitative and computational (gen)omics. Y.A.T., M.B.F., A.S.S., S.Z.S., E.E.E., J.Z., P.S., and F.M.K.W. declare no competing interests.

Figures

Fig. 1
Fig. 1. Overview of the study.
European ancestry individuals provided the matrix of genetic covariances and orthogonal transformation coefficients. The four chronic musculoskeletal pain phenotypes were decomposed into four GIPs. Orthogonal transformation coefficients were further used to construct GIPs in the replication cohorts of European, African, and South Asian ancestry individuals. For each GIP, GWAS results were obtained. Replication of associations and in silico functional analyses were based on the meta-analyses of GWAS for the replication cohorts and European ancestry cohorts, respectively. For replicated loci, the most likely causal genes were prioritized. DEPICT Data-driven Expression Prioritized Integration for Complex Traits framework, GIP genetically independent phenotype, PC principal components, SMR/HEIDI Summary data-based Mendelian Randomization analysis followed by the Heterogeneity in Dependent Instruments test, FUMA Functional Mapping and Annotation of Genome-Wide Association Studies platform.
Fig. 2
Fig. 2. Genetically independent phenotypes (GIP) for chronic musculoskeletal pain.
a Barplots depicting the contribution of the four chronic musculoskeletal pain traits to each GIP. The bars represent orthogonal transformation coefficients, and the whiskers indicate their 95% confidence intervals. The violin plots depicting the empirical distribution of the coefficients of orthogonal transformation are presented in Supplementary Fig. 1. b Genetic variance of the studied chronic musculoskeletal pain explained by four GIPs. c. Estimated matrix of genetic correlations between the four chronic musculoskeletal pain phenotypes and GIPs. The diagonal elements represent LD Score regression estimates of SNP-based heritability (h2) on the observed scale for each trait. d Matrix of phenotypic correlations between the four chronic musculoskeletal pain phenotypes and GIPs (estimated for pain phenotypes and predicted for GIPs, details are given in Supplementary Methods). Estimates for c, d were obtained using the discovery cohort of European ancestry individuals (N = 265,000).
Fig. 3
Fig. 3. Graphical summary of the discovery GWAS results for GIP1 (European ancestry individuals, N = 265,000).
Negative logarithms of P-values are presented after the genomic control correction using LD Score regression intercept. Only associations with P < 1.0e-04 are shown. Red line corresponds to the genome-wide significance threshold of P = 1.25e-08 (5.0e-08/4, where 4 is the number of GIPs). Replicated loci are annotated.
Fig. 4
Fig. 4. Pleiotropic effects of identified loci on human complex traits.
Color depicts the sign and the magnitude of SMR beta coefficient. Negative sign (red) means opposed effects on the corresponding GIP and the trait, and positive sign (blue) means the same direction of effect. |beta SMR | > 4 are depicted as |beta SMR | = 4. For “Prospective memory result” and “Overall health rating” trait, high scores correspond to poor performance. For “Getting up in morning” trait, high score corresponds to easy getting up. Traits that passed both SMR and HEIDI tests (PSMR < 3.71e-06 and PHEIDI ≥ 0.01) are marked with an asterisk. Data on 45 out of 78 revealed traits are not shown. Full results are given in Supplementary Data 10. GIPs associated with the loci and genes nearest to lead SNPs are indicated in parentheses. Dendrograms represent clustering based on complete linkage hierarchical clustering method.
Fig. 5
Fig. 5. Matrix of genetic correlations between GIP1 and human complex traits.
Color depicts the sign and absolute value of the genetic correlation coefficients (rg). Genetic correlations between GIP1 and all presented traits were statistically significant (P < 5.98e-05). Osteoarthritis is not shown on this plot since genetic correlations analysis for this trait was performed using the GWAS-MAP platform, whereas for other traits, LD hub web interface was used. Matrix of genetic correlations between GIPs, chronic musculoskeletal pain traits and osteoarthritis is provided in Supplementary Fig. 6. HDL high density lipoprotein, HOMA-IR Homeostatic Model Assessment for Insulin Resistance, PMID PubMed ID number of the literature source providing GWAS summary statistics.

References

    1. Breivik H, Collett B, Ventafridda V, Cohen R, Gallacher D. Survey of chronic pain in Europe: prevalence, impact on daily life, and treatment. Eur. J. Pain. 2006;10:287–287. - PubMed
    1. Saxena AK, Jain PN, Bhatnagar S. The prevalence of chronic pain among adults in India. Indian J. Palliat. Care. 2018;24:472–477. - PMC - PubMed
    1. Jackson T, et al. Prevalence of chronic pain in low-income and middle-income countries: a systematic review and meta-analysis. Lancet. 2015;385:S10. - PubMed
    1. Crofford LJ. Chronic pain: where the body meets the brain. Trans. Am. Clin. Climatol. Assoc. 2015;126:167–183. - PMC - PubMed
    1. Dieppe P. Chronic musculoskeletal pain. BMJ. 2013;346:f3146. - PubMed

Publication types

MeSH terms