. 2020 Jun 25;3(1):318.
doi: 10.1038/s42003-020-1044-8.

Single-cell sequencing of genomic DNA resolves sub-clonal heterogeneity in a melanoma cell line

Affiliations

Single-cell sequencing of genomic DNA resolves sub-clonal heterogeneity in a melanoma cell line

Enrique I Velazquez-Villarreal et al. Commun Biol. .

Abstract

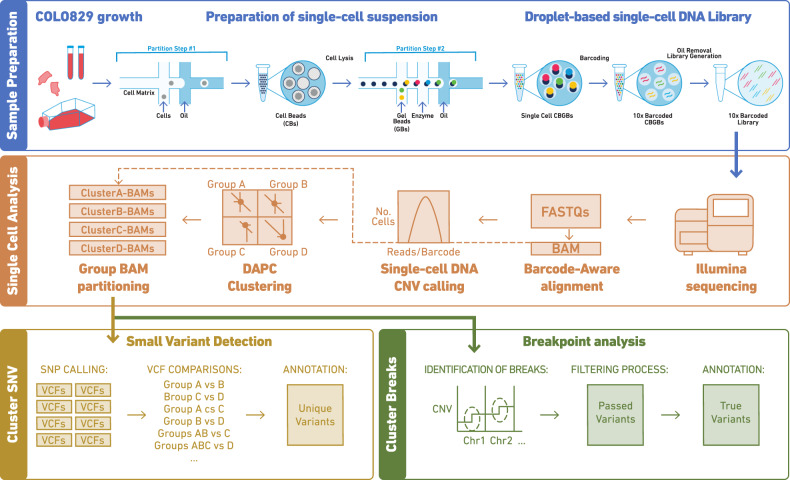
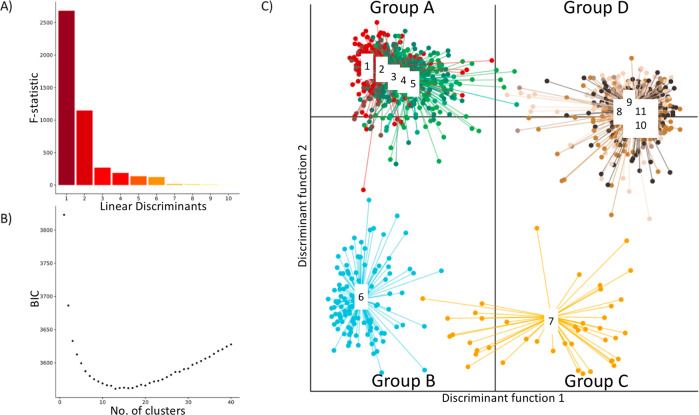
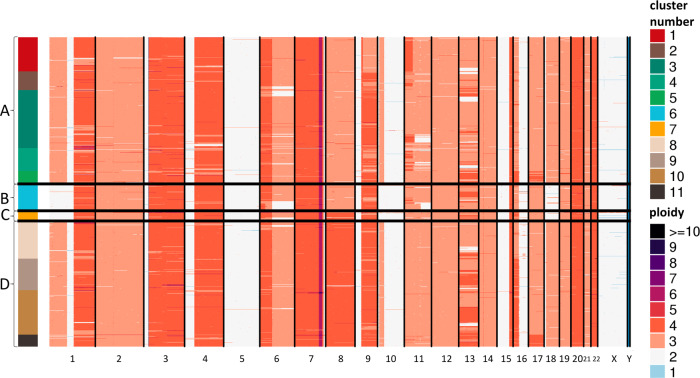
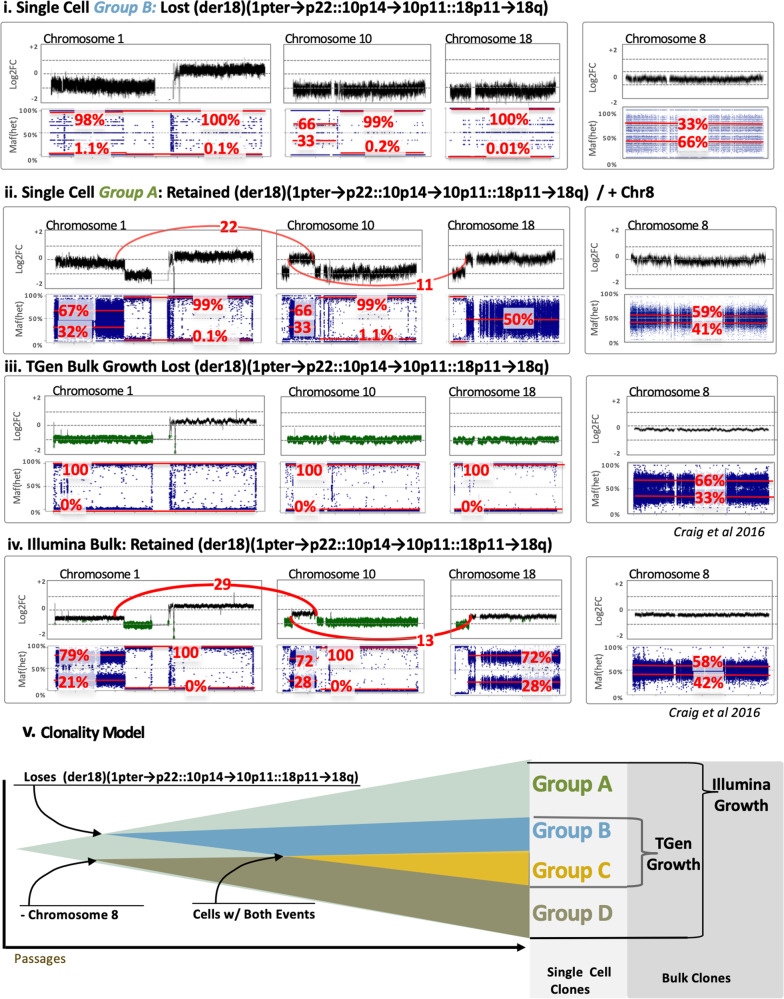
We performed shallow single-cell sequencing of genomic DNA across 1475 cells from a cell-line, COLO829, to resolve overall complexity and clonality. This melanoma tumor-line has been previously characterized by multiple technologies and is a benchmark for evaluating somatic alterations. In some of these studies, COLO829 has shown conflicting and/or indeterminate copy number and, thus, single-cell sequencing provides a tool for gaining insight. Following shallow single-cell sequencing, we first identified at least four major sub-clones by discriminant analysis of principal components of single-cell copy number data. Based on clustering, break-point and loss of heterozygosity analysis of aggregated data from sub-clones, we identified distinct hallmark events that were validated within bulk sequencing and spectral karyotyping. In summary, COLO829 exhibits a classical Dutrillaux's monosomic/trisomic pattern of karyotype evolution with endoreduplication, where consistent sub-clones emerge from the loss/gain of abnormal chromosomes. Overall, our results demonstrate how shallow copy number profiling can uncover hidden biological insights.


Conflict of interest statement

The following authors were employees of 10X Genomics while engaged in the research project: S.M., J.S., I.T.F., V.K., Y.Y., and C.C. The rest of the authors do not have competing interests: E.I.V., J.D.C., D.W.C., M.G., P.A.E., and M.W.

Figures

Fig. 1
Fig. 1. Workflow of the single-cells sample and data processing.
a Sample preparation of the chromium technology. b Single-cell analysis. Data processing from sample sequencing to BAM partitioning. c Data analysis including variant detection and breakpoint analyses.
Fig. 2
Fig. 2. Clustering of COLO829 single-cells using Discriminant Analysis of Principal Components (DAPC).
a Bar plot of eigenvalues, which corresponds to the ratio of the variance between groups over the variance within groups for each discriminant function. b Inference of optimal cluster number using Bayesian Information Criterion (BIC). c Scatterplots showing the inference of population structure in 1373 cells using the first two principal components of the DAPC analysis. Individual dots represent single-cells and the color represents cluster assignment.
Fig. 3
Fig. 3. single-cell copy number heatmap of COLO829.
Heatmap showing hierarchical clustering of 1,373 single-cell CNV profiles at 2 Mb resolution. Each row depicts the whole genome of a single-cell, colors (Group A: clusters 1–5 [red, brown, greens], Group B: cluster 6 [blue], Group C: cluster 7 [yellow], Group D: clusters 8–11 [browns]) represent the called ploidy as specified by the legend on the right and rows are clustered by groups (Group A: 653 cells, Group B: 117 cells, Group C: 43 cells, Group D: 560). Hierarchical clustering was performed calculating the distance between each single-cell CNV data to posteriorly join them into groups. The 11 clusters (upper right) were calculated from the inference of optimal cluster number analysis. Ploidy number (lower right) is represented by distinct colors.
Fig. 4
Fig. 4. Log2Fold힓 (upper in each) and Het SNP allele frequency (lower blue in each) for (i) Group B and (ii) Group A, (iii) Illumina Bulk Sample, and (iv) TGen Bulk Sample.
The upper graph of each panel provides an estimated log2 fold change (noting bulk copy number does not inherently produce copy number estimates). For the chromosome 1, 10, and 18 via (p22.3;10p14) and t(p11.22;18p11.22), counts of anomalous reads supporting the junction are shown in red, whereas this event is absent in Group B and C, as well as the TGen Sample. The lower plots of each panel are the allele fraction of known heterozygous SNPs (identified from previous VCFs in the germline lymphocyte lines) for COLO829. Their deviation from the expected 50% allele fraction provides an indication of Loss of Heterozygosity (LOH), where the relative noise is dependent on the number of reads over an SNP and greater spread is observed in groups with fewer reads. The median major/minor allele fractions are provided for each region in red. (v) A Schematic model of the major clones shows a simple model whereby the sub-clones emerge as some cells do not maintain the abnormal chr1p-10q-18q line and/or change in chromosome 8 copy number.

References

    1. Pleasance ED, et al. A comprehensive catalogue of somatic mutations from a human cancer genome. Nature. 2010;463:191–196. doi: 10.1038/nature08658. - DOI - PMC - PubMed
    1. Craig DW, et al. A somatic reference standard for cancer genome sequencing. Sci. Rep. 2016;6:24607. doi: 10.1038/srep24607. - DOI - PMC - PubMed
    1. Cheng J, et al. Single-cell copy number variation detection. Genome Biol. 2011;12:R80. doi: 10.1186/gb-2011-12-8-r80. - DOI - PMC - PubMed
    1. Rantalainen M. Application of single-cell sequencing in human cancer. Brief. Funct. Genomics. 2018;17:273–282. doi: 10.1093/bfgp/elx036. - DOI - PMC - PubMed
    1. Wang Y, et al. Clonal evolution in breast cancer revealed by single nucleus genome sequencing. Nature. 2014;512:155–160. doi: 10.1038/nature13600. - DOI - PMC - PubMed

Publication types