. 2020 Jun 25;10(1):10310.
doi: 10.1038/s41598-020-66221-4.

Transcriptomic differences in MSA clinical variants

Collaborators, Affiliations

Transcriptomic differences in MSA clinical variants

Alexandra Pérez-Soriano et al. Sci Rep. .

Abstract

Background: Multiple system atrophy (MSA) is a rare oligodendroglial synucleinopathy of unknown etiopathogenesis including two major clinical variants with predominant parkinsonism (MSA-P) or cerebellar dysfunction (MSA-C).

Objective: To identify novel disease mechanisms we performed a blood transcriptomic study investigating differential gene expression changes and biological process alterations in MSA and its clinical subtypes.

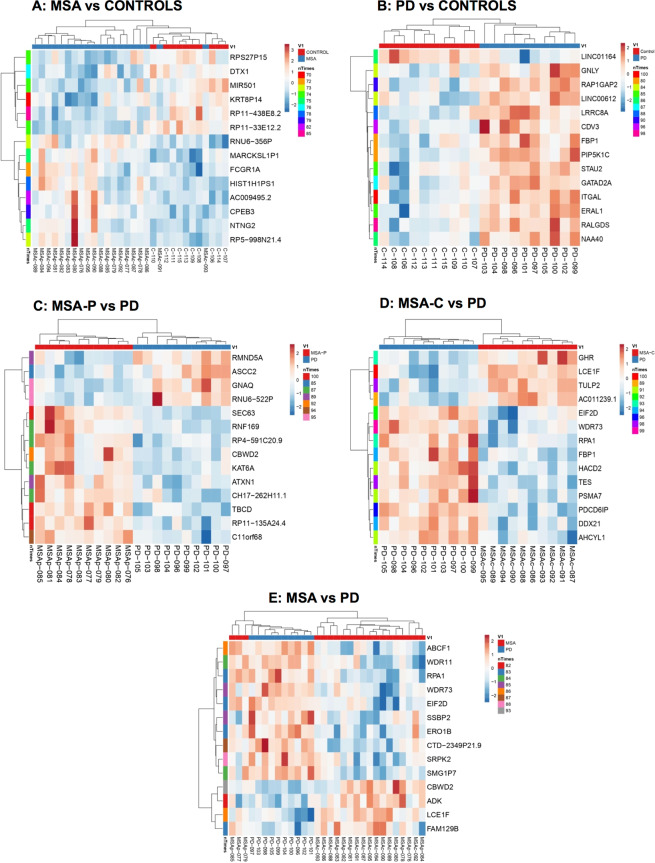
Methods: We compared the transcriptome from rigorously gender and age-balanced groups of 10 probable MSA-P, 10 probable MSA-C cases, 10 controls from the Catalan MSA Registry (CMSAR), and 10 Parkinson Disease (PD) patients.

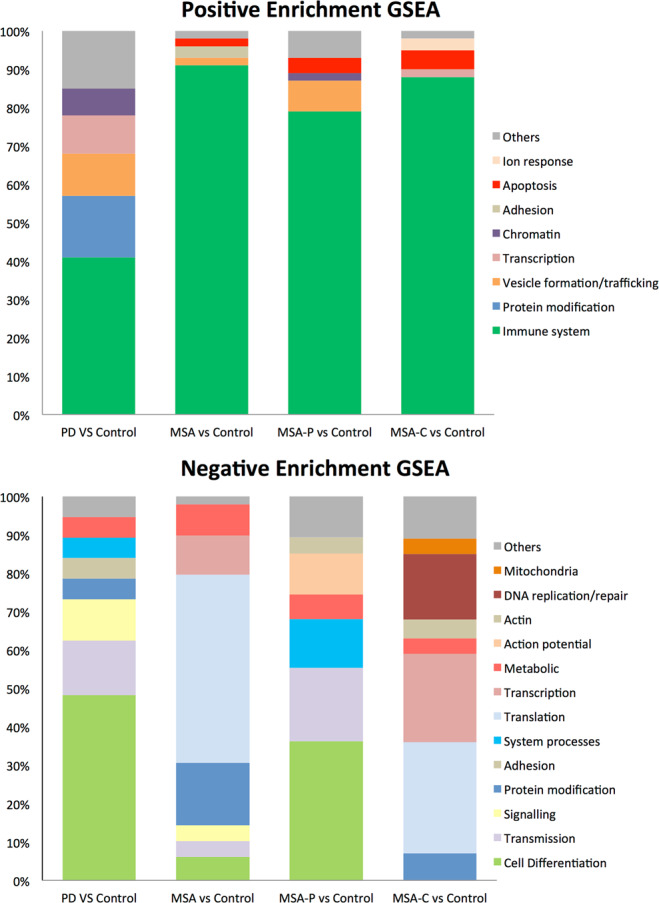
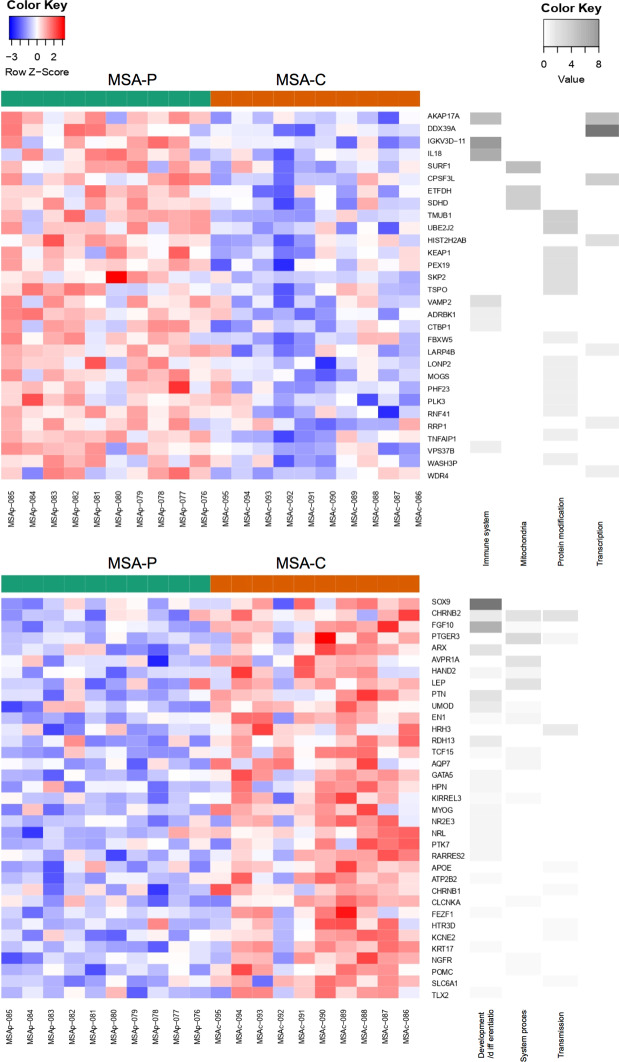
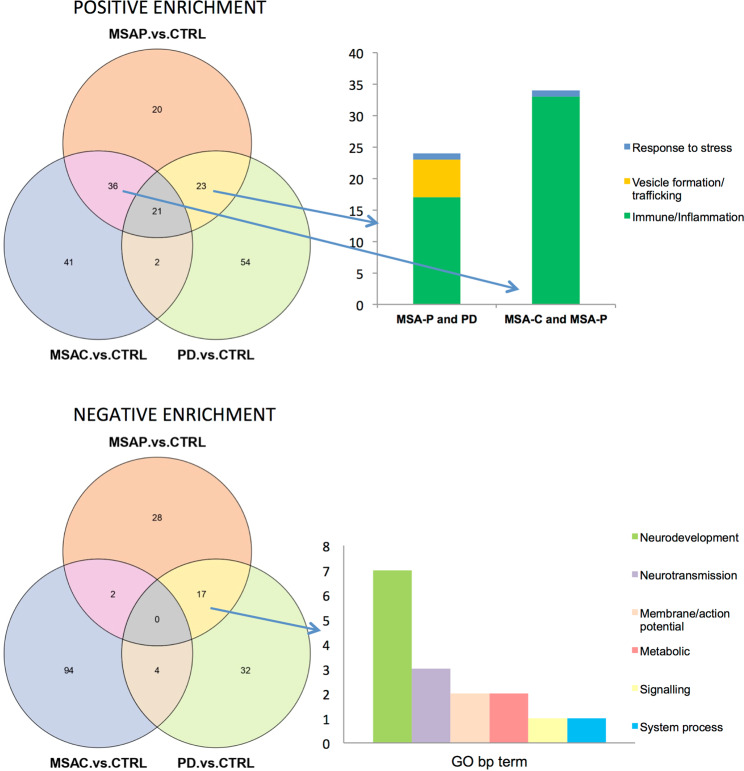
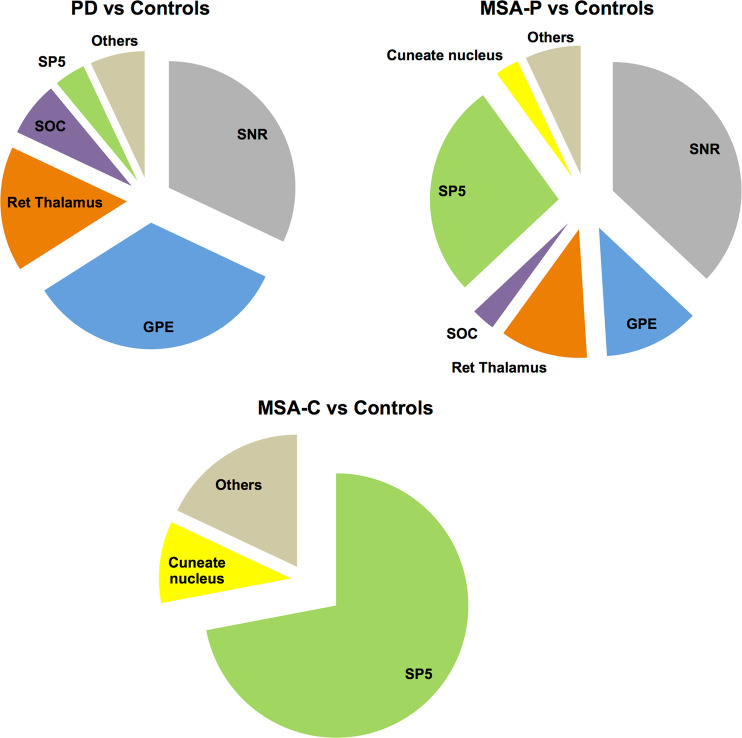
Results: Gene set enrichment analyses showed prominent positive enrichment in processes related to immunity and inflammation in all groups, and a negative enrichment in cell differentiation and development of the nervous system in both MSA-P and PD, in contrast to protein translation and processing in MSA-C. Gene set enrichment analysis using expression patterns in different brain regions as a reference also showed distinct results between the different synucleinopathies.

Conclusions: In line with the two major phenotypes described in the clinic, our data suggest that gene expression and biological processes might be differentially affected in MSA-P and MSA-C. Future studies using larger sample sizes are warranted to confirm these results.


Conflict of interest statement

The authors declare no competing interests.

Figures

Figure 1
Figure 1
Resampling analysis heatmap representations. Heatmap representation of differentially expressed transcript cluster ID (DE TCI) detected across comparisons by resampling analysis (RA) for contrasts MSA vs. Controls (A), PD vs. Controls (B), MSA-P vs. PD (C), MSA-C vs. PD (D), MSA vs. PD (E). N indicates number of iterations a gene was found to be differentially expressed out of 100 iterations. Unsupervised tree ordering for clusters is given by tightest clusters first, with both rows and columns clustered using correlation distance and average linkage. Red shading indicates up-regulation and blue shading indicates down-regulation. Note that when analyzing by clinical phenotype heatmap discrimination improves. PD = Parkinson disease, MSA = Multiple system atrophy (P = Parkinsonian phenotype, C = Cerebellar phenotype).
Figure 2
Figure 2
Gene set enrichment analysis (GSEA). Upper and lower bar graphs represent positive and negative enrichment results for each contrast respectively. Y axis indicates percentage of gene sets related to a specific biological process group depicted with a specific color seen in legend. Results show top 100 sets when applicable ordered by nominal enrichment score selected using cut-off P-value below 0.05.
Figure 3
Figure 3
GSEA analysis in MSA-P vs. MSA-C. Positive enrichment GSEA results comparing MSA-P vs. MSA-C on top and negative enrichment below, represented as heatmaps where green indicates MSA-P cases and orange indicates MSA-C cases, red shading represents up-regulation and blue shading down-regulation. Grey scale heatmap to the left of color heatmap indicates each gene’s corresponding biological processes. Only genes that were related to these specific biological processes have been selected with a cut-off p-value < 0.01. MSA = Multiple system atrophy (P = Parkinsonian phenotype, C = Cerebellar phenotype).
Figure 4
Figure 4
Common GSEA results between both MSA variants and PD. Venn diagrams representing common results of the top 100 gene sets ordered by NES score and selected using a p-value below 0.05. Left bar graph represents the number of gene sets related to a biological process with overlapping results between positive enrichment gene sets of MSA-P and PD cases compared to controls and MSA-P and MSA-C compared to controls and negative enrichment gene sets of MSA-P and PD cases compared to controls. NES = Nominal enrichment score, CTRL = control, PD = Parkinson disease, MSA = Multiple system atrophy (P = Parkinsonian phenotype, C = Cerebellar phenotype), GO = gene ontology, bp= biological process, DE = differentially expressed, PE = positive enrichment, NE = Negative enrichment.
Figure 5
Figure 5
Analysis of DE TCI in MSA in a brain regions context. Pie charts showing proportion of times a brain region was positively enriched in comparison to another brain region in PD vs. Controls, MSA-P vs. Controls, and MSA-C vs. Controls. Note that MSA- P cases show similar regions to PD and region SP5 is significantly enriched in both MSA subtypes. PD = Parkinson disease, MSA = Multiple system atrophy (P = Parkinsonian phenotype, C = Cerebellar phenotype), SP5 = Spinal trigeminal area.

References

    1. Bhidayasiri R, Ling H. Multiple system atrophy. Neurologist. 2008;14:224–37. doi: 10.1097/NRL.0b013e318167b93f. - DOI - PubMed
    1. Ozawa T, et al. The spectrum of pathological involvement of the striatonigral and olivopontocerebellar systems in multiple system atrophy: clinicopathological correlations. Brain. 2004;127:2657–2671. doi: 10.1093/brain/awh303. - DOI - PubMed
    1. Gilman S, et al. Second consensus statement on the diagnosis of multiple system atrophy. Neurology. 2008;71:670–6. doi: 10.1212/01.wnl.0000324625.00404.15. - DOI - PMC - PubMed
    1. Hughes AJ, Daniel SE, Ben-Shlomo Y, Lees AJ. The accuracy of diagnosis of parkinsonian syndromes in a specialist movement disorder service. Brain. 2002;125:861–870. doi: 10.1093/brain/awf080. - DOI - PubMed
    1. Osaki Y, et al. Do published criteria improve clinical diagnostic accuracy in multiple system atrophy? Neurology. 2002;59:1486–91. doi: 10.1212/01.WNL.0000028690.15001.00. - DOI - PubMed

Publication types