Observational Study
. 2020 Jun 25;10(1):10336.
doi: 10.1038/s41598-020-67234-9.

Electrophysiological evidence of preserved hearing at the end of life

Affiliations
Observational Study

Electrophysiological evidence of preserved hearing at the end of life

Elizabeth G Blundon et al. Sci Rep. .

Abstract

This study attempts to answer the question: "Is hearing the last to go?" We present evidence of hearing among unresponsive actively dying hospice patients. Individual ERP (MMN, P3a, and P3b) responses to deviations in auditory patterns are reported for conscious young, healthy control participants, as well as for hospice patients, both when the latter were conscious, and again when they became unresponsive to their environment. Whereas the MMN (and perhaps too the P3a) is considered an automatic response to auditory irregularities, the P3b is associated with conscious detection of oddball targets. All control participants, and most responsive hospice patients, evidenced a "local" effect (either a MMN, a P3a, or both) and some a "global" effect (P3b) to deviations in tone, or deviations in auditory pattern. Importantly, most unresponsive patients showed evidence of MMN responses to tone changes, and some showed a P3a or P3b response to either tone or pattern changes. Thus, their auditory systems were responding similarly to those of young, healthy controls just hours from end of life. Hearing may indeed be one of the last senses to lose function as humans die.


Conflict of interest statement

Dr. Gallagher was a palliative care physician at St. John’s Hospice during the study.

Figures
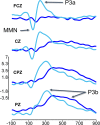
Figure 1
Figure 1
Midline ERPs to tone changes (light blue) and pattern changes (dark blue) runs. P3a is typically maximal over central electrodes (FCZ and CZ), and peaks approximately 200–300 ms post stimulus. The P3b is typically maximal over parietal electrodes (CPZ and PZ), and peaks approximately 300 ms post stimulus; ERP data from ref. .
Figure 2
Figure 2
Stimuli and study design. Stem-down notes are 1000 Hz and stem-up notes are 500 Hz. Flat runs consisted of five pure tones of the same frequency; change runs consisted of four pure tones of the same frequency followed by a fifth tone of a different frequency. Participants each heard four sequences. In two of the sequences participants were instructed to search for rare change runs among common flat runs (A), whereas in the other two sequences participants were instructed to search for rare flat runs among common change runs (B). Rare runs are targets to be detected in the longer sequence of common runs.
Figure 3
Figure 3
Individual differences in ERP and reaction time (RT) responses from control participants (C001-C017) to local tone deviants (left) and global pattern deviants (right). Warm colours (green through red) represent positive deflections in the difference wave for tone and pattern deviants when they were rare targets (rare – common). Cool colours (blue through purple) represent negative deflections in the difference wave for all tone deviants regardless of whether they were common or rare (change – flat). Black represents each participants’ approximate reaction time. Black time points with a plus sign (+) outside the grid represent RTs that were longer than the last time point in the grid. Each row represents a participant (participant ID is listed to the left of each row). MMN (cool colours) and P3a (warm colours) responses were measured from the fronto-central electrode, and P3b (warm colours) responses were measured from the centro-parietal electrode, where the response to the rare run (or change run for MMN) was largest for each participant (see Supplementary Table S1 for the list of electrodes used in this analysis). Only meaningful time point clusters (p < 0.0003 determined from permutations cluster test) within the MMN (0–300 ms) and P300 (200–700 ms) timerange are shown. Colours correspond to the probability (p value) that the difference between rare and common runs (or change and flat runs) at that time point is 0.
Figure 4
Figure 4
Individual differences in ERP responses from both responsive (top panel) and unresponsive hospice participants (P001-P009) to local tone deviants (left) and global pattern deviants (right). Warm colours (green through red) represent positive deflections in the difference wave for tone and pattern deviants when they were rare targets (rare – common). Cool colours (blue through purple) represent negative deflections in the difference wave for all tone deviants regardless of whether they were common or rare (change – flat). Each row represents a participant (participant ID is listed to the left of each row). MMN (cool colours) and P3a (warm colours) responses were measured from the fronto-central electrode, and P3b (warm colours) responses were measured from the centro-parietal electrode, where the response to the rare run was largest for each participant (see Supplementary Table S1 for the list of electrodes used in this analysis). Only meaningful time point clusters (p < 0.0003 determined from permutations cluster test) within the MMN (0–300 ms) and P300 (200–700 ms) time range are shown. Colours correspond to the probability (p value) that the difference between rare and common runs (or change and flat runs) at that time point is 0.
Figure 5
Figure 5
Patient group ERP difference waves and Scalp Maps for responsive (top, n = 8) and unresponsive (bottom, n = 5) patients. Topographic data were averaged across each 100 ms time interval. ERPs were filtered at 10 Hz.
Figure 6
Figure 6
Individual ERPs and Scalp Maps for P008. Topographic data were averaged across each 100 ms time interval. Scalp maps are scaled relative to their own minimum and maximum values. Only ERP difference waves from – 800 ms to 700 ms from the last tone of the run are shown. Difference waves were baseline corrected from −800ms to −600ms from the last tone of the run (i.e. −200 to 0 ms from the first tone of the run) and filtered at 10 Hz. Black bars represent the onset of the first tone of the run (−600ms), red bars represent the onset of the last tone of the run (0 ms).

Similar articles

Cited by

References

    1. Tapson K, Sierotowicz W, Marks-Maran D, Thompson TM. ‘It’s the hearing that is last to go’: a case of traumatic head injury. Br. J. Nurs. 2015;24:277–281. - PubMed
    1. French CC. Near-death experiences in cardiac arrest survivors. Prog. Brain Res. 2005;150:351–367. - PubMed
    1. Greyson B. Dissociation in people who have near-death experiences: out of their bodies or out of their minds? The Lancet. 2000;355:460–463. - PubMed
    1. Parnia S, Fenwick P. Near death experiences in cardiac arrest: visions of a dying brain or visions of a new science of consciousness. Resuscitation. 2002;52:5–11. - PubMed
    1. Parnia S, Waller DG, Yeates R, Fenwick P. A qualitative and quantitative study of the incidence, features and aetiology of near death experiences in cardiac arrest survivors. Resuscitation. 2001;48:149–156. - PubMed

Publication types