. 2020 Jun 25;10(1):10339.
doi: 10.1038/s41598-020-67182-4.

Chronic unpredictable stress induces anxiety-like behaviors in young zebrafish

Affiliations

Chronic unpredictable stress induces anxiety-like behaviors in young zebrafish

Archana Golla et al. Sci Rep. .

Abstract

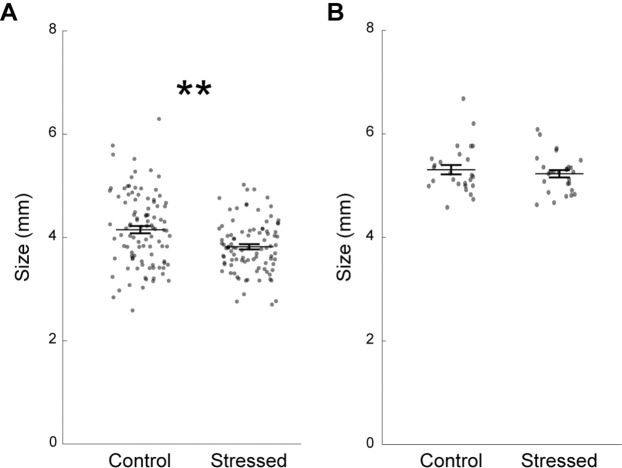
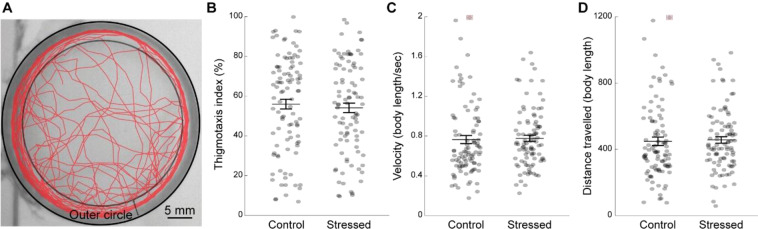
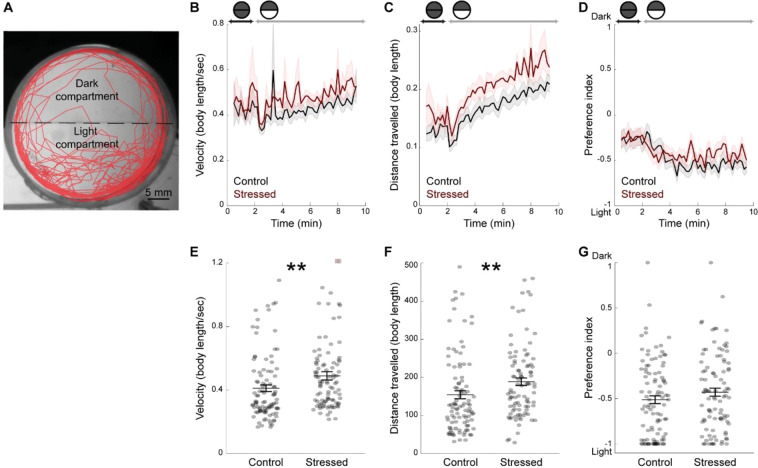
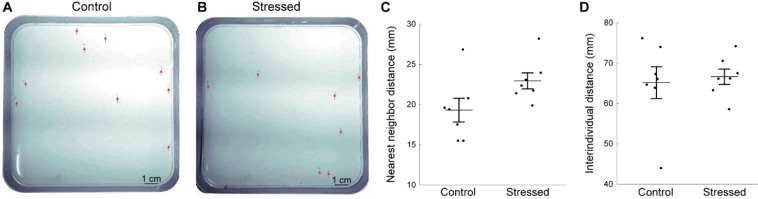
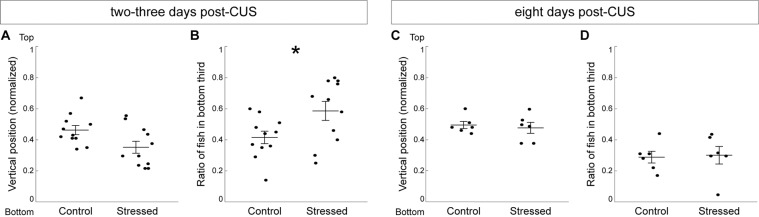
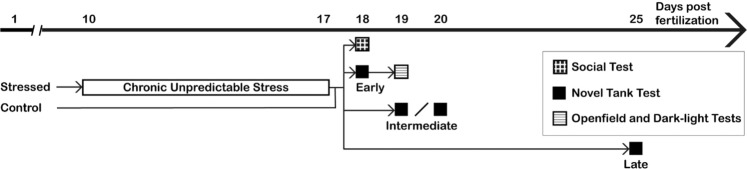
Exposure to stress during early life affects subsequent behaviors and increases the vulnerability to adult pathologies, a phenomenon that has been well documented in humans and rodents. In this study, we introduce a chronic unpredictable stress protocol adapted to young zebrafish, which is an increasingly popular vertebrate model in neuroscience research. We exposed zebrafish to a series of intermittent and unpredictable mild stressors from day 10 to 17 post-fertilization. The stressed fish showed a reduced exploration of a novel environment one day post-stress and an increased responsiveness to dark-light transition two days post-stress, indicative of heightened anxiety-related behaviors. The stress-induced decrease in exploration lasted for at least three days and returned to control levels within one week. Moreover, stressed fish were on average 8% smaller than their control siblings two days post-stress and returned to control levels within one week. All together, our results demonstrate that young zebrafish exposed to chronic unpredictable stress develop growth and behavioral alterations akin to those observed in rodent models.


Conflict of interest statement

The authors declare no competing interests.

Figures

Figure 1
Figure 1
Stressed zebrafish are smaller two days post-CUS, but return to normal size within a week. (A) Fish size at 19 dpf (control: n = 99 fish; stressed: n = 94 fish). (B) Fish size at 25 dpf in a different set of fish (control: n = 27 fish; stressed: n = 26 fish). Each dot represents a fish. Data are represented as mean ± SEM. **p < 0.01, Kruskal-Wallis test.
Figure 2
Figure 2
CUS exposure does not affect anxiety-like behaviors two days post-CUS in the open field test. (A) Representative swimming trajectory of a fish (in red) during the open field test lasting for ten minutes. The outer circle is indicated by two concentric black circles. (B) Thigmotaxis index that corresponds to the percentage of time spent in the outer circle. (C) Average swimming velocity in body length/second. The dot signaled by a red square was out of range (value = 2.78). (D) Total distance travelled for ten minutes in body length. The dot signaled by a red square was out of range (value = 1669). Each dot represents one fish (control: n = 99 fish; stressed: n = 94 fish). Data are represented as mean ± SEM.
Figure 3
Figure 3
No change in light preference, but increased light-induced locomotion two days post-CUS, in CUS-exposed fish. (A) Representative swimming trajectory (in red) of a 19 dpf fish during the dark-light test. Fish were initially maintained in the dark for two minutes (dark phase). Upon the start of illumination (light phase), they had the choice between a dark and a light compartment for eight minutes. (B) Average velocity during the dark and light phases, per time bins of twelve seconds, in body length/second. (C) Average distance travelled during the dark and light phases, per time bins of twelve seconds, in body length. (D) Preference index over time, during the dark and light phases, calculated per time bins of twelve seconds. (E) Average velocity of the fish during the light phase. The dot signaled by a red square was out of range (value = 2.07). (F) Total distance travelled by the fish during the light phase. (G) Preference index for the dark or the light compartments during the light phase. Values of −1 indicate 100% time spent in the light compartment and values of 1 indicate 100% time spent in the dark compartment. Each dot represents one fish (control: n = 99 fish; stressed: n = 94 fish). Data are represented as mean ± SEM. **p < 0.01, Kruskal-Wallis test.
Figure 4
Figure 4
Decreased exploration of the novel tank in stressed fish tested one day post-CUS. (A) Representative image showing control fish’s position in the arena at the beginning of the novel tank test. The arena is vertically positioned and the dashed line at the top indicates the water surface. The red arrows indicate the fish, and the the bottom third of the tank is indicated. (B) Representative image showing stressed fish’s position at the beginning of the novel tank test. (C) Average vertical position of all fish during the early phase of the novel tank test (see Methods). (D) Ratio of fish in the bottom third of the tank. (E) Representative image showing control fish’s position relative to each other in the late phase (from three to ten minutes) of the novel tank test, in the same group as in A. The black line indicates the distance from a fish to its nearest neighbor (NND). The grey lines indicate the distance between one fish to the other fish in the tank that are used for interindividual distance (IID) calculations. (F) Representative image showing stressed fish’s position in the late phase of the novel tank test, in the same group as in (B). (G) Average nearest neighbor distance for all fish in the arena from three to ten minutes. (H) Average interindividual distance for all fish in the arena from three to ten minutes. Each dot represents the average value for one group of fish (control: n = 9 groups; stressed: n = 10 groups). Data are represented as mean ± SEM. *p < 0.05, Student’s t-test.
Figure 5
Figure 5
CUS exposure does not affect shoaling. Shoaling was measured for twenty minutes in a horizontal arena. (A) Representative image of the position of control fish relative to each other. (B) Representative image of the position of stressed fish relative to each other. Red arrows indicate the fish’s positions. (C) Average nearest neighbor distance for all fish in the arena. (D) Average interindividual distance for all fish in the arena. Each dot represents the average value for a group of fish (control: n = 7 groups; stressed: n = 7 groups). Data are represented as mean ± SEM.
Figure 6
Figure 6
Decreased exploration of the novel tank persists three days post-CUS and returns to control level within a week. (A) Average vertical position in the novel tank test at two-three days post-CUS. (B) Ratio of fish in the bottom third at two-three days post-CUS (control: n = 11 groups; stressed: n = 11 groups). (C) Average vertical position in the novel tank test eight days post-CUS. (D) Ratio of fish in the bottom third eight days post-CUS. Each dot represents the average value for a group of fish (Control: n = 6 groups; Stressed: n = 6 groups). Data are represented as mean ± SEM. *p < 0.05, Student’s t-test.
Figure 7
Figure 7
Experimental design. Fish in the stressed group were exposed to stressors for eight days. Fish in the control group were raised in the same conditions without stressor exposure. Social interaction was assessed in groups of fish at 18dpf (control: n = 59; stressed: n = 58). Early assessment of anxiety-like behaviors was done using the novel tank test at 18 dpf (control: n = 81; stressed: n = 83). The same fish were then tested in the open field and dark-light tests at 19 dpf (control: n = 99; stressed: n = 94). A separate group of fish was then tested in a novel tank for intermediate (19 or 20 dpf, (control: n = 95; stressed: n = 92)) or late (25dpf, (control: n = 24; stressed: n = 27)) assessment of anxiety-like behaviors.

Similar articles

Cited by

References

    1. McCarty R. Learning about stress: neural, endocrine and behavioral adaptations. Stress. 2016;19:449–475. - PubMed
    1. McEwen BS. Stress, adaptation, and disease. Allostasis and allostatic load. Ann. N. Y. Acad. Sci. 1998;840:33–44. - PubMed
    1. Calhoon GG, Tye KM. Resolving the neural circuits of anxiety. Nat. Neurosci. 2015;18:1394–1404. - PMC - PubMed
    1. Pechtel P, Pizzagalli DA. Effects of early life stress on cognitive and affective function: an integrated review of human literature. Psychopharmacology (Berl.) 2011;214:55–70. - PMC - PubMed
    1. van Bodegom M, Homberg JR, Henckens MJAG. Modulation of the Hypothalamic-Pituitary-Adrenal Axis by Early Life Stress Exposure. Front Cell Neurosci. 2017;11:87. - PMC - PubMed

Publication types