

Single-nucleotide polymorphisms based genetic risk score in the prediction of pancreatic cancer risk
- PMID: 32587449
- PMCID: PMC7304113
- DOI: 10.3748/wjg.v26.i22.3076
Single-nucleotide polymorphisms based genetic risk score in the prediction of pancreatic cancer risk
Abstract
Background: Disease-related single nucleotide polymorphisms (SNPs) based genetic risk score (GRS) has been proven to provide independent inherited risk other than family history in multiple cancer types.
Aim: To evaluate the potential of GRS in the prediction of pancreatic cancer risk.
Methods: In this case-control study (254 cases and 1200 controls), we aimed to evaluate the association between GRS and pancreatic ductal adenocarcinoma (PDAC) risk in the Chinese population. The GRS was calculated based on the genotype information of 18 PDAC-related SNPs for each study subject (personal genotyping information of the SNPs) and was weighted by external odd ratios (ORs).
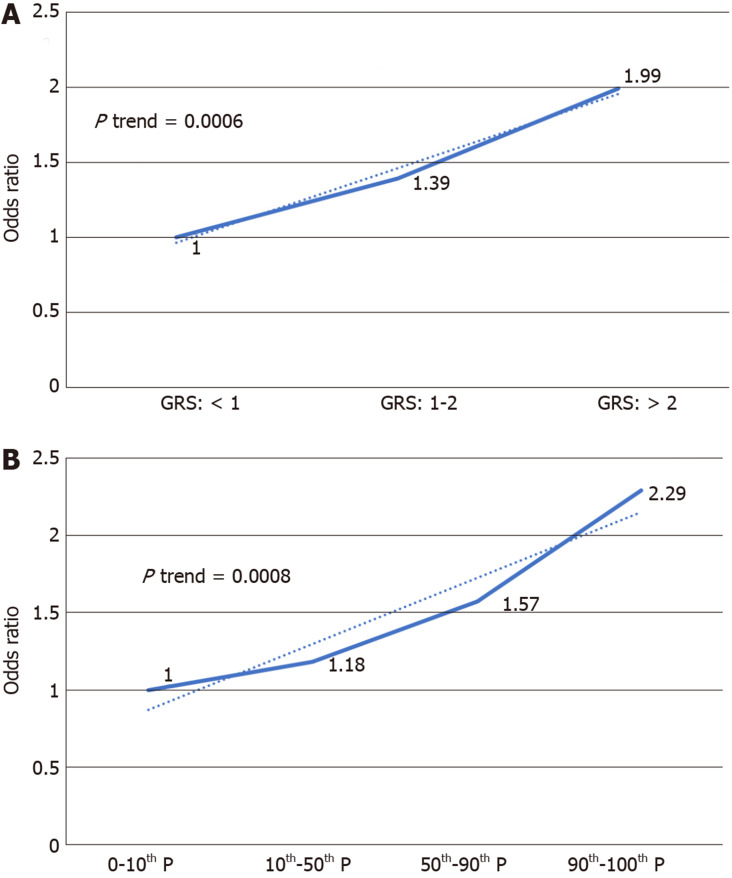
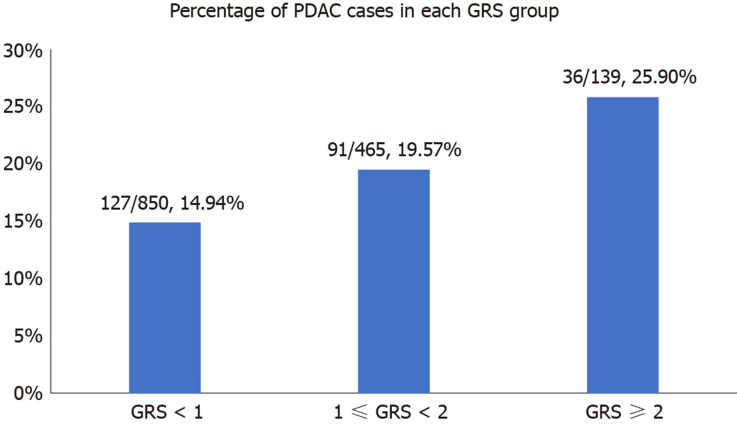
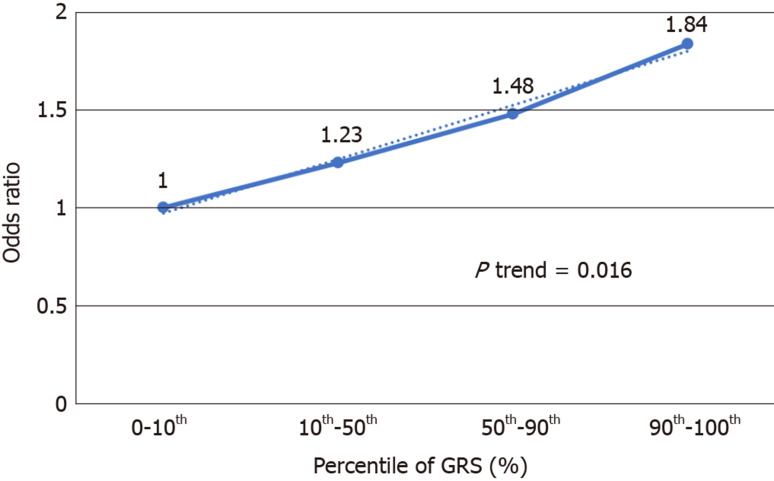
Results: GRS was significantly different in cases and controls (1.96 ± 3.84 in PDACs vs 1.09 ± 0.94 in controls, P < 0.0001). Logistic regression revealed GRS to be associated with PDAC risk [OR = 1.23, 95% confidence interval (CI): 1.13-1.34, P < 0.0001]. GRS remained significantly associated with PDAC (OR = 1.36, 95%CI: 1.06-1.74, P = 0.015) after adjusting for age and sex. Further analysis revealed an association of increased risk for PDAC with higher GRS. Compared with low GRS (< 1.0), subjects with high GRS (2.0) were 99% more likely to have PDAC (OR: 1.99, 95%CI: 1.30-3.04, P = 0.002). Participants with intermediate GRS (1.0-1.9) were 39% more likely to have PDAC (OR: 1.39, 95%CI: 1.03-1.84, P = 0.031). A positive trend was observed (P trend = 0.0006).
Conclusion: GRS based on PDAC-associated SNPs could provide independent information on PDAC risk and may be used to predict a high risk PDAC population.
Keywords: Chinese population; Genetic risk score; Genome-wide association study; Pancreatic cancer; Single nucleotide polymorphisms.
©The Author(s) 2020. Published by Baishideng Publishing Group Inc. All rights reserved.
Conflict of interest statement
Conflict-of-interest statement: No benefits in any form have been received or will be received from a commercial party related directly or indirectly to the subject of this article.
Figures
Similar articles
-
An evaluation study of reported pancreatic adenocarcinoma risk-associated SNPs from genome-wide association studies in Chinese population.Pancreatology. 2017 Nov-Dec;17(6):931-935. doi: 10.1016/j.pan.2017.09.009. Epub 2017 Sep 27. Pancreatology. 2017. PMID: 28988600
-
Replication and Genetic Risk Score Analysis for Pancreatic Cancer in a Diverse Multiethnic Population.Cancer Epidemiol Biomarkers Prev. 2020 Dec;29(12):2686-2692. doi: 10.1158/1055-9965.EPI-20-0963. Epub 2020 Sep 21. Cancer Epidemiol Biomarkers Prev. 2020. PMID: 32958499 Free PMC article.
-
Lack of replication of seven pancreatic cancer susceptibility loci identified in two Asian populations.Cancer Epidemiol Biomarkers Prev. 2013 Feb;22(2):320-3. doi: 10.1158/1055-9965.EPI-12-1182. Epub 2012 Dec 18. Cancer Epidemiol Biomarkers Prev. 2013. PMID: 23250936
-
Genetic Risk Score Is Associated with Vertical Cup-to-Disc Ratio and Improves Prediction of Primary Open-Angle Glaucoma in Latinos.Ophthalmology. 2018 Jun;125(6):815-821. doi: 10.1016/j.ophtha.2017.12.014. Epub 2018 Feb 1. Ophthalmology. 2018. PMID: 29361357 Free PMC article.
-
Implementation of personalized medicine for fracture risk assessment in osteoporosis.Geriatr Gerontol Int. 2016 Mar;16 Suppl 1:57-65. doi: 10.1111/ggi.12721. Geriatr Gerontol Int. 2016. PMID: 27018284 Review.
Cited by
-
Development and validation of glycolysis-related prognostic score for prediction of prognosis and chemosensitivity of pancreatic ductal adenocarcinoma.J Cell Mol Med. 2021 Jun;25(12):5615-5627. doi: 10.1111/jcmm.16573. Epub 2021 May 3. J Cell Mol Med. 2021. PMID: 33942483 Free PMC article.
-
Association between the MCP-1 -2518 A > G (rs1024611) polymorphism and susceptibility to type 2 diabetes mellitus and diabetic nephropathy: a meta-analysis.BMC Endocr Disord. 2023 Dec 4;23(1):267. doi: 10.1186/s12902-023-01514-z. BMC Endocr Disord. 2023. PMID: 38049786 Free PMC article.
-
Current status of inherited pancreatic cancer.Hered Cancer Clin Pract. 2022 Jun 27;20(1):26. doi: 10.1186/s13053-022-00224-2. Hered Cancer Clin Pract. 2022. PMID: 35761384 Free PMC article. Review.
-
Germline Aberrations in Pancreatic Cancer: Implications for Clinical Care.Cancers (Basel). 2022 Jun 30;14(13):3239. doi: 10.3390/cancers14133239. Cancers (Basel). 2022. PMID: 35805011 Free PMC article. Review.
-
Artificial Intelligence in the Diagnosis and Treatment of Pancreatic Cystic Lesions and Adenocarcinoma.Cancers (Basel). 2023 Apr 22;15(9):2410. doi: 10.3390/cancers15092410. Cancers (Basel). 2023. PMID: 37173876 Free PMC article. Review.
References
-
- Torre LA, Bray F, Siegel RL, Ferlay J, Lortet-Tieulent J, Jemal A. Global cancer statistics, 2012. CA Cancer J Clin. 2015;65:87–108. - PubMed
-
- Chen W, Zheng R, Baade PD, Zhang S, Zeng H, Bray F, Jemal A, Yu XQ, He J. Cancer statistics in China, 2015. CA Cancer J Clin. 2016;66:115–132. - PubMed
-
- Zheng R, Zeng H, Zhang S, Chen T, Chen W. National estimates of cancer prevalence in China, 2011. Cancer Lett. 2016;370:33–38. - PubMed
-
- Zhou M, Wang H, Zhu J, Chen W, Wang L, Liu S, Li Y, Wang L, Liu Y, Yin P, Liu J, Yu S, Tan F, Barber RM, Coates MM, Dicker D, Fraser M, González-Medina D, Hamavid H, Hao Y, Hu G, Jiang G, Kan H, Lopez AD, Phillips MR, She J, Vos T, Wan X, Xu G, Yan LL, Yu C, Zhao Y, Zheng Y, Zou X, Naghavi M, Wang Y, Murray CJ, Yang G, Liang X. Cause-specific mortality for 240 causes in China during 1990-2013: a systematic subnational analysis for the Global Burden of Disease Study 2013. Lancet. 2016;387:251–272. - PubMed
-
- Society AC. Cancer Facts and Figures 2016. 2016. Available from: https://www.cancer.org/content/dam/cancer-org/research/cancer-facts-and-....
MeSH terms
LinkOut - more resources
Full Text Sources
Medical
