. 2020 Jun 10:11:1025.
doi: 10.3389/fimmu.2020.01025. eCollection 2020.

In vivo Screen Identifies Zdhhc2 as a Critical Regulator of Germinal Center B Cell Differentiation

Affiliations

In vivo Screen Identifies Zdhhc2 as a Critical Regulator of Germinal Center B Cell Differentiation

Rongqing Zhao et al. Front Immunol. .

Abstract

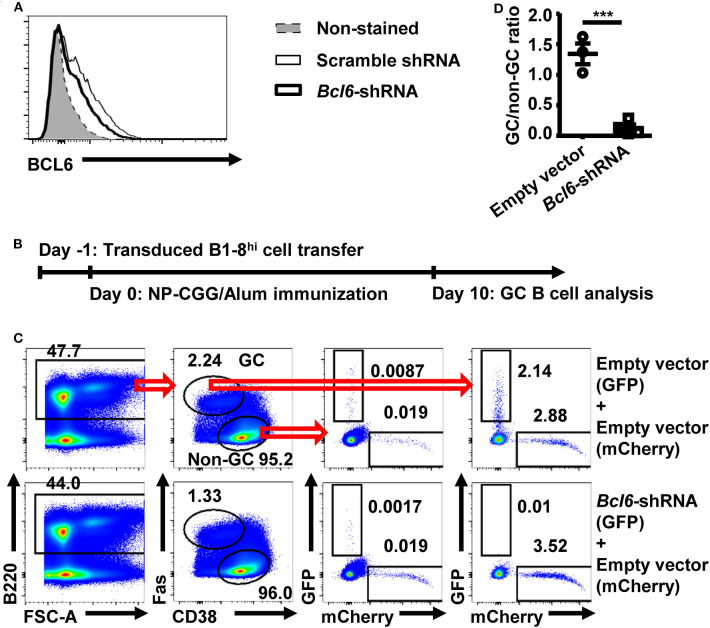
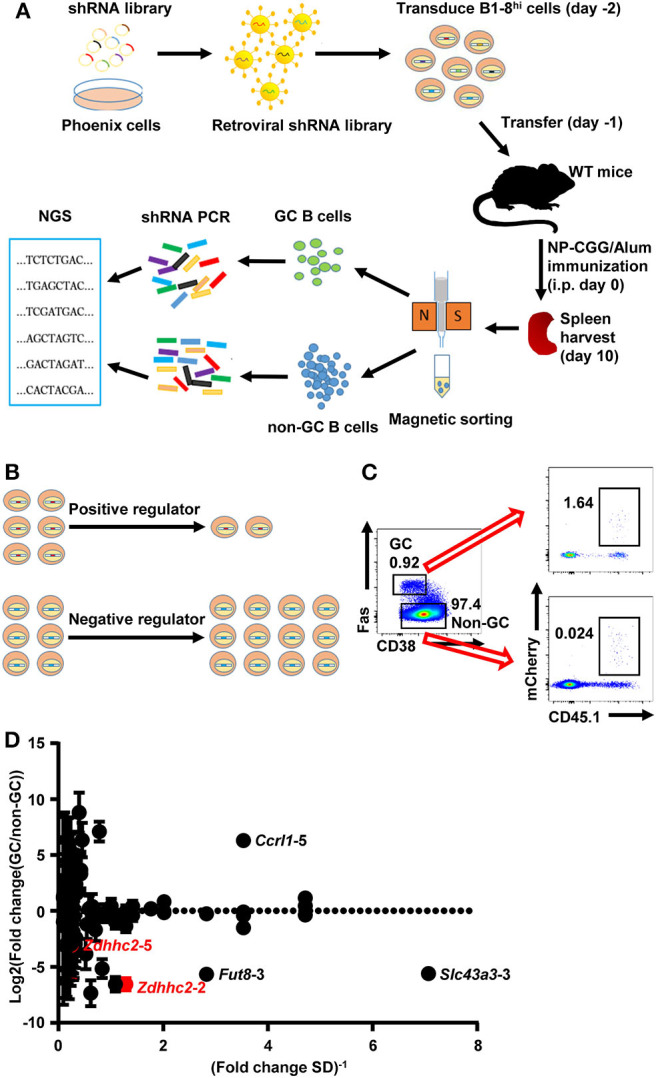
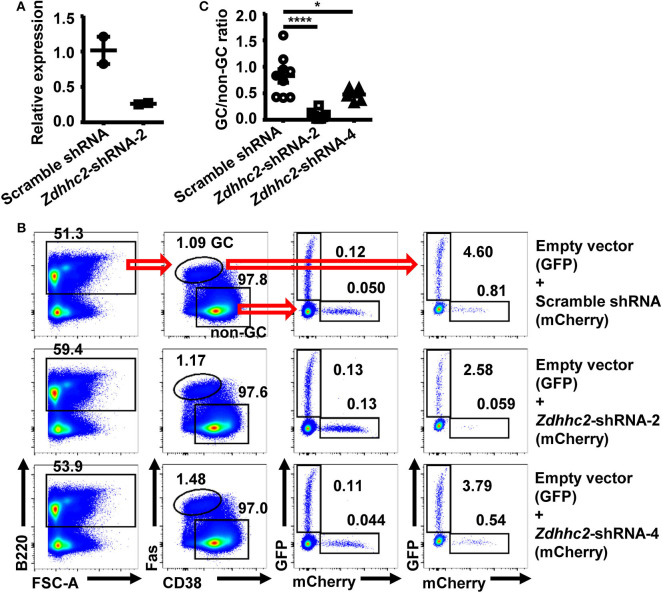
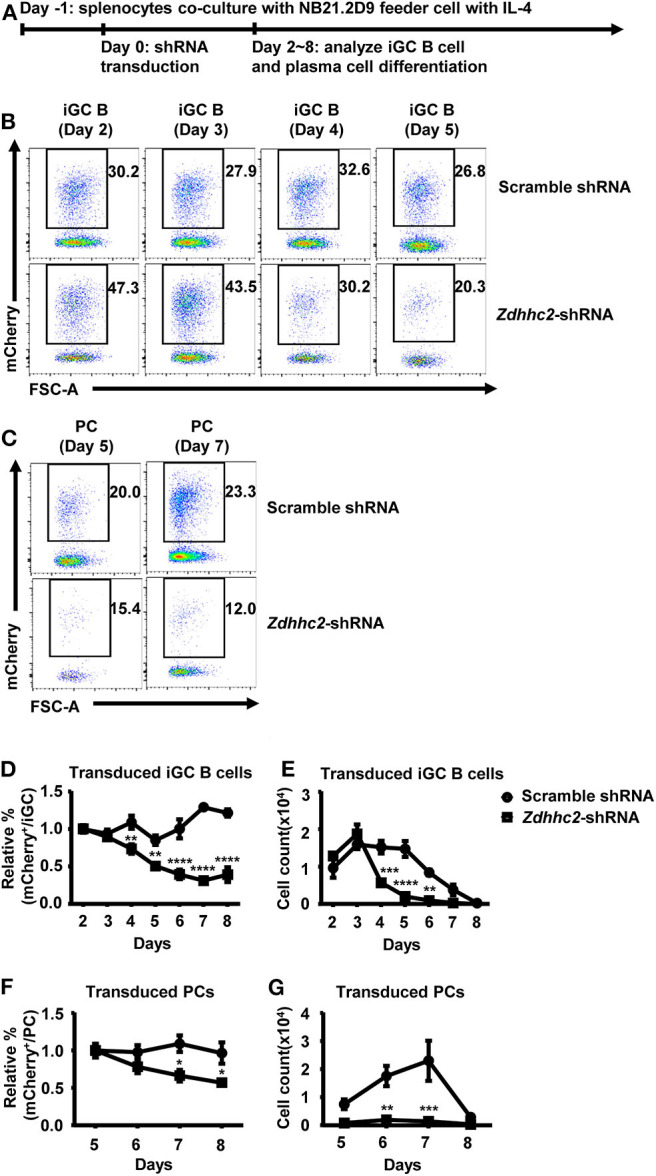
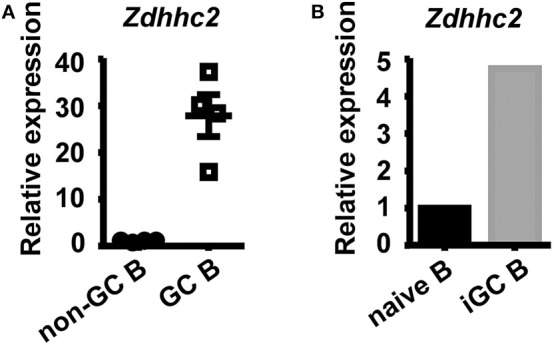
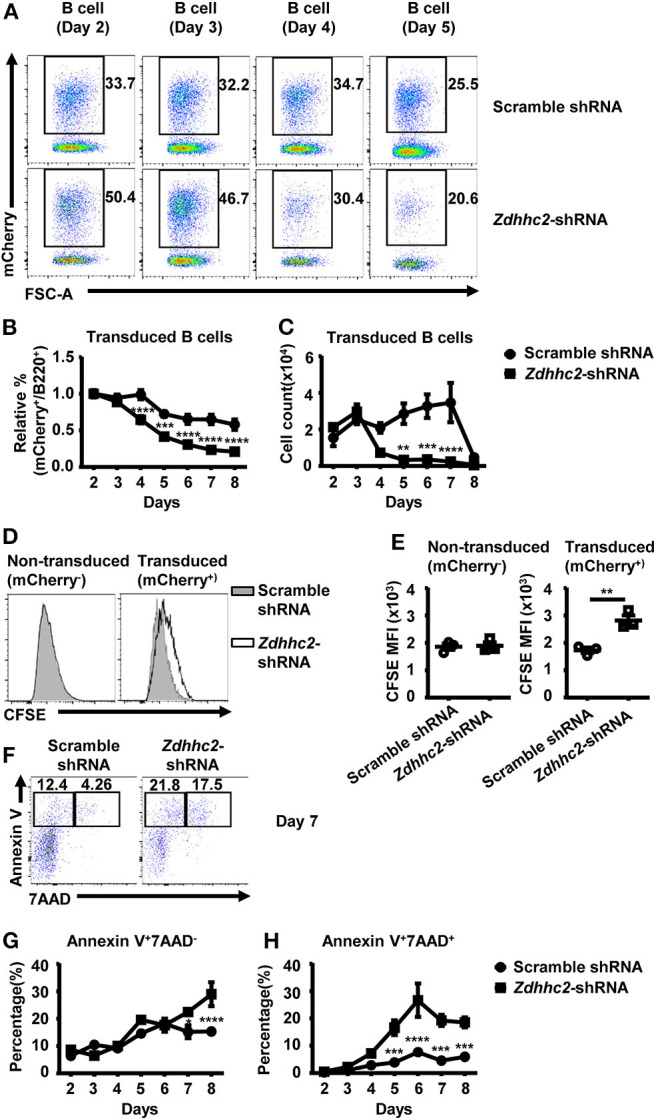
Germinal center (GC) B cell differentiation is critical for the production of affinity-matured pathogen-specific antibodies, the dysregulation of which may lead to humoral immunodeficiency or autoimmunity. The development of an in vivo screening system for factors regulating GC B cell differentiation has been a challenge. Here we describe a small-scale in vivo screening system with NP-specific B1-8hi cells and a retroviral shRNA library targeting 78 candidate genes to search for B cell-intrinsic factors that specifically regulate GC B cell differentiation. Zdhhc2, a gene encoding palmitoyltransferase ZDHHC2 and highly expressed in GC B cells, is identified as a strong positive regulator of GC B cell differentiation. B1-8hi cells transduced with Zdhhc2-shRNA are severely compromised in differentiating into GC B cells. A further analysis of in vitro differentiated B cells transduced with Zdhhc2-shRNA shows that Zdhhc2 is critical for the proliferation and the survival of B cells stimulated by CD40L, BAFF, and IL-21 and consequently impacts on their differentiation into GC B cells and post-GC B cells. These studies not only identify Zdhhc2 as a novel regulator of GC B cell differentiation but also represent a proof of concept of in vivo screen for regulators of GC B cell differentiation.

Keywords: GC selection; Zdhhc2; germinal center B cell; in vivo screen; shRNA.


Figures

Figure 1
Figure 1
Retrovirally transduced B1-8hi cells can be used to study the shRNA function. (A) Representative flow cytometry profile showing the intranuclear BCL6 levels in untransduced A20 cells or transduced A20 cells with scramble shRNA or Bcl6–shRNA retroviral vectors. Murine B cell lymphoma A20 cells were either untransduced or transduced with the indicated retroviral vectors and analyzed for intranuclear BCL6 levels by flow cytometry 3 days later. (B) B1-8hi cell transfer model for evaluating germinal center (GC) B cell differentiation. Fresh or retrovirally transduced B1-8hi cells were adoptively transferred to wild-type (WT) recipients on day−1, immunized with NP-CGG/Alum on day 0, and analyzed for GC B cell differentiation on day 10. (C,D) Representative flow cytometry profiles (C) showing the percentages of empty vector and Bcl6–shRNA transduced B1-8hi cells (expressing a GFP reporter) as well as the co-transferred empty vector transduced B1-8hi cells (expressing a mCherry reporter) in non-GC B cells and GC B cells, and representative graph (D) showing the GC/non-GC ratios of percentages of transduced B1-8hi cells (expressing GFP) normalized to empty vector transduced cells (expressing mCherry). The empty vector or Bcl6–shRNA transduced B1-8hi cells (expressing GFP) were mixed 1:1 with empty vector transduced B1-8hi cells (expressing mCherry) and adoptively transferred into WT recipient mice and evaluated for their percentages among non-GC B cells and GC B cells (C) 10 days after NP-CGG/Alum immunization. The ratio of the percentage of empty vector or Bcl6–shRNA transduced cells (expressing GFP) in GC B cells to that in the matched non-GC B cells was calculated and normalized to the ratio of empty vector transduced cells (expressing mCherry), expressed as GC/non-GC ratio (D). Each symbol in (D) represents data from an individual mouse. The bars represent mean ± SEM; ***p ≤ 0.001, unpaired two-tailed t-test. A representative of two independent experiments is shown.
Figure 2
Figure 2
Overview of the shRNA in vivo screening system for regulators of germinal center (GC) B cell differentiation. (A) A schematic view of the in vivo screening system for regulators of GC B cell differentiation. The shRNA retroviral library was produced in Phoenix cells and used to transduce B1-8hi cells on day−2, which were adoptively transferred into eight wild-type (WT) recipient mice on day−1. These mice were immunized with NP-CGG/Alum on day 0, sacrificed on day 10, and subjected to splenic GC and non-GC B cell isolation by magnetic sorting. The shRNA sequences were amplified by PCR and determined by next-generation sequencing to evaluate the abundance of each shRNA construct. (B) Illustration of the screening strategy: shRNA constructs that target the positive regulators of GC B cell differentiation are less abundant and vice versa for negative regulators. (C) Representative flow cytometry profiles showing the percentages of retroviral shRNA library transduced cells (expressing mCherry) in GC and non-GC B cells in mice treated as described in (A). (D) Plot of the binary logarithm of shRNA's fold change values (calculated as the ratio of each shRNA's abundance in GC B cells to that in the corresponding non-GC B cells) against the reciprocals of their standard deviations [(fold change SD)−1]. Two independent screens were performed.
Figure 3
Figure 3
Reduced in vivo differentiation of Zdhhc2-shRNA transduced B cells into germinal center (GC) B cells. (A) Graph showing the relative mRNA levels in scramble shRNA and Zdhhc2-shRNA transduced B cells. Each symbol represents an independent culture. (B,C) Representative flow cytometry profiles (B) showing the precentages of scramble shRNA or Zdhhc2-shRNA transduced B1-8hi cells (expressing mCherry) as well as the co-transferred empty vector transduced B1-8hi cells (expressing GFP) in non-GC B cells and GC B cells, and representative graph (C) showing the GC/non-GC ratio of percentages of scramble shRNA or Zdhhc2-shRNA transduced B1-8hi cells (expressing mCherry) normalized to empty vector transduced cells (expressing GFP), analyzed as described in Figures 1C,D. Each symbol in (C) represents data from an individual mouse. The bars represent mean ± SEM; *p ≤ 0.05, ****p ≤ 0.0001, one-way ANOVA with Dunnett's multiple-comparisons test. A representative of two independent experiments is shown.
Figure 4
Figure 4
Reduced in vitro differentiation of Zdhhc2-shRNA transduced B cells into germinal center (GC) B cells and plasma cells. (A) The in vitro model for analyzing iGC B cell and plasma cell differentiation. The wild-type (WT) splenic cells were co-cultured with irradiated NB-21.2D9 feeder cells (expressing CD40L, BAFF, and IL21) in the presence of 2 ng/ml of IL-4 on day−1, transduced with scramble shRNA or Zdhhc2-shRNA-2 retroviral vectors (expressing mCherry) on day 0, and analyzed for iGC B cell and plasma cell differentiation from day 2 to day 8. (B,C) Representative flow cytometry profiles showing the percentages of scramble shRNA or Zdhhc2-shRNA transduced cells (mCherry+) among iGC B cells (B220+Fas+GL7+) as cultured in (A) on days 2–5 (B) and plasma cells (B220+CD138+IgG1+ or PC) on day 5 and day 7 (C). (D–G) Representative graphs showing the relative percentage (D,F) or the absolute number (E,G) of scramble shRNA or Zdhhc2-shRNA transduced cells among iGC B cells (normalized to the values on day 2) (D,E) or plasma cells (normalized to the values on day 5) (F,G) at the indicated time points (days 2–8 for iGC B cells, days 5–8 for PC) in the cultures described as in (A). The bars represent mean ± SEM. *p ≤ 0.05, **p ≤ 0.01, ***p ≤ 0.001, ****p ≤ 0.0001, two-way ANOVA with Sidak's multiple-comparisons test. A representative of two independent experiments is shown.
Figure 5
Figure 5
High expression levels of Zdhhc2 in germinal center (GC) B cells. (A,B) Graphs showing the relative Zdhhc2 mRNA levels, quantified by qRT-PCR, in non-GC B and GC B cells sorted by fluorescence-activated cell sorting (FACS) from Peyer's patches of wild-type mice (A), FACS-sorted splenic naïve B cells, and induced GC B cells (iGC B) cultured as in Figure 4A. Each symbol in (A) represents the sample from an individual mouse. N = 1 in (B).
Figure 6
Figure 6
The reduced proliferation and the increased cell death in Zdhhc2-shRNA transduced B cells. (A) Representative flow cytometry profiles showing the percentages of scramble shRNA or Zdhhc2-shRNA transduced cells (mCherry+) among B cells (B220+) cultured as in Figure 4 on days 2–5. (B,C) Representative graphs showing the relative percentage (normalized to the values on day 2) (B) or the absolute number (C) of scramble shRNA or Zdhhc2-shRNA transduced cells among B cells at the indicated time points in the culture described as in Figure 4. (D,E) Representative flow cytometry profiles showing the carboxyfluorescein succinimidyl ester (CFSE) levels (D) and graphs showing the CFSE MFI levels (E) in scramble shRNA or Zdhhc2-shRNA transduced B cells (mCherry+) and non-transduced B cells (mCherry). The splenic cells were cultured and transduced as described in Figure 4A on day −1 and day 0, then labeled with CFSE on day 2 and further co-cultured with irradiated NB-21.2D9 feeder cells, and analyzed for CFSE levels on day 4. (F,G,H) Representative flow cytometry profiles (F) and graphs showing the percentages of apoptotic cells (Annexin-V+7AAD) (G) and dead cells (Annexin-V+7AAD+) (H) in scramble shRNA or Zdhhc2-shRNA transduced B cells (mCherry+). Each symbol represents an independent culture. The bars represent mean ± SEM. *p ≤ 0.05, **p ≤ 0.01, ***p ≤ 0.001, ****p ≤ 0.0001, two-way ANOVA with Sidak's multiple-comparisons test (B,C,G,H) or unpaired two-tailed t-test (E). The data are representative of two independent experiments.

Similar articles

Cited by

References

    1. Burnett DL, Langley DB, Schofield P, Hermes JR, Chan TD, Jackson J, et al. . Germinal center antibody mutation trajectories are determined by rapid self/foreign discrimination. Science. (2018) 360:223–6. 10.1126/science.aao3859 - DOI - PMC - PubMed
    1. Brink R, Phan TG. Self-reactive B cells in the germinal center reaction. Annu Rev Immunol. (2018) 36:339–57. 10.1146/annurev-immunol-051116-052510 - DOI - PubMed
    1. Allen CD, Ansel KM, Low C, Lesley R, Tamamura H, Fujii N, et al. . Germinal center dark and light zone organization is mediated by CXCR4 and CXCR5. Nat Immunol. (2004) 5:943–52. 10.1038/ni1100 - DOI - PubMed
    1. Allen CD, Okada T, Tang HL, Cyster JG. Imaging of germinal center selection events during affinity maturation. Science. (2007) 315:528–31. 10.1126/science.1136736 - DOI - PubMed
    1. Caron G, Le Gallou S, Lamy T, Tarte K, Fest T. CXCR4 expression functionally discriminates centroblasts versus centrocytes within human germinal center B cells. J Immunol. (2009) 182:7595–602. 10.4049/jimmunol.0804272 - DOI - PubMed

Publication types

LinkOut - more resources