. 2020 Jun 10:11:772.
doi: 10.3389/fpls.2020.00772. eCollection 2020.

High Light-Induced Nitric Oxide Production Induces Autophagy and Cell Death in Chlamydomonas reinhardtii

Affiliations

High Light-Induced Nitric Oxide Production Induces Autophagy and Cell Death in Chlamydomonas reinhardtii

Eva YuHua Kuo et al. Front Plant Sci. .

Abstract

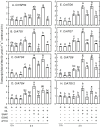
Autophagy plays a role in regulating important cellular functions in response to stress conditions. The role of nitric oxide (NO) in the regulation of autophagy in Chlamydomonas reinhardtii has been not studied. Illumination of C. reinhardtii cells under a high light (HL, 1,600 μmol m-2 s-1) condition induced a NO burst through NO synthase- and nitrate reductase-independent routes, and cell death. The abundance of CrATG8 protein, an autophagy marker of C. reinhardtii, increased after HL illumination along with a linear increase in the transcript abundance of autophagy-associated genes (CrVPS34, CrATG1, CrATG3, CrATG4, CrATG6, CrATG7, CrATG8, and CrATG12), which were suppressed in the presence of an NO scavenger, 2-(4-carboxyphenyl)-4,4,5,5-tetramethylimidazoline-1-oxyl-3-oxide (cPTIO). The cells were treated with NO donors, S-nitroso-N-acetyl-penicillamine, and S-nitrosoglutathione, under a normal light (50 μmol m-2 s-1) condition to elucidate the role of NO in autophagy activation and cell death. Treatment with 0.05 mM or 0.1 mM NO donors increased the abundance of ATG8 protein and CrATG transcripts, which were suppressed in the presence of cPTIO. Moreover, treatment with 0.05 mM NO donors did not affect cell viability, while 0.1 mM NO donors elicited a transient decrease in cell growth and death that recovered after 12 h. The transient effect could be prevented by the presence of cPTIO. However, treatment with 1 mM H2O2 and 0.1 mM NO donors enhanced autophagy induction and resulted in cell death after 24 h. The interaction of H2O2 and NO can be prevented by cPTIO treatment. This implies that NO is critical for the interaction of H2O2 and NO that induces cell death and autophagy. Furthermore, exposure to 0.1 mM NO donors under a non-lethal HL condition (750 μmol m-2 s-1) evoked autophagy and cell death. In conclusion, the present findings demonstrated that the NO-mediated autophagy pathway is activated in C. reinhardtii under lethal high intensity illumination and may interact with H2O2 for HL-induced cell death. The relationships between autophagy and cell death are discussed.

Keywords: Chlamydomonas; autophagy; autophagy-related protein; cell death; high light; nitric oxide.


Figures

FIGURE 1
FIGURE 1
DAF-FM acetate detection of NO production, cell growth, and death in Chlamydomonas reinhardtii cells under NL (50 μmol m–2 s–1) and HL (1,600 μmol m–2 s–1). (A) Quantitation of NO production. (B) Microscopic observation of DAF-FM fluorescence after 5 h of treatment. (C) Cell density. (D) Cell viability. (E) Cell death (SYTOX Green fluorescence). The data in (A), (C), and (E) are expressed as the mean ± SD (n = 3) from three independent biological replicates, and different letters indicate the statistical significance set at P < 0.05 according to ANOVA. In (B), BF represents bright field, B-2A represents the autofluorescence of cells, and FITC represents DAF-FM fluorescence.
FIGURE 2
FIGURE 2
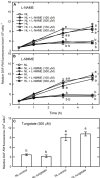
The effect of the NOS inhibitor, L-NAME (A) or L-NMME (B), and the NR inhibitor, tungstate (300 μM) (C), on NO production in Chlamydomonas reinhardtii cells under NL (50 μmol m–2 s–1) or HL (1,600 μmol m–2 s–1) illumination. The data are expressed as the mean ± SD (n = 3) from three independent biological replicates and different letters indicate the statistical significance set at P < 0.05 according to ANOVA.
FIGURE 3
FIGURE 3
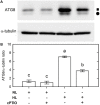
Immunodetection of the CrATG8 protein of Chlamydomonas reinhardtii cells 3 h after NL (50 μmol m–2 s–1) and HL (1,600 μmol m–2 s–1) illumination in the presence or the absence of 400 M cPTIO. (A) Immunodetection using an antibody directed against recombinant Arabidopsis ATG8 (upper part) and α-tubulin (lower part). Triplicate samples were analyzed, and one of them is shown. (B) Relative change of CrATG8 protein expression estimated on the basis of the α-tubulin intensity. A solid square (■) represents ATG8 and a solid circle (∙) represents ATG8-PE. The data in (B) are expressed as the mean ± SD (n = 3) from three independent biological replicates, and different letters indicate the statistical significance set at P < 0.05 according to ANOVA.
FIGURE 4
FIGURE 4
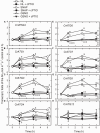
CrVPS34 and CrATG transcripts abundance in Chlamydomonas reinhardtii cells under NL (50 μmol m–2 s–1) and HL (1,600 μmol m–2 s–1) illumination in the presence or the absence of 400 μM cPTIO. (A) CrVPS34. (B) CrATG1. (C) CrATG3. (D) CrATG4. (E) CrATG6. (F) CrATG7. (G) CrATG8. (H) CrATG12. The data are expressed as the mean ± SD (n = 3) from three independent biological replicates. Different letters indicate the statistical significance set at P < 0.05 according to ANOVA. Open circle, NL; solid triangle, NL + cPTIO; open square, HL; inverted triangle, HL + cPTIO.
FIGURE 5
FIGURE 5
Immunodetection of the CrATG8 protein of Chlamydomonas reinhardtii cells after 0.05 mM SNAP (A) or 0.05 mM GSNO (B) treatment for 3 h in the presence or absence of 400 μM cPTIO under an NL (50 μmol m–2 s–1) condition. Triplicate samples were analyzed, and one of them is shown. The quantitation data are expressed as the mean ± SD (n = 3) from three independent biological replicates and different letters indicate the statistical significance set at P < 0.05 according to ANOVA.
FIGURE 6
FIGURE 6
Immunodetection of the CrATG8 protein of Chlamydomonas reinhardtii cells after 0.1 mM SNAP (A) or 0.1 mM GSNO (B) treatment for 3 h in the presence or absence of 400 μM cPTIO under an NL (50 μmol m–2 s–1) condition. Triplicate samples were analyzed, and one of them is shown. The quantitation data are expressed as the mean ± SD (n = 3) from three independent biological replicates and different letters indicate the statistical significance set at P < 0.05 according to ANOVA.
FIGURE 7
FIGURE 7
The time-course changes in CrVPS34 and CrATG transcripts abundance in Chlamydomonas reinhardtii cells in response to 0.05 mM SNAP or 0.05 mM GSNO under an NL (50 μmol m–2 s–1) condition. (A) CrVPS34. (B) CrATG1. (C) CrATG3. (D) CrATG4. (E) CrATG6. (F) CrATG7. (G) CrATG8. (H) CrATG12. The data are expressed as the mean ± SD (n = 3) from three independent biological replicates and different letters indicate the statistical significance set at P < 0.05 according to ANOVA.
FIGURE 8
FIGURE 8
The time-course changes in CrVPS34 and CrATG transcripts abundance in Chlamydomonas reinhardtii cells in response to 0.1 mM SNAP or 0.1 mM GSNO under an NL (50 μmol m–2 s–1) condition. (A) CrVPS34. (B) CrATG1. (C) CrATG3. (D) CrATG4. (E) CrATG6. (F) CrATG7. (G) CrATG8. (H) CrATG12. The data are expressed as the mean ± SD (n = 3) from three independent biological replicates and different letters indicate the statistical significance set at P < 0.05 according to ANOVA.
FIGURE 9
FIGURE 9
The effect of 0.05 (A) or 0.1 (B) mM SNAP treatment on cell viability and cell death detected by SYTOX Green fluorescence dye in C. reinhardtii cells under an NL (50 μmol m–2 s–1) condition in the presence or the absence of 400 μM cPTIO. The results for 3 and 24 h treatment are shown. The cell viability shown is after the treatment with 0.1 mM NO donors. The data are expressed as the mean ± SD (n = 3) from three independent biological replicates and the vertical bar on the symbols represents SD. Different letters indicate the statistical significance set at P < 0.05 according to ANOVA.
FIGURE 10
FIGURE 10
The effect of 0.05 (A) or 0.1 (B) mM GSNO treatment on cell viability and cell death detected by SYTOX Green fluorescence dye in C. reinhardtii cells under an NL (50 μmol m–2 s–1) condition in the presence or absence of 400 μM cPTIO. The results for 3 and 24 h treatment are shown. The cell viability shown is after the treatment with 0.1 mM NO donors. The data are expressed as the mean ± SD (n = 3) from three independent biological replicates and the vertical bar on the symbols represents SD. Different letters indicate the statistical significance set at P < 0.05 according to ANOVA.
FIGURE 11
FIGURE 11
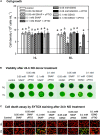
The effect of 0.05 or 0.1 mM SNAP and GSNO treatment on cell growth (A), viability (B), and cell death (C) detected by SYTOX Green fluorescence dye in C. reinhardtii cells under an ML (750 μmol m–2 s–1) condition in the presence or absence of 400 μM cPTIO for 24 h. The data are expressed as the mean ± SD (n = 3) from three independent biological replicates and the vertical bar on the symbols represents SD. Different letters indicate the statistical significance set at P < 0.05 according to ANOVA.
FIGURE 12
FIGURE 12
The time-course changes in CrVPS34 and CrATG transcripts abundance in Chlamydomonas reinhardtii cells in response to 0.1 mM SNAP or 0.1 mM GSNO treatment under an ML (750 μmol m–2 s–1) condition for 3 h. (A) CrVPS34. (B) CrATG1. (C) CrATG3. (D) CrATG4. (E) CrATG6. (F) CrATG7. (G) CrATG8. (H) CrATG12. The data are expressed as the mean ± SD (n = 3) from three independent biological replicates and different letters indicate the statistical significance set at P < 0.05 according to ANOVA.
FIGURE 13
FIGURE 13
The effect of SNAP (0.1 mM), GSNO (0.1 mM), and 1 mM H2O2 treatment on the CrATG8 transcript abundance (A) and ATG8 protein abundance (B) of Chlamydomonas reinhardtii cells under an NL condition (50 μmol m–2 s–1) for 3 h. The cPTIO (0.4 mM) was added to the SNAP + H2O2 and GSNO + H2O2 treatments. The data are expressed as the mean ± SD (n = 3) from three independent biological replicates and different letters indicate the statistical significance set at P < 0.05 according to ANOVA.
FIGURE 14
FIGURE 14
The effect of SNAP (0.1 mM), GSNO (0.1 mM), and 1 mM H2O2 treatment on the growth (cell density) (A) and viability (B) of Chlamydomonas reinhardtii cells under an NL condition (50 μmol m–2 s–1) for 24 h. The cPTIO (400 μM) was applied to the SNAP + H2O2 and GSNO + H2O2 treatments. The data are expressed as the mean ± SD (n = 3) from three independent biological replicates and different letters indicate the statistical significance set at P < 0.05 according to ANOVA.

Similar articles

Cited by

References

    1. Ahlfors R., Brosché M., Kollist H., Kangasjärvi J. (2009). Nitric oxide modulates ozone-induced cell death, hormone biosynthesis and gene expression in Arabidopsis thaliana. Plant J. 58 1–12. 10.1111/j.1365-313X.2008.03756.x - DOI - PubMed
    1. Anbar M. (1995). Nitric oxide: a synchronizing chemical messenger. Experientia 51 545–550. 10.1007/bf02128740 - DOI - PubMed
    1. Arasimowicza M., Floryszak-Wieczorek J. (2007). Nitric oxide as a bioactive signalling molecule in plant stress responses. Plant Sci. 172 876–887. 10.1016/j.plantsci.2007.02.005 - DOI
    1. Bajguz A. (2014). “Nitric oxide: role in plants under abiotic stress,” in Physiological Mechanisms and Adaptation Strategies in Plants Under Changing Environments, eds Ahmad R., Wani M. R. (New York, NY: Springer; ), 137–160.
    1. Barsoum M. J., Yuan H., Gerencser A. A., Liot G., Kushnareva Y., Graber S., et al. (2006). Nitric oxide-induced mitochondrial fission is regulated by dynamin-related GTPases in neurons. EMBO J. 25 3900–3911. 10.1038/sj.emboj.7601253 - DOI - PMC - PubMed

LinkOut - more resources