. 2020 Jun 7:2020:7531409.
doi: 10.1155/2020/7531409. eCollection 2020.

Using RNA-Seq to Explore the Repair Mechanism of the Three Methods and Three-Acupoint Technique on DRGs in Sciatic Nerve Injured Rats

Affiliations

Using RNA-Seq to Explore the Repair Mechanism of the Three Methods and Three-Acupoint Technique on DRGs in Sciatic Nerve Injured Rats

Tao-Tao Lv et al. Pain Res Manag. .

Abstract

Objective: To study the effects of the three methods and three-acupoint technique on DRG gene expression in SNI model rats and to elucidate the molecular mechanism of the three methods and three-acupoint technique on promoting recovery in peripheral nerve injury.

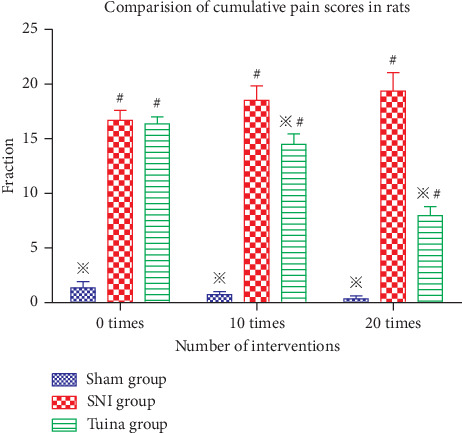
Methods: 27 male SD rats were randomly divided into three groups: a Sham group, the SNI group, and the Tuina group. The Tuina group was treated with a tuina manipulation simulator to simulate massage on points, controlling for both quality and quantity. Point-pressing, plucking, and kneading methods were administered quantitatively at Yinmen (BL37), Chengshan (BL57), and Yanglingquan (GB34) points on the affected side once a day, beginning 7 days after modeling. Intervention was applied once a day for 10 days, then 1 day of rest, followed by 10 more days of intervention, totally equaling 20 times of intervention. The effect of the three methods and three-point technique on the recovery of injured rats was evaluated using behavior analysis. RNA sequencing (RNA-Seq) analysis of differentially expressed genes in DRGs of the three groups of rats was also performed. GO and KEGG enrichment was analyzed and verified using real-time PCR.

Results: RNA-Seq combined with database information showed that the number of differentially expressed genes in DRG was the largest in the Tuina group compared with the SNI group, totaling 226. GO function is enriched in the positive regulation of cell processes, ion binding, protein binding, neuron, response to pressure, response to metal ions, neuron projection, and other biological processes. GO function is also enriched in the Wnt, IL-17, and MAPK signaling pathways in the KEGG database. PCR results were consistent with those of RNA sequencing, suggesting that the results of transcriptome sequencing were reliable.

Conclusion: The three methods and three-acupoint technique can promote the recovery of SNI model rats by altering the gene sequence in DRGs.


Conflict of interest statement

The authors declare that there are no conflicts of interest.

Figures

Figure 1
Figure 1
Comparisons of cumulative pain scores of rats in each group. Compared with the SNI group, P < 0.05; #compared with the Sham group, P < 0.05.
Figure 2
Figure 2
Analysis of differentially expressed genes. (a) Each column in the graph represents a sample, and each row represents a gene. The color in the graph represents the size of the gene expression in the sample. Red represents the higher expression of the gene in the sample, while green represents the lower expression. See the number label under the upper left color bar for the change trend of the specific expression. On the left is the tree graph of gene clustering and the module graph of subclustering, on the right is the name of the gene. The closer the two gene branches are, the closer their expression is. On the top is the tree graph of sample clustering, and on the bottom is the name of sample. (b) Genes, in which the circles of different colors in the numerical generation represent the common or unique number of genes between two or three sets of gene sets, the sum of all numbers in the circle represents the total number of genes in the gene set, and the cross region of the circle represents the common number of genes among the gene sets. (c), (d), and (e) volcanic maps are used to represent two groups of DEGs. Horizontal and vertical axes show the difference of gene expression in different groups. The smaller the P value, the more significant and the larger the difference—log 10 (adjusted P value). Different genes have different splashes. There is no significant difference between grey dot genes, red dot genes, and green dot genes.
Figure 3
Figure 3
Analysis results of GO and KEGG. (a) The ordinates in the graph represent the secondary classification terms of GO, the abscissas represent the number of genes in the secondary classification, and the colors represent different gene sets. (b) The vertical axis represents the GO term, and the horizontal axis represents the ratio of rich factor to the number of annotated genes. The larger the rich factor is, the greater the degree of enrichment is. The size of the dot represents the number of genes in this GO term. The color of the dot corresponds to different FDR (Pvaule_corrected) ranges. (c) The ordinate is the name of the KEGG metabolic pathway; the abscissa is the number of genes or transcripts annotated to the pathway. (d) The vertical axis represents the pathway name, and the horizontal axis represents the ratio of rich factors to the number of annotated genes. The larger the rich factor, the greater the degree of enrichment. The size of the dot indicates the number of genes in the pathway, and the color of the dot corresponds to different Q value ranges.
Figure 4
Figure 4
RT-PCR expression results. The abscissa is the gene name, and the ordinate is the relative expression.
Figure 5
Figure 5
Diagram of repair mechanism of DRG in rats with nerve injury intervened by three methods and three acupoints. (a) Sham group. (b) SNI group. (c) Tuina group.

References

    1. Han D., Chen Y., Kou Y., et al. Profiling of the dynamically alteredgene expression in peripheral nerve injury using NGS RNA sequencing technique. American Journal of Translational Research. 2016;8(2):871–884. - PMC - PubMed
    1. Gilron I., Baron R., Jensen T. Neuropathic pain:principles of diagnosis and treatment. Mayo Clinic Proceedings. 2015;90:532–545. doi: 10.1016/j.mayocp.2015.01.018. - DOI - PubMed
    1. Serra J., Solà R., Aleu J., Quiles C., Navarro X., Bostock H. Double and triple spikes in C-nociceptors in neuropathic pain states: an additional peripheral mechanism of hyperalgesia. Pain. 2011;152:343–353. doi: 10.1016/j.pain.2010.10.039. - DOI - PubMed
    1. Stoll G., Müller H. W. Nerve injury, axonal degeneration and neural regeneration: basic insights. Brain Pathology. 1999;9(2):313–325. doi: 10.1111/j.1750-3639.1999.tb00229.x. - DOI - PMC - PubMed
    1. Tölle T. R. Challenges with current treatment of neuropathicpain. European Journal of Pain Supplements. 2010;4(2):161–165. doi: 10.1016/s1754-3207(10)70527-7. - DOI

Publication types