. 2020 Jun 8:8:e8740.
doi: 10.7717/peerj.8740. eCollection 2020.

Development of a novel in vitro insulin resistance model in primary human tenocytes for diabetic tendinopathy research

Affiliations

Development of a novel in vitro insulin resistance model in primary human tenocytes for diabetic tendinopathy research

Hui Yee Tan et al. PeerJ. .

Abstract

Background: Type 2 diabetes mellitus (T2DM) had been reported to be associated with tendinopathy. However, the underlying mechanisms of diabetic tendinopathy still remain largely to be discovered. The purpose of this study was to develop insulin resistance (IR) model on primary human tenocytes (hTeno) culture with tumour necrosis factor-alpha (TNF-α) treatment to study tenocytes homeostasis as an implication for diabetic tendinopathy.

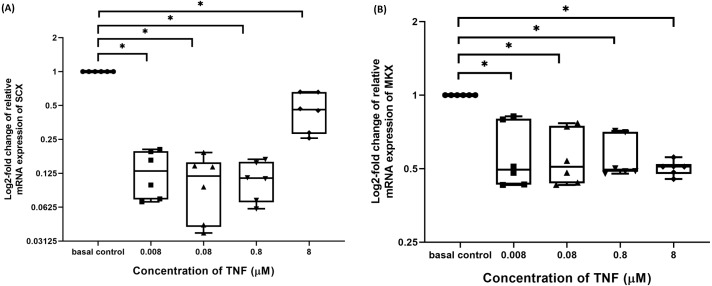
Methods: hTenowere isolated from human hamstring tendon. Presence of insulin receptor beta (INSR-β) on normal tendon tissues and the hTeno monolayer culture were analyzed by immunofluorescence staining. The presence of Glucose Transporter Type 1 (GLUT1) and Glucose Transporter Type 4 (GLUT4) on the hTeno monolayer culture were also analyzed by immunofluorescence staining. Primary hTeno were treated with 0.008, 0.08, 0.8 and 8.0 µM of TNF-α, with and without insulin supplement. Outcome measures include 2-[N-(7-nitrobenz-2-oxa-1,3-diazol-4-yl) amino]-2-deoxy-d-glucose (2-NBDG) assay to determine the glucose uptake activity; colourimetric total collagen assay to quantify the total collagen expression levels; COL-I ELISA assay to measure the COL-I expression levels and real-time qPCR to analyze the mRNA gene expressions levels of Scleraxis (SCX), Mohawk (MKX), type I collagen (COL1A1), type III collagen (COL3A1), matrix metalloproteinases (MMP)-9 and MMP-13 in hTeno when treated with TNF-α. Apoptosis assay for hTeno induced with TNF-α was conducted using Annexin-V FITC flow cytometry analysis.

Results: Immunofluorescence imaging showed the presence of INSR-β on the hTeno in the human Achilles tendon tissues and in the hTeno in monolayer culture. GLUT1 and GLUT4 were both positively expressed in the hTeno. TNF-α significantly reduced the insulin-mediated 2-NBDG uptake in all the tested concentrations, especially at 0.008 µM. Total collagen expression levels and COL-I expression levels in hTeno were also significantly reduced in hTeno treated with 0.008 µM of TNF-α. The SCX, MKX and COL1A1 mRNA expression levels were significantly downregulated in all TNF-α treated hTeno, whereas the COL3A1, MMP-9 and MMP-13 were significantly upregulated in the TNF-α treated cells. TNF-α progressively increased the apoptotic cells at 48 and 72 h.

Conclusion: At 0.008 µM of TNF-α, an IR condition was induced in hTeno, supported with the significant reduction in glucose uptake, as well as significantly reduced total collagen, specifically COL-I expression levels, downregulation of candidate tenogenic markers genes (SCX and MKX), and upregulation of ECM catabolic genes (MMP-9 and MMP-13). Development of novel IR model in hTeno provides an insight on how tendon homeostasis could be affected and can be used as a tool for further discovering the effects on downstream molecular pathways, as the implication for diabetic tendinopathy.

Keywords: Cellular biology; Glucose uptake; Hyperglycemia; Insulin resistance; Obese; Orthopaedics; Tendon; Tenocyte; Tumor necrosis factor-alpha (TNF-α); Type II diabetes.


Conflict of interest statement

The authors declare there are no competing interests.

Figures

Figure 1
Figure 1. Primary human tenocytes (hTeno) monolayer culture derived from human Hamstring tendons (n = 6).
(A) At day 0, floating viable cells (as indicated with white solid arrows) were in suspension and some were attached to the collagen fibres of the digested tendon explant. (B) Colonies of fibroblastic cells could be observed on day 14 onwards. (C) The fibroblastic cells proliferated from the explants (indicated as white solid arrows). (D) The explants were progressively removed (or “wash out”) from the cell culture during medium change and no noticeable explants were observed in the culture on day 20 onwards. (E) The morphology of the hTeno was in elongated spindle-shape. (F) The hTeno cells reached confluence within about 30 days after cells attached to the cell culture flasks. All the images were captured at 4X objective except for image A and E, which was captured at 10X objective. The scale bar (200 µm for 4X objective; 100 µm for 10X objective) was depicted on the right bottom corner of the image.
Figure 2
Figure 2. Immunofluorescence of insulin receptor beta (INSR-β) in the human Achilles tendon captured with a confocal laser scanning microscope.
The INSR-β was expressed in the tenocytes resided parallel to the tendon’s long axis. The images are the representative images of sequential scanning: (A) nucleus stained with DAPI, (B) INSR-β with indirect FITC stain and the (C) merged image of all the channels. The image was captured at 10X objectives and a scale bar (100 µm) was depicted on the right bottom corner of the overlaid image.
Figure 3
Figure 3. Immunofluorescence of insulin receptor beta (INSR-β), Glucose Transporter Type 1 (GLUT1) and Glucose Transporter Type 4 (GLUT4) in the hTeno monolayer culture captured with a confocal laser scanning microscope.
The INSR-β, GLUT1 and GLUT4 were expressed and distributed on the hTeno plasma membrane. The images are the representative images of sequential scanning: (A) nucleus stained with DAPI, (B) INSR-β with indirect Alexa Fluor® 488 stain, (C) merged image of DAPI and Alexa Fluor® 488 channels; (D) nucleus stained with DAPI, (E) GLUT1 with indirect Alexa Fluor® 555 stain, (F) merged image of DAPI and Alexa Fluor® 555 channels; (G) nucleus stained with DAPI, (H) GLUT4 with indirect Alexa Fluor® 647 stain, (I) merged image of DAPI and Alexa Fluor® 647 channels. The images were captured at 10X objectives and a scale bar (25 µm) was depicted on the right bottom corner of the overlaid image in C, F and I.
Figure 4
Figure 4. Fluorescence images of the 2-[N-(7-nitrobenz-2-oxa-1,3-diazol-4-yl) amino]-2-deoxy-d-glucose (2-NBDG) uptake into hTeno cytoplasm with and without TNF-α treatment (at 0.008, 0.08, 0.8 and 8 µM), as well as without (A, C, E, G and I) and with (B, D, F, H and J) 10 µg/mL insulin supplement.
The 2-NBDG uptake could be observed in the cytoplasm of all the hTeno treated with different concentrations of TNF-α with and without insulin stimulation, where (A) basal group without TNF-α and insulin treatment, (B) basal group with insulin supplement; (C) 0.008 µM TNF-α, (D) 0.008 µM TNF-α with insulin supplement; (E) 0.08 µM TNF- α, (F) 0.08 µM TNF-α with insulin supplement; (G) 0.8 µM TNF-α, (H) 0.8 µM TNF-α with insulin supplement and (I) 8 µM TNF- α, (J) 8 µM TNF-α with insulin supplement. Images were captured at the 10X objective and a scale bar (100 µm) was depicted (J).
Figure 5
Figure 5. TNF-α significantly up regulated the relative 2-[N-(7-nitrobenz-2-oxa-1,3-diazol-4-yl) amino]-2-deoxy-d-glucose (2-NBDG) uptake in hTeno treated with different concentrations of TNF-α (0.008, 0.08, 0.8 and 8 µM), with and without 10 µg/mL insulin.
Conversely, the fold change of insulin-mediated 2-NBDG glucose uptake was significantly reduced in hTeno when treated with TNF-α. The box plots show a (A) relative 2-NBDG uptake value. The data of the basal group without insulin stimulation were presented with a circle (•) and the groups with insulin stimulation were presented with a triangle (▴); the same applied for all Fig. 6A and Fig. 7A. A significant difference between the treatment groups (with different concentrations of TNF-α: 0.008, 0.08, 0.8 and 8 µM) versus the basal group is indicated by *p < 0.05 and †p < 0.01, whereas the significant difference between the pairwise comparison for the insulin-stimulated groups versus their corresponding groups without insulin is indicated by p < 0.05 and §p < 0.01. (B) Fold change of insulin-mediated 2-NBDG uptake in hTeno. Significant differences between the treatment groups (with different concentrations of TNF-α: 0, 0.008, 0.08, 0.8 and 8 µM) and non-TNF-α treated basal group were indicated by |p < 0.05 and p < 0.01. Three independent experiments were conducted (n = 3) with two technical replicates, and presented as median±IQR.
Figure 6
Figure 6. TNF-α significantly up-regulated the relative total collagen expression in hTeno treated with different concentrations of TNF-α (0.008, 0.08, 0.8 and 8 µM), with and without 10 µg/mL insulin supplement.
Conversely, the insulin-mediated total collagen expression was suppressed in hTeno treated with TNF-α. The box plot (A) shows a relative total collagen expression level. A significant difference between the treatment groups (with different concentrations of TNF-α: 0.008, 0.08, 0.8 and 8 µM) versus the basal group is indicated by *p < 0.05 and p < 0.01, whereas the significant difference between the pairwise comparison for the insulin-stimulated versus their corresponding groups without insulin is indicated by p < 0.05 and §p < 0.01. The bar chart (B) shows the fold change of insulin-mediated total collagen expression. A significant difference between the treatment groups (with different concentrations of TNF-α: 0, 0.008, 0.08, 0.8 and 8 µM) and non-TNF-α treated basal group is indicated by |p < 0.05 and p < 0.01. Three independent experiments were conducted (n = 3) and presented as median±IQR (for the non-parametric test) and mean±SD (for the parametric test).
Figure 7
Figure 7. TNF-α suppressed insulin-mediated Type I collagen (COL-I) expression when treated with lesser than 8 µM TNF-α; 0.008 µM TNF-α group shows a significantly reduction in the fold change of insulin-mediated COL-I expression levels.
The box plot shows a (A) relative COL-I expression levels. A significant difference between the treatment groups (with different concentrations of TNF-α: 0.008, 0.08, 0.8 and 8 µM) versus the basal group is indicated by *p < 0.05 and p < 0.01, whereas the significant difference between the pairwise comparison for the insulin-stimulated groups versus their corresponding groups without insulin is indicated by p < 0.05 and p < 0.01. The bar chart shows the (B) fold change of insulin-mediated relative COL-I expression . A significant difference between the treatment groups (with different concentrations of TNF-α: 0, 0.008, 0.08, 0.8 and 8 µM) versus the non-TNF-α treated basal group is indicated by |p < 0.05 and p < 0.01. Three independent experiments were conducted (n = 3). Data were presented as median ± IQR (for the non-parametric test) and mean ± SD (for the parametric test).
Figure 8
Figure 8. TNF-α significantly downregulated the log2-fold change of relative quantification of SCX and MKX mRNA expression levels relative to basal group.
The box plot shows (A) log2-fold change of relative SCX mRNA expression levels, (B) log2-fold change of relative MKX mRNA expression levels. A significant difference between the treatment groups (with different concentrations of TNF-α: 0.008, 0.08, 0.8 and 8 µM) versus the basal group is indicated by *p < 0.05. Three independent experiments were conducted (n = 3) and data presented as median±IQR.
Figure 9
Figure 9. TNF-α significantly downregulated the log2-fold change of relative quantification of ECM genes (COL1A1) mRNA expression levels relative to control samples and upregulated the log2-fold change of relative quantification of ECM metabolism-related markers genes (COL3A1, MMP-9 and MMP-13) mRNA expression levels in hTeno treated with different concentrations of TNF-α (0.008, 0.08, 0.8 and 8 µM) relative to control hTeno.
The box plot shows (A) log2-fold change of relative COL1A1 mRNA expression; (B) log2-fold change of relative COL3A1 mRNA expression; (C) log2-fold change of relative MMP9 mRNA expression; (D) log2-fold change of relative MMP13 mRNA expression. A significant difference between the treatment groups (with different concentrations of TNF-α: 0.008, 0.08, 0.8 and 8 µM) versus the basal group is indicated by *p < 0.05 as determined using Mann–Whitney U test. Three independent experiments were conducted (n = 3). Data were presented as median±IQR (for the non-parametric test).
Figure 10
Figure 10. 0.008 µM TNF-α increased the apoptotic cells in hTeno progressively with time (24, 48 and 72 h).
The representative dot plots of the basal control group and 0.008 µM TNF-α at different time points were presented, where (A) basal control, (B) 0.008 µM TNF-α treated for 24 h, (C) 0.008 µM TNF-α treated for 48 h and (D) 0.008 µM TNF-α treated for 72 h which indicated the distribution of cells after Annexin-V FITC staining. In each of the dot plots, the bottom right and top right quadrants represent early and late apoptotic cells respectively, whereas cells at the bottom left quadrant are live cells, and cells at the top left quadrant are necrotic cells (PI+, Annexin-V), where red areas indicate the apoptotic cells; blue areas indicate the live cells. The box plots shows the (E) percentage of live cells and the (F) percentage of apoptotic cells in hTeno treated with 0.008 µM TNF-α for 24 h, 48 h and 72 h. A significant difference between the treatment groups versus the basal group is indicated by *p < 0.05 as determined using the Mann–Whitney U test. Three independent experiments were conducted (n = 3) and presented as median±IQR.
Figure 11
Figure 11. Dose-dependent effects of TNF-α on hTeno glucose uptake, total collagen expression, COL-I expression, candidate tenogenic marker genes and ECM metabolism-related genes, with and without insulin stimulation.
(A) Elevated glucose uptake & total collagen expression and reduced COL–I expression were demonstrated at a lower concentration of TNF-α. Nevertheless, at high concentration of TNF-α increases glucose uptake and total collagen expression. (B) With the presence of insulin, at a lower concentration of TNF-α, hTeno shows a reduction in glucose uptake, total collagen expression & COL–I expression. While at higher TNF-α concentrations, with insulin stimulation, hTeno showed a reduction in glucose uptake but elevated in total collagen expression & COL–I expression. The mRNA expression levels in hTeno with TNF-α stimulation were altered; where both low and high concentrations of TNF-α showed a reduction in candidate tenogenic marker genes (SCX and MKX) and COL1A1 mRNA expression levels. Besides that, the COL3A1 and the catabolic matrix metalloproteinases (MMP9 and MMP13) mRNA expression levels were elevated. The apoptotic event was significantly increased in TNF-α treated hTeno.
Figure 12
Figure 12. Hypothetical pathomechanism involved in TNF-α induced IR in hTeno and its downstream cellular effects.
In brief, the hypothetical pathomechanism starts with the binding of TNF-α to the TNF-α receptor on hTeno which initiates the phosphorylation of TNF receptor-associated factor 2 (TRAF2) and subsequently promotes activation of both c-Jun N-terminal kinase (JNK) pathway and IκB kinase (IKK). In particular, JNK and IKKs are both serine/threonine-specific protein kinase that catalyzes the phosphorylation of serine or threonine residues on target proteins. Activation of JNK is proposed to trigger serine phosphorylation of insulin receptor substrate-1 (IRS-1) instead of tyrosine phosphorylation, thus diminished the downstream pathways, i.e.: inhibits the phosphoinositide 3-kinases (PI3K) pathway and prohibits the translocation of GLUT4 intracellular vesicles to the transmembrane region, and eventually no glucose uptake by GLUT4. The glucose uptake in the cells is barely shuttled by GLUT1 via passive diffusion. On the other hand, IKK phosphorylates IκB, thus activates the NF-κB in cytoplasmic to translocate to the nucleus. The canonical pathway results in the induction of transcription of pro-inflammatory cytokine: interleukin-1 beta (IL-1β), interleukin-6 (IL-6) and TNF-α, thus increases cell death via a cascade of apoptosis signalling. Activation of NF-κB also suggested interfering with the collagen homeostasis. The proposed mechanisms suggest there is a positive feedback loop between TNF-α and NF-κB.

Similar articles

Cited by

References

    1. Ågren MS, Schnabel R, Christensen LH, Mirastschijski U. Tumor necrosis factor-α-accelerated degradation of type I collagen in human skin is associated with elevated matrix metalloproteinase (MMP)-1 and MMP-3 ex vivo. European Journal of Cell Biology. 2015;94:12–21. doi: 10.1016/j.ejcb.2014.10.001. - DOI - PMC - PubMed
    1. Abate M, Schiavone C, Salini V. Sonographic evaluation of the shoulder in asymptomatic elderly subjects with diabetes. BMC Musculoskeletal Disorders. 2010;11:278. doi: 10.1186/1471-2474-11-278. - DOI - PMC - PubMed
    1. Ackerman JE, Geary MB, Orner CA, Bawany F, Loiselle AE. Obesity/Type II diabetes alters macrophage polarization resulting in a fibrotic tendon healing response. PLOS ONE. 2017;12:e0181127. doi: 10.1371/journal.pone.0181127. - DOI - PMC - PubMed
    1. Andrews RC, Walker BR. Glucocorticoids and insulin resistance: old hormones, new targets. Clinical Science. 1999;96:513–523. - PubMed
    1. Baranyi U, Winter B, Gugerell A, Hegedus B, Brostjan C, Laufer G, Messner B. Primary human fibroblasts in culture switch to a myofibroblast-like phenotype independently of TGF beta. Cells. 2019;8:721. doi: 10.3390/cells8070721. - DOI - PMC - PubMed

LinkOut - more resources