. 2020 Jun 10:10:270.
doi: 10.3389/fcimb.2020.00270. eCollection 2020.

Generation of Novel Plasmodium falciparum NF135 and NF54 Lines Expressing Fluorescent Reporter Proteins Under the Control of Strong and Constitutive Promoters

Affiliations

Generation of Novel Plasmodium falciparum NF135 and NF54 Lines Expressing Fluorescent Reporter Proteins Under the Control of Strong and Constitutive Promoters

Shinya Miyazaki et al. Front Cell Infect Microbiol. .

Abstract

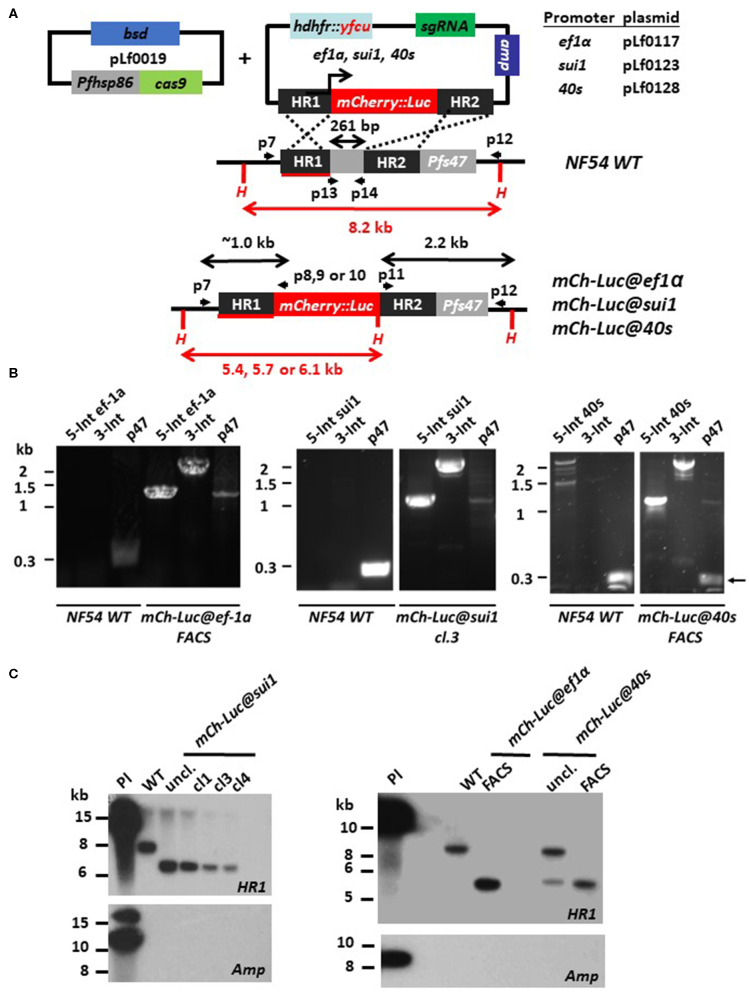
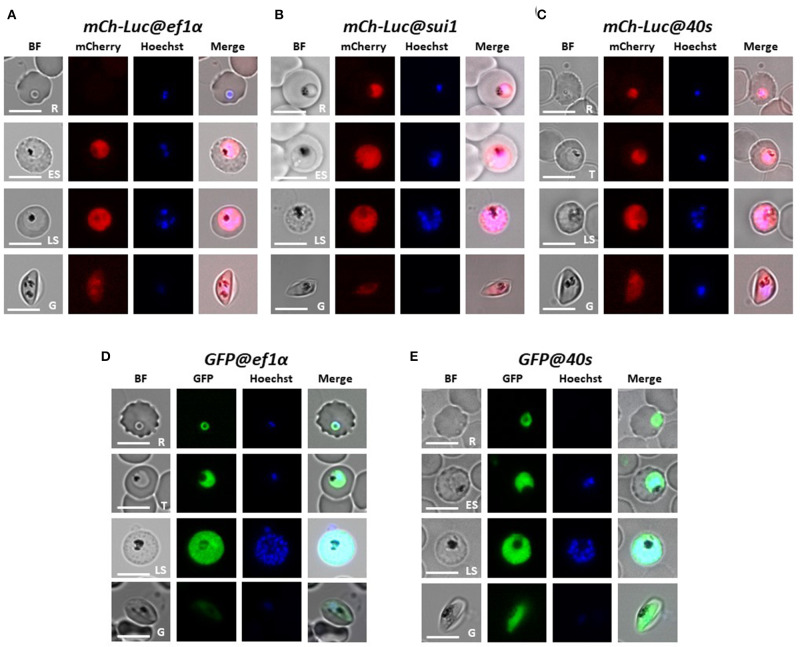
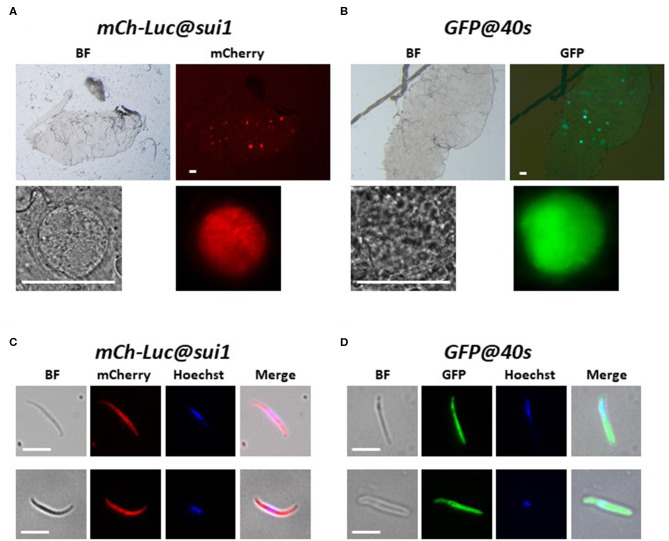
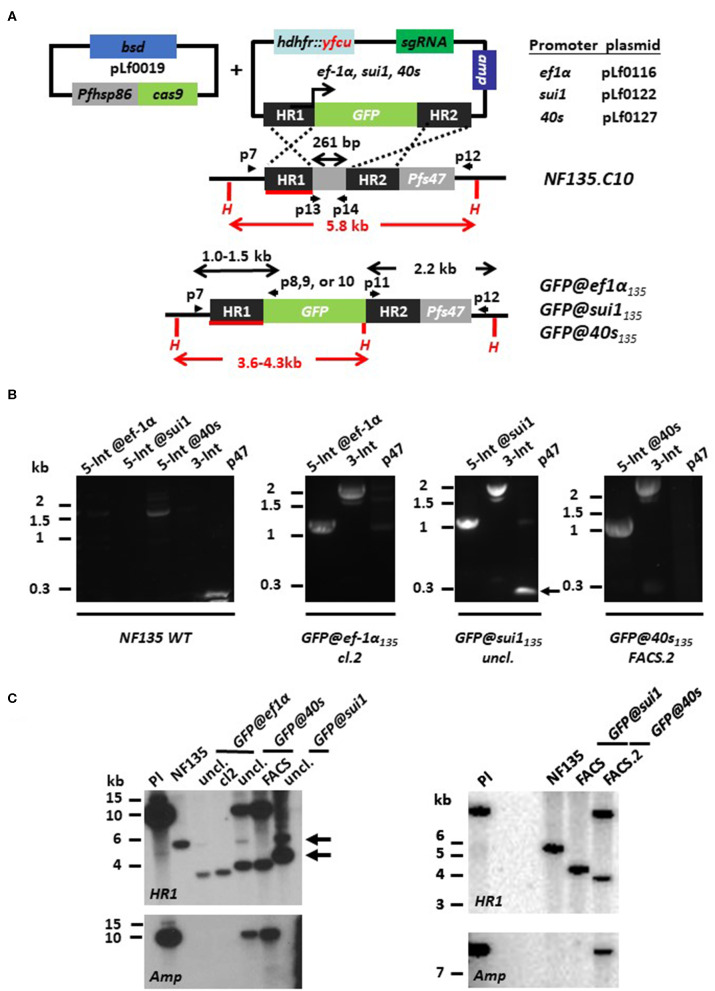
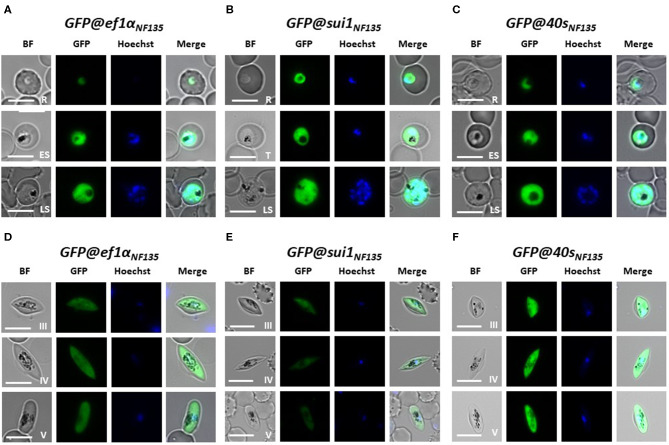
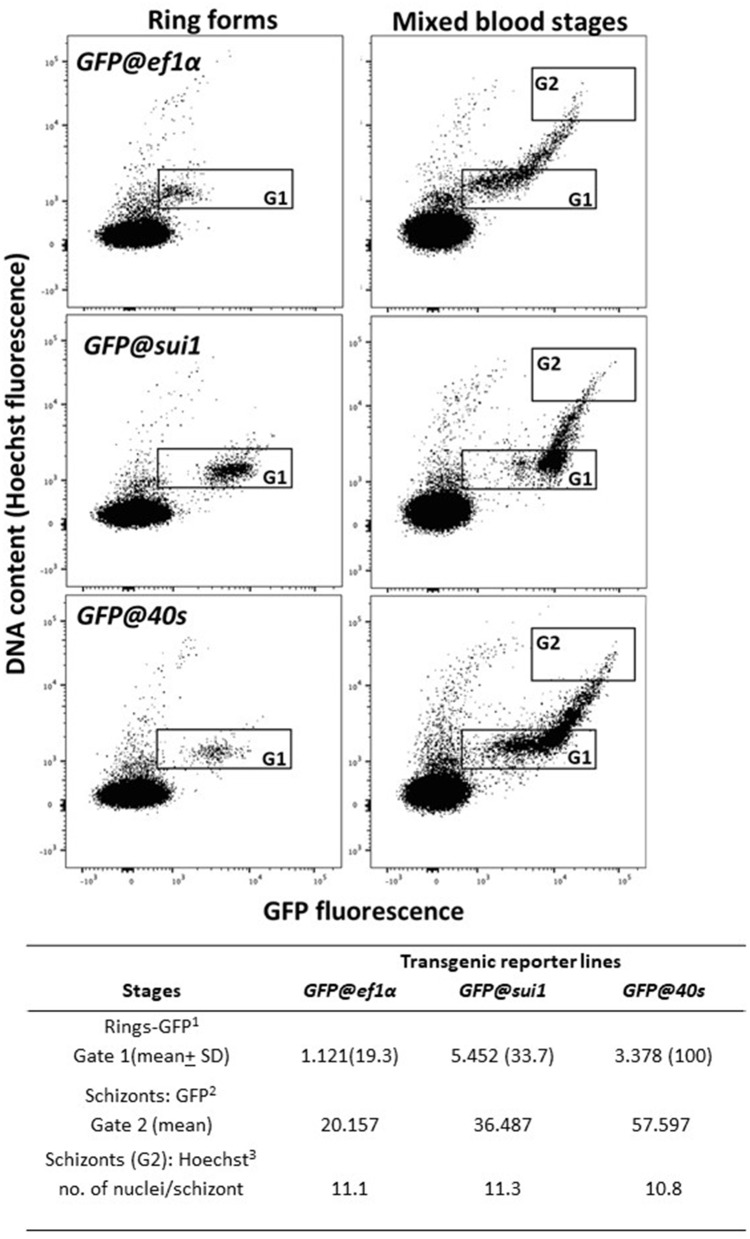
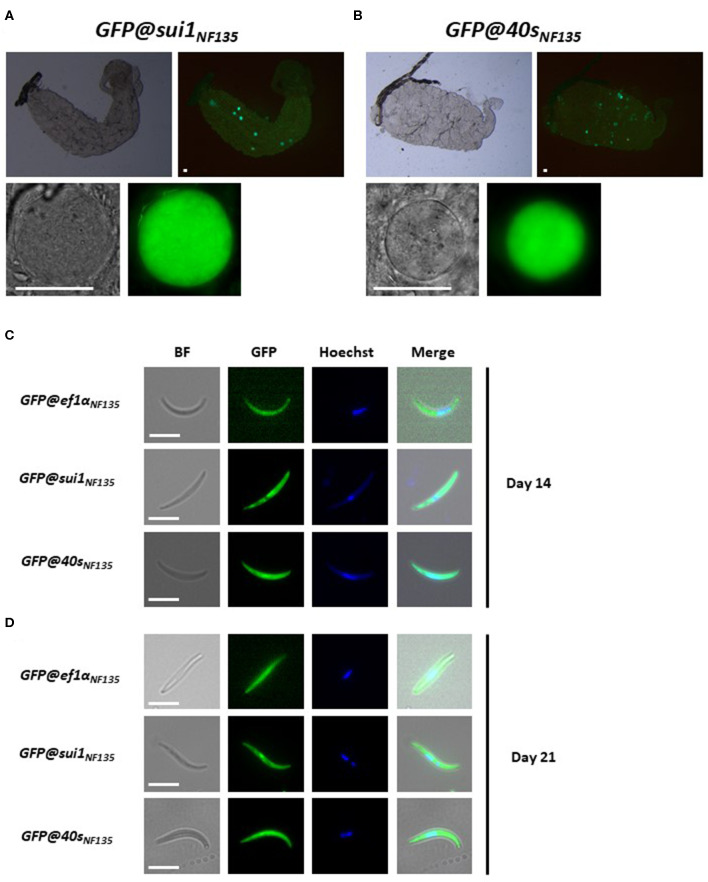
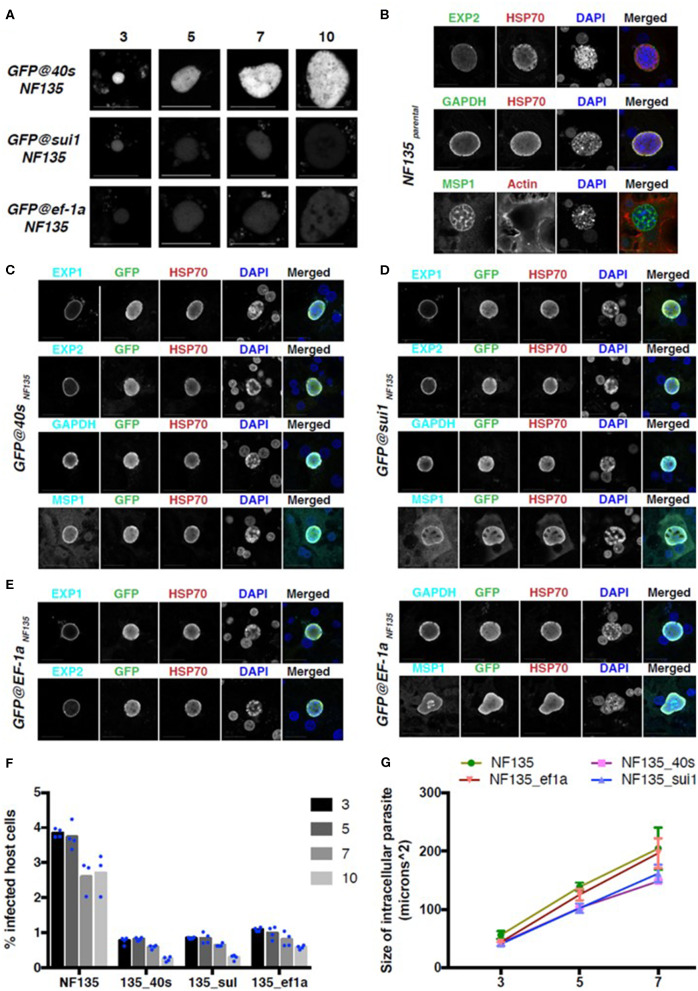
Transgenic reporter lines of malaria parasites that express fluorescent or luminescent proteins are valuable tools for drug and vaccine screening assays as well as to interrogate parasite gene function. Different Plasmodium falciparum (Pf ) reporter lines exist, however nearly all have been created in the African NF54/3D7 laboratory strain. Here we describe the generation of novel reporter lines, using CRISPR/Cas9 gene modification, both in the standard Pf NF54 background and in a recently described Cambodian P. falciparum NF135.C10 line. Sporozoites of this line show more effective hepatocyte invasion and enhanced liver merozoite development compared to Pf NF54. We first generated Pf NF54 reporter parasites to analyze two novel promoters for constitutive and high expression of mCherry-luciferase and GFP in blood and mosquito stages. The promoter sequences were selected based on available transcriptome data and are derived from two housekeeping genes, i.e., translation initiation factor SUI1, putative (sui1, PF3D7_1243600) and 40S ribosomal protein S30 (40s, PF3D7_0219200). We then generated and characterized reporter lines in the Pf NF135.C10 line which express GFP driven by the sui1 and 40s promoters as well as by the previously used ef1α promoter (GFP@ef1α, GFP@sui1, GFP@40s). The GFP@40s reporter line showed strongest GFP expression in liver stages as compared to the other two lines. The strength of reporter expression by the 40s promoter throughout the complete life cycle, including liver stages, makes transgenic lines expressing reporters by the 40s promoter valuable novel tools for analyses of P. falciparum.

Keywords: CRISPR/Cas9; NF135; Plasmodium falciparum; liver stage; malaria; reporter lines.


Figures

Figure 1
Figure 1
Generation of P. falciparum NF54 reporter lines expressing mCherry-luciferase under control of ef1α, sui1, or 40s promoter. (A) Schematic representation of the Cas9 (pLf0019) and donor DNA plasmids (pL0117, pLf0123, pLf0128) constructs used to introduce the mCherry-luciferase expression cassette into the Pf NF54 p47 gene locus. The mCherry-luciferase fusion gene is under the control of the promoter of the ef1α, sui1, or 40s gene. The p47 homology regions (HR1, HR2) used to introduce the donor DNA (i.e., the mCherry-luciferase expression cassette), location of primers (p), sizes of restriction fragments (H: HpaI; in red), and PCR amplicons (in black) are indicated. Primer sequences (shown in black and bold) are shown in Table S1. WT, wild type; bsd, blasticidin selectable marker (SM); hdhfr::yfcu—SM in donor plasmid. (B) Diagnostic PCR confirms the correct 5′-integration of the plasmids into the genome of mCh-Luc@ef1α, mCh-Luc@sui1, mCh-Luc@40s parasites (5-Int; primers p7/p8 for ef1α 1,009 bp, p7/p9 for sui1 1,106 bp, p7/p10 for 40s 1,087 bp) and correct 3′-integration (3-Int; primers p11/p12; 2,188 bp). Primer locations and product sizes are shown in (A) and primer sequences in Table S1. The arrow indicates PCR product of WT p47 gene amplified by p13/p14 primers. The weak 1.2 kb band with the p47-primers is a non-specific fragment which is observed in NF54 reporter lines with the mCherry-luc cassette and not in wild type parasites. (C) Southern analysis of HpaI restricted DNA to confirm correct integration of the plasmids into mCh-Luc@sui1 (plasmid pLf0123; left panel) and in mCh-Luc@ef1α and mCh-Luc@40s parasites (pLf0117 or pLf0128; right panel). Digested DNA was hybridized with a probe targeting the homology region 1 of p47 [HR1; shown in red; see (A)] showing the expected different-sized DNA fragments: WT 8.2 kb; mCh-luc@sui1 6.1 kb; mCh-luc@ef1α parasites 5.4 kb; mCh-luc@40s parasites 5.7 kb (in uncloned parasites the 8,2 kb WT fragment is present). The absence of hybridization of digested DNA with a probe for ampicillin (amp) confirms the absence of donor DNA plasmid and single crossover integration WT, wild type; uncl., uncloned parasite population; cl, clone; Pl, plasmid.
Figure 2
Figure 2
Expression of reporter proteins GFP or mCherry-luciferase in asexual blood stages and gametocytes of five transgenic Pf NF54 reporter lines. Representative fluorescence microscopy images of live mCh-Luc@ef1α, mCh-Luc@sui1, mCh-Luc@40s (A–C) and GFP@ef1α and GFP@40s (D,E) asexual blood-stages (R, rings; T, trophozoites; ES, early schizonts; LS, late schizonts) and stage III gametocyte (G). Nuclei were stained with Hoechst-33342. All pictures were recorded with standardized exposure/gain times to visualize differences in fluorescence intensity [GFP 0.7s; mCherry 1.0 s; Hoechst 0.2 s; bright field 0.1 s (1x gain)]. Bright field (BF). Scale bar, 7 μm.
Figure 3
Figure 3
Expression of reporter proteins in oocysts and sporozoites of the transgenic Pf NF54 reporter lines mCherry-luc@sui1 and GFP@40s. (A,B) Representative fluorescence microscopy images of live oocysts of mCherry-Luc@sui1 and GFP@40s parasites in A. stephensi mosquitoes (day 12 after infection). Upper panel: oocysts in complete midgut and representative oocyst in lower panel. Bright field (BF). Scale bar, 40 μm. (C,D) Representative fluorescence microscopy images of live salivary gland sporozoites of mCherry-Luc@sui1 and GFP@40s (day 21 after infection). Nuclei were stained with Hoechst33342. All pictures were recorded with standardized exposure/gain times to visualize differences in fluorescence intensity [GFP 0.7s: mCherry 1.0 s; Hoechst 0.2 s; bright field 0.1 s (1x gain)]. Bright field (BF). Scale bar, 7 μm.
Figure 4
Figure 4
Generation of P. falciparum NF135 reporter lines expressing GFP under control of ef1α, sui1 or 40s promoter. (A) Schematic representation of the Cas9 (pLf0019) and sgRNA/donor (pL0116, pLf0122, pLf0127) constructs used to introduce the GFP expression cassette into the P. falciparum NF135 p47 gene locus. The GFP gene is under the control of the promoter of the ef1α, sui1, or 40s genes. The p47 homology regions (HR1, HR2) used to introduce the donor DNA (i.e., the GFP expression cassette), location of primers (p), sizes of restriction fragments (H: HpaI; in red) and PCR amplicons (in black) are indicated. Primer sequences (shown in black and bold) are shown in Table S1. WT, wild type; bsd, blasticidin selectable marker (SM); hdhfr::yfcu—SM in donor plasmid. (B) Diagnostic PCR confirms the correct 5′ integration into the genome of GFP@ef1α135, GFP@sui1135, or GFP@40s135 (5-Int; primers p7/p8 for ef1α 1,009 bp, p7/p9 for sui1 1,106 bp, p7/p10 for 40s 1,087 bp) and correct 3′ integration (3-Int; primers p11/p12; 2,188 bp). In addition, it shows absence of the p47 gene in GFP@ef1α135 clone 2 and in the FACS sorted line of GFP@40s135 (p47 primers p13/p14; 216 bp). Primer locations and product sizes are shown in (A) and primer sequences in Table S1. The arrow indicates PCR product of WT p47 gene amplified by p13/p14 primers. The weak 1.5 kb band with the 5-Int@40s-primers is a non-specific fragment which is only present in WT with and not in the transgenic lines with the GFP cassette. (C) Southern analysis of HpaI restricted DNA to confirm correct integration of the plasmids in the three transgenic lines. Digested DNA was hybridized with a probe targeting the homology region 1 of p47 [HR1; shown in red; see (A)] and with a probe recognizing ampicillin (Amp; fragment of ~10 kb). Left panel: WT NF135 shows the expected 5.8 kb fragment. In both uncloned and clone 2 of GFP@ef1α135 parasites the expected 3.6 kb fragment is present after double crossover (DXO) integration. In uncloned and FACS-sorted populations of GFP@40s135 parasites two fragments with the expected sizes of 3.8 kb and ~10 kb of single crossover integration are present whereas in the uncloned GFP@sui1 the expected fragment of 4.3 kb of double crossover integration and the fragment of 5.8 kb of WT is present (see arrows). Hybridization with the Amp probe shows the single crossover events in the GFP@40s populations. Right panel: After additional FACS sorting of GFP-positive parasites Southern analysis shows the expected 5.8 kb fragment in GFP@sui1 of double crossover integration whereas in GFP@40s the two fragments are present with the expected sizes of 3.8 kb and ~10 kb of single crossover integration. The presence of SXO parasites in GFP@40s135 is confirmed by hybridization with a probe recognizing ampicillin (Amp; fragment of ~10 kb).
Figure 5
Figure 5
Expression of GFP in asexual blood stages and gametocytes of three transgenic Pf NF135 reporter lines. Representative fluorescence microscopy images of live GFP@ef1αNF135, GFP@sui1 NF135, and GFP@40sNF135 asexual blood-stages (A–C) and gametocytes (D–F). R, rings; T, trophozoites; S, schizonts; G, gametocytes stage III, IV, and V. Nuclei were stained with Hoechst-33342. All pictures were recorded with standardized exposure/gain times to visualize differences in fluorescence intensity [GFP 0.7 s; Hoechst 0.2 s; bright field 0.1 s (1x gain)]. Bright field (BF) Scale bar, 7 μm.
Figure 6
Figure 6
GFP and Hoechst33258 fluorescence intensities of ring forms and schizonts in transgenic PfNF135 reporter lines based on FACS analysis. Fluorescence intensity of rings (left panel) and mixed blood stages (right panel) as determined by flow cytometry. Infected red blood cells (RBC) were stained with the DNA-specific dye Hoechst33258 to distinguish infected RBC from uninfected RBC. Left panel: Gate 1: synchronized ring forms; Right panels: Gate 2 (G2): schizonts. The gate is set at 8-45x the mean Hoechst fluorescence value of ring forms. The panels show dot plots of both Hoechst fluorescence intensity (DNA content; x-axis) and GFP fluorescence intensity (y-axis). In the Table the mean values are shown of the GFP-intensity of ring forms in G1 and schizonts in G2. 1GFP fluorescence intensity of (ring) infected red blood cells in Gate 1 2GFP fluorescence intensity of (schizont) infected red blood cells in Gate 2. 3The number of nuclei is calculated by dividing the mean Hoechst fluorescence intensity of schizonts in Gate 2 by the mean Hoechst fluorescence intensity of rings in Gate 1.
Figure 7
Figure 7
Expression of GFP in oocysts and sporozoites of the transgenic Pf NF135 reporter lines. (A,B) Representative fluorescence microscopy images of live oocysts of GFP@sui1 and GFP@40s parasites in A. stephensi mosquitoes. Upper panel: oocysts in complete midgut and representative oocyst in lower panel. Scale bar, 40 μm. (C,D) Representative GFP-fluorescence microscopy images of live salivary gland sporozoites of GFP@ef1αNF135, GFP@sui1NF135, and GFP@40sNF135 collected at day 14 and 21 after infection. Nuclei were stained with Hoechst33342. Bright field (BF). Scale bar, 7 μm.
Figure 8
Figure 8
GFP expression and development in three NF135 reporter lines in the liver stage. (A) Representative GFP-fluorescence microscopy images of liver stage parasites of GFP@ef1αNF135, GFP@sui1NF135, and GFP@40sNF135 at different days after adding sporozoites to primary human hepatocytes. Scale bar, 25 μm. (B–E) Representative confocal microscopy images of liver stage parasites on day 7 for Pf NF135parental (B), GFP@40sNF135 (C), GFP@sui1NF135 (D), and GFP@ef1αNF135 (E). Parasites were stained with antibodies against the P. falciparum proteins EXP1, EXP2, GAPDH, and MSP1 (cyan), HSP70 (red) and against GFP (green). DNA was stained with DAPI (blue). Scale bar, 25 μm. (F) The percentage of host cells infected with Pf NF135, GFP@40sNF135, GFP@sui1NF135, and GFP@ef1αNF135 on day 3, 5, 7, and 10 post invasion. Each dot represents one well from one experiment. (G) The size of intracellular parasites on day 3, 5, or 7 post invasion for Pf NF135, GFP@40sNF135, GFP@sui1NF135, and GFP@ef1αNF135. At least 50 cells were measured per well, resulting in a total of ~150 cells (3 wells per time point). The average of medians from triplicates and S.D. are shown. Dunnett's multiple comparison test was performed: p-value between Pf NF135 and GFP@40sNF135 is 0.0023; Pf NF135 and GFP@sui1NF135 is 0.0045; and Pf NF135 WT and GFP@ef1αNF135 is 0.3153.

Similar articles

Cited by

References

    1. Adjalley S. H., Johnston G. L., Li T., Eastman R. T., Ekland E. H., Eappen A. G., et al. . (2011). Quantitative assessment of Plasmodium falciparum sexual development reveals potent transmission-blocking activity by methylene blue. Proc. Natl. Acad. Sci. U.S.A. 108, E1214–E1223. 10.1073/pnas.1112037108 - DOI - PMC - PubMed
    1. Caldelari R., Dogga S., Schmid M. W., Franke-Fayard B., Janse C., Soldati-Favre D., et al. . (2019). Transcriptome analysis of Plasmodium berghei during exo-erythrocytic development. Malar. J. 18:330. 10.1186/s12936-019-2968-7 - DOI - PMC - PubMed
    1. Cubi R., Vembar S. S., Biton A., Franetich J. F., Bordessoulles M., Sossau D, et al. . Laser capture microdissection enables transcriptomic analysis of dividing quiescent liver stages of Plasmodium relapsing species. Cell Microbiol. (2017) 19:e12735. 10.1111/cmi.12735. - DOI - PMC - PubMed
    1. Cui L., Miao J., Wang J., Li Q. (2008). Plasmodium falciparum: development of a transgenic line for screening antimalarials using firefly luciferase as the reporter. Exp. Parasitol. 120, 80–87. 10.1016/j.exppara.2008.05.003 - DOI - PMC - PubMed
    1. Deitsch K., Driskill C., Wellems T. (2001). Transformation of malaria parasites by the spontaneous uptake and expression of DNA from human erythrocytes. Nucleic Acids Res. 29, 850–853. 10.1093/nar/29.3.850 - DOI - PMC - PubMed

Publication types

LinkOut - more resources