. 2020 Jun 10:8:512.
doi: 10.3389/fbioe.2020.00512. eCollection 2020.

Dual-Targeting Nanoparticle-Mediated Gene Therapy Strategy for Hepatocellular Carcinoma by Delivering Small Interfering RNA

Affiliations

Dual-Targeting Nanoparticle-Mediated Gene Therapy Strategy for Hepatocellular Carcinoma by Delivering Small Interfering RNA

Qi Chang Zheng et al. Front Bioeng Biotechnol. .

Erratum in

Abstract

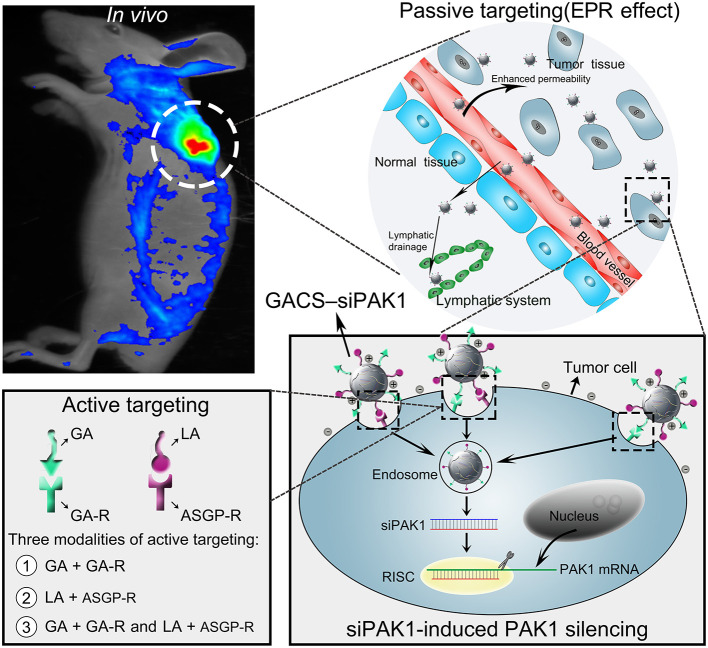
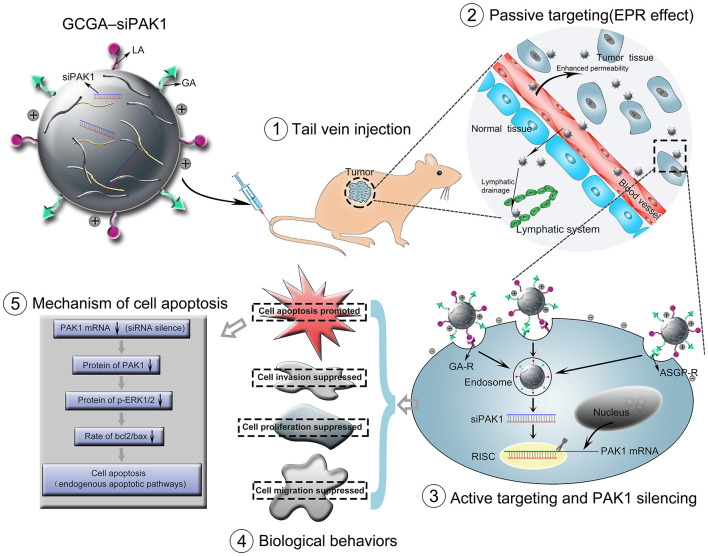
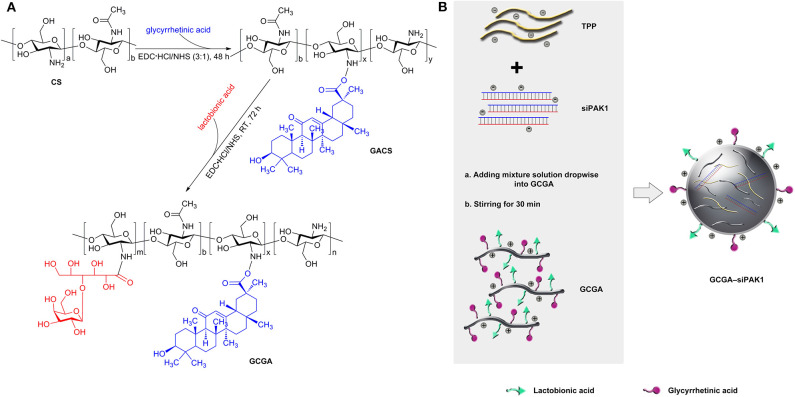
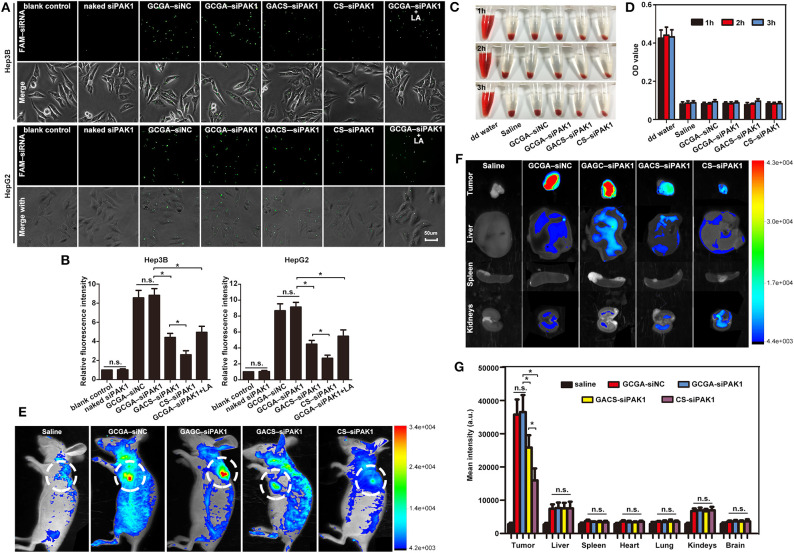
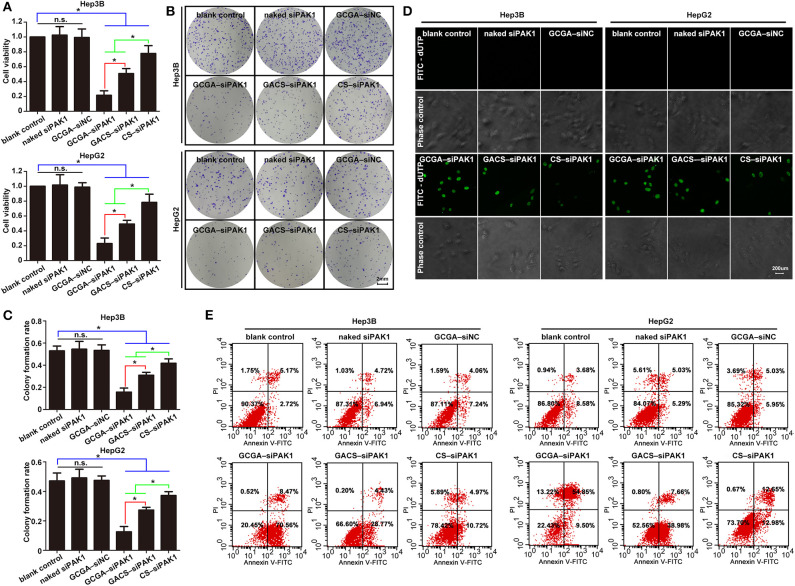
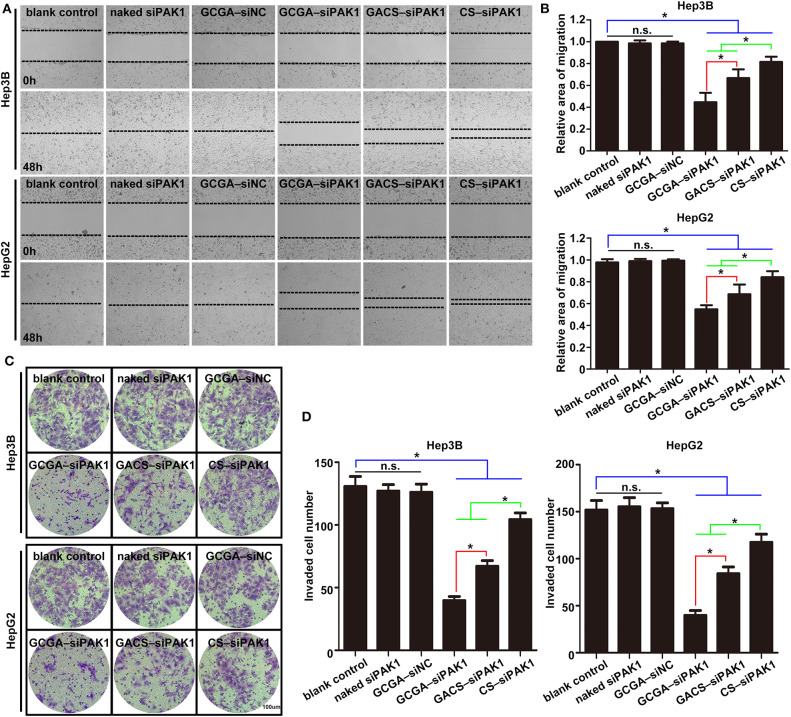
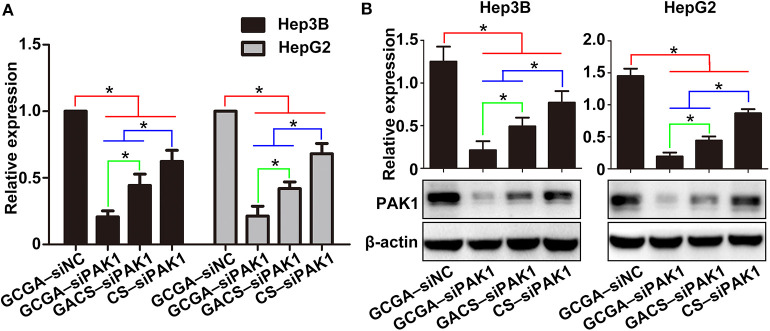
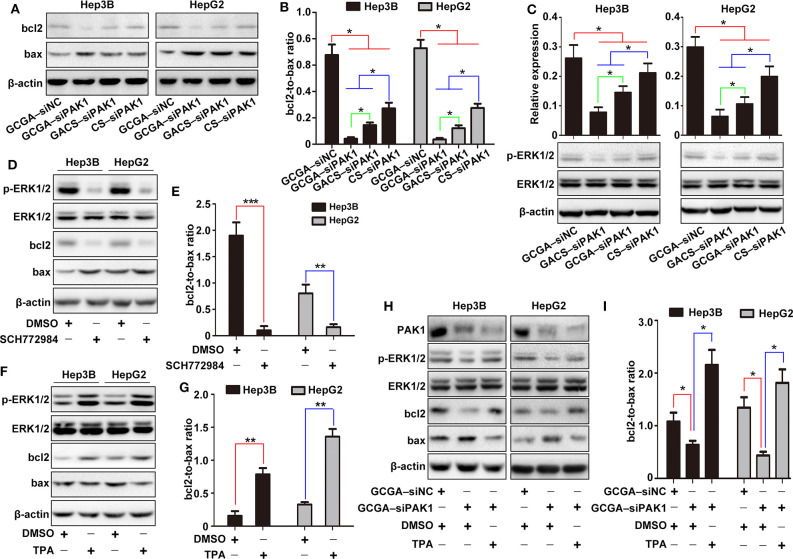
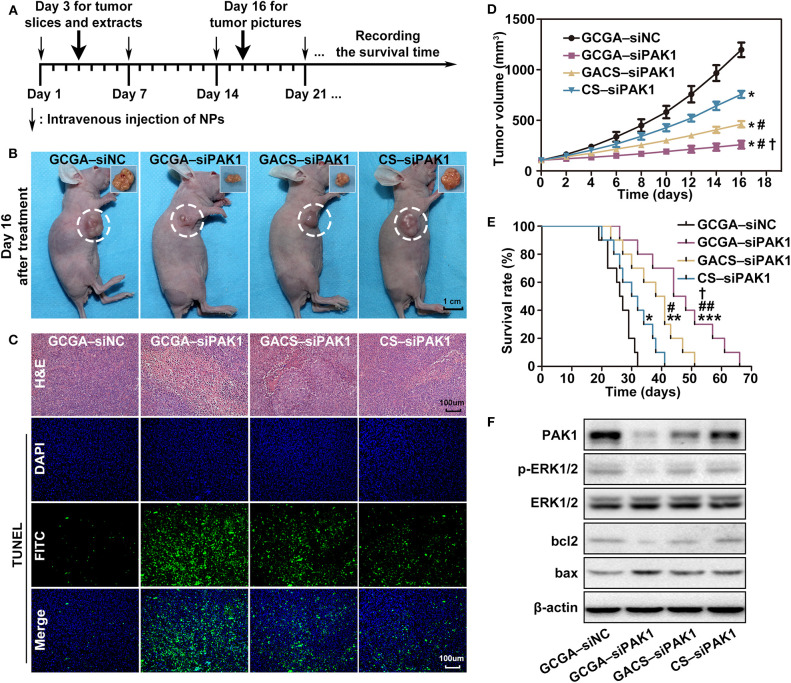
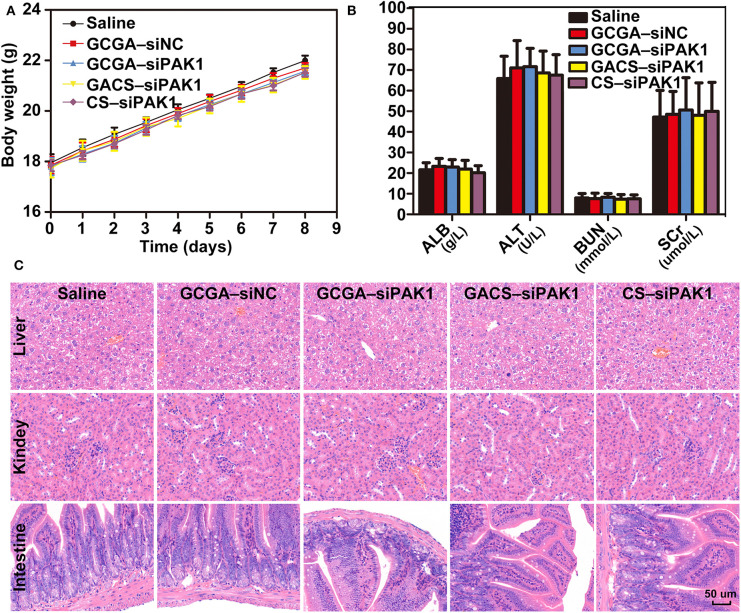
As a gene therapy strategy, RNA interference (RNAi) offers tremendous tumor therapy potential. However, its therapeutic efficacy is restricted by its inferior ability for targeted delivery and cellular uptake of small interfering RNA (siRNA). This study sought to develop a dual-ligand nanoparticle (NP) system loaded with siRNA to promote targeted delivery and therapeutic efficacy. We synthesized a dual receptor-targeted chitosan nanosystem (GCGA), whose target function was controlled by the ligands of galactose of lactobionic acid (LA) and glycyrrhetinic acid (GA). By loading siPAK1, an siRNA targeting P21-activated kinase 1 (PAK1), a molecular-targeted therapeutic dual-ligand NP (GCGA-siPAK1) was established. We investigated the synergistic effect of these two targeting units in hepatocellular carcinoma (HCC). In particular, GCGA-siPAK1 enhanced the NP targeting ability and promoted siPAK1 cell uptake. Subsequently, dramatic decreases in cell proliferation, invasion, and migration, with an apparent increase in cell apoptosis, were observed in treated cells. Furthermore, this dual-ligand NP gene delivery system demonstrated significant anti-tumor effects in tumor-bearing mice. Finally, we illuminated the molecular mechanism, whereby GCGA-siPAK1 promotes endogenous cell apoptosis through the PAK1/MEK/ERK pathway. Thus, the dual-target property effectively promotes the HCC therapeutic effect and provides a promising gene therapy strategy for clinical applications.

Keywords: chitosan; drug delivery; gene therapy; hepatocellular carcinoma; small interfering RNA; targeted therapy.


Figures

Graphical Abstract
Graphical Abstract
Figure 1
Figure 1
Schematic representation of GCGA–siPAK1 promoting targeted delivery and therapeutic efficacy in HCC xenograft mouse model. The process includes four steps: (1) intravenous administration of GCGA–siPAK1 via tail vein; (2) NPs accumulation in tumor tissue via passive targeting (commonly known as the EPR effect); (3) three modalities of active targeting via dual-ligand-receptor-mediated endocytosis and mechanism of RNAi (siPAK1-induced PAK1 silencing); (4) tumor biological behaviors after PAK1 silencing; and (5) molecular mechanism of promoting cell apoptosis via PAK1/MEK/ERK pathway.
Figure 2
Figure 2
Schematic of dual-ligand GA and LA-modified CS NPs entrapped by siPAK1 (namely, GCGA–PAK1). (A) Synthetic route of GACS and GCGA. (B) Schematic of the fabrication of GCGA–siPAK1 by ionic gelation method.
Figure 3
Figure 3
Characterizations of NPs. (A) Size, zeta potentials and encapsulation efficiencies of NPs. Data represents the mean ± SD (n = 3). PDI, polydispersity index. (B) Representative TEM images of NPs. (C) Release profiles of siRNA from all NPs in pH = 5.0 and 7.4, respectively. Data represents the mean ± SD (n = 3).
Figure 4
Figure 4
Enhanced cellular uptake of GCGA–siPAK1 in vitro and in vivo, and hemocompatibility. (A) Fluorescence images of HCC cells incubated with GCGA–siNC, GCGA–siPAK1, GACS–siPAK1, and CS-siPAK1 at a final FAM-labeled siRNA concentration of 120 nM for 4 h under the same conditions; and fluorescence images of GCGA–siPAK1 in HCC cells pretreated with free LA (100 μg/mL) for 30 min (in the seventh column). (B) Statistical analysis of fluorescence intensity according to (A). (C) Photographs displaying mixtures of RBCs with NPs after sample centrifugation. (D) Quantitative results of hemoglobin in supernatant. (E) Biodistribution of NPs in tumor-bearing mice treated with siRNA-loaded NPs (equivalent siRNA; final siRNA concentration of 120 nM) through tail vein injection. Images were captured at 8 h following injection. White circles indicate tumor sites. (F) Ex vivo fluorescence images of tumor tissue and various organs from mice injected with NPs. The mice were sacrificed 8 h after injection. (G) Statistical analysis of fluorescence intensity according to (F). The data represent the mean ± SD (n = 3). *P < 0.05; NS, not significant.
Figure 5
Figure 5
GCGA–siPAK1 suppressed cell proliferation and promoted cell apoptosis with maximum efficiency. (A) The cell viability was evaluated using CCK8 assaying after treatment. Data represents the mean ± SD; *P < 0.05; N.S., not significant. (B) The colony-forming ability was measured by colony-forming assaying after treatment. (C) Statistical analysis of colony-forming efficiency according to (B). Data represents the mean ± SD; *P < 0.05; N.S., not significant. (D) Cell apoptosis as examined by the One Step TUNEL Apoptosis Assay Kit. (E) Cell apoptosis as determined by flow cytometry assays using the Annexin V-FITC Apoptosis Detection Kit.
Figure 6
Figure 6
GCGA–siPAK1 suppression of cell migration and invasion with greatest efficiency. (A) Cell migration ability was evaluated by a wound-healing assay after treatment. (B) Statistical analysis of the cell migration rate according to (A). Data represents the mean ± SD; *P < 0.05; N.S., not significant. (C) The cell invasiveness was evaluated by Transwell assay after treatment. (D) Statistical analysis of cell invasion rate according to (C). Data represents the mean ± SD; *P < 0.05; N.S., not significant.
Figure 7
Figure 7
GCGA–siPAK1 inhibition of PAK1 expression in HCC cells. (A) PAK1 mRNA expression in HCC cell lines after treatment. (B) Protein expression of PAK1 measured by western blot analysis. Data represents the mean ± SD; *P < 0.05.
Figure 8
Figure 8
Molecular mechanism of GCGA–siPAK1-induced cell apoptosis in HCC cells. (A) Expression of bcl2 and bax measured by western blot. (B) Ratio of bcl2 to bax calculated according to (A). Data represents the mean ± SD; *P < 0.05. (C) Expression of p-ERK1/2. The ERK1/2 protein was measured as an internal reference. Data represents the mean ± SD; *P < 0.05. (D) Expression of p-ERK1/2, bcl2, and bax following treatment with the p-ERK1/2 inhibitor (SCH772984) for 24 h. The ERK1/2 protein was measured as an internal reference. (E) Expression ratio of bcl2 to bax calculated according to (D). Data represents the mean ± SD; **P < 0.01 and ***P < 0.001. (F) Expression of p-ERK1/2, bcl2, and bax following treatment with p-ERK1/2 activator (TPA) for 24 h. The ERK1/2 protein was measured as an internal reference. (G) Expression ratio of bcl2 to bax calculated according to (F). Data represents the mean ± SD; **P < 0.01. (H) Cells pretreated with or without TPA were incubated in the NPs. The protein expressions of PAK1, p-ERK1/2, bcl2, and bax were then measured. (I) Expression ratio of bcl2 to bax calculated according to (H). Data represents the mean ± SD; *P < 0.05.
Figure 9
Figure 9
Inhibition of GCGA–siPAK1 for HCC in vivo. (A) Timeline for the assessment of the antitumor activities of the NPs in subcutaneous xenograft model. (B) Antitumor effect in vivo; photographs of xenografted tumors on day 16 after treatment. (C) H&E staining for pathological changes in tumor sections (top row). TUNEL staining (green) for apoptosis in tumor sections (three bottom rows). Blue fluorescence localized in the cell nuclei. (D) Tumor volume growth curves at different time points following treatments in four groups (n = 4 per group). Data represents the mean ± SD; *P < 0.05, compared with GCGA–siNC group; #P < 0.05, compared with CS-siPAK1 group; and P < 0.05, compared with GACS–siPAK1 group. (E) Survival curves of mice in four groups with different treatments (n = 10 per group). *P < 0.05, **P < 0.01, and ***P < 0.001, compared with GCGA–siNC group; #P < 0.05 and ##P < 0.01, compared with CS–siPAK1 group; and P < 0.05, compared with GACS–siPAK1 group. (F) Protein expressions of PAK1, p-ERK1/2, bcl2, and bax in tumor tissues.
Figure 10
Figure 10
Systemic toxicity evaluation in vivo. (A) Body weight changes in BALB/c mice after respective treatments. Data represents the mean ± SD. (B) Blood biochemistry analysis of mice injected with NPs. Data represents the mean ± SD. (C) Histopathologic images (H&E staining, 400×) of various organ sections in mice on the eighth day following treatments.

Similar articles

Cited by

References

    1. Abdelrahman M., Eyrolles L. D., Alkarib S. Y., Herve-Aubert K., Ben Djemaa S., Marchais H., et al. . (2017). siRNA delivery system based on magnetic nanovectors: characterization and stability evaluation. Eur. J. Pharm. Sci. 106, 287–293. 10.1016/j.ejps.2017.05.062 - DOI - PubMed
    1. Ballet F. (1990). Hepatic circulation: potential for therapeutic intervention. Pharmacol. Ther. 47, 281–328. - PMC - PubMed
    1. Chalbatani G. M., Dana H., Gharagouzloo E., Grijalvo S., Eritja R., Logsdon C. D., et al. . (2019). Small interfering RNAs (siRNAs) in cancer therapy: a nano-based approach. Int. J. Nanomed. 14, 3111–3128. 10.2147/Ijn.S200253 - DOI - PMC - PubMed
    1. Chen H. X., Li M., Wan T., Zheng Q. C., Cheng M. R., Huang S. Q., et al. . (2012). Design and synthesis of dual-ligand modified chitosan as a liver targeting vector. J. Mater. Sci. Mater. Med. 23, 431–441. 10.1007/s10856-011-4494-1 - DOI - PubMed
    1. Cheng A. L., Kang Y. K., Chen Z. D., Tsao C. J., Qin S. K., Kim J. S., et al. . (2009). Efficacy and safety of sorafenib in patients in the Asia-Pacific region with advanced hepatocellular carcinoma: a phase III randomised, double-blind, placebo-controlled trial. Lancet Oncol. 10, 25–34. 10.1016/S1470-2045(08)70285-7 - DOI - PubMed