

Preclinical ex-vivo Testing of Anti-inflammatory Drugs in a Bovine Intervertebral Degenerative Disc Model
- PMID: 32587853
- PMCID: PMC7298127
- DOI: 10.3389/fbioe.2020.00583
Preclinical ex-vivo Testing of Anti-inflammatory Drugs in a Bovine Intervertebral Degenerative Disc Model
Abstract
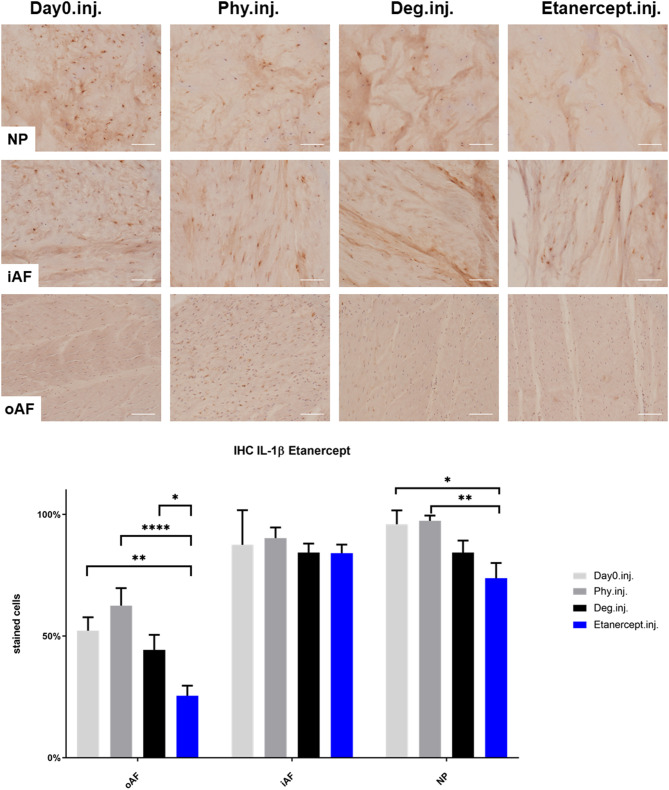
Discogenic low back pain (LBP) is a main cause of disability and inflammation is presumed to be a major driver of symptomatic intervertebral disc degeneration (IDD). Anti-inflammatory agents are currently under investigation as they demonstrated to alleviate symptoms in patients having IDD. However, their underlying anti-inflammatory and regenerative activity is poorly explored. The present study sought to investigate the potential of Etanercept and Tofacitinib for maintaining disc homeostasis in a preclinical intervertebral disc (IVD) organ culture model within IVD bioreactors allowing for dynamic loading and nutrient exchange. Bovine caudal IVDs were cultured in a bioreactor system for 4 days to simulate physiological or degenerative conditions: (1) Phy-physiological loading (0.02-0.2 MPa; 0.2 Hz; 2 h/day) and high glucose DMEM medium (4.5 g/L); (2) Deg+Tumor necrosis factor α (TNF-α)-degenerative loading (0.32-0.5 MPa; 5 Hz; 2 h/day) and low glucose DMEM medium (2 g/L), with TNF-α injection. Etanercept was injected intradiscally while Tofacitinib was supplemented into the culture medium. Gene expression in the IVD tissue was measured by RT-qPCR. Release of nitric oxide (NO), interleukin 8 (IL-8) and glycosaminoglycan (GAG) into the IVD conditioned medium were analyzed. Cell viability in the IVD was assessed using lactate dehydrogenase and ethidium homodimer-1 staining. Immunohistochemistry was performed to assess protein expression of IL-1β, IL-6, IL-8, and collagen type II in the IVD tissue. Etanercept and Tofacitinib downregulated the expression of IL-1β, IL-6, IL-8, Matrix metalloproteinase 1 (MMP1), and MMP3 in the nucleus pulposus (NP) tissue and IL-1β, MMP3, Cyclooxygenase-2 (COX2), and Nerve growth factor (NGF) in the annulus fibrosus (AF) tissue. Furthermore, Etanercept significantly reduced the IL-1β positively stained cells in the outer AF and NP regions. Tofacitinib significantly reduced IL-1β and IL-8 positively stained cells in the inner AF region. Both, Etanercept and Tofacitinib reduced the GAG loss to the level under physiological culture condition. Etanercept and Tofacitinib are able to neutralize the proinflammatory and catabolic environment in the IDD organ culture model. However, combined anti-inflammatory and anabolic treatment may be required to constrain accelerated IDD and relieving inflammation-induced back pain.
Keywords: 3R; bioreactor; disc degeneration; inflammation; intervertebral disc; organ culture; regeneration; spine.
Copyright © 2020 Li, Gehlen, Heizmann, Grad, Alini, Richards, Kubosch, Südkamp, Izadpanah, Kubosch and Lang.
Figures


Similar articles
-
An intervertebral disc whole organ culture system to investigate proinflammatory and degenerative disc disease condition.J Tissue Eng Regen Med. 2018 Apr;12(4):e2051-e2061. doi: 10.1002/term.2636. Epub 2018 Feb 6. J Tissue Eng Regen Med. 2018. PMID: 29320615
-
Nerve growth factor promotes expression of novel genes in intervertebral disc cells that regulate tissue degradation: Laboratory investigation.J Neurosurg Spine. 2014 Oct;21(4):653-61. doi: 10.3171/2014.6.SPINE13756. Epub 2014 Jul 25. J Neurosurg Spine. 2014. PMID: 25062286
-
Immunomodulation of Human Mesenchymal Stem/Stromal Cells in Intervertebral Disc Degeneration: Insights From a Proinflammatory/Degenerative Ex Vivo Model.Spine (Phila Pa 1976). 2018 Jun 15;43(12):E673-E682. doi: 10.1097/BRS.0000000000002494. Spine (Phila Pa 1976). 2018. PMID: 29189572
-
The role of IL-1β and TNF-α in intervertebral disc degeneration.Biomed Pharmacother. 2020 Nov;131:110660. doi: 10.1016/j.biopha.2020.110660. Epub 2020 Aug 24. Biomed Pharmacother. 2020. PMID: 32853910 Review.
-
Discogenic Low Back Pain: Anatomy, Pathophysiology and Treatments of Intervertebral Disc Degeneration.Int J Mol Sci. 2022 Dec 22;24(1):208. doi: 10.3390/ijms24010208. Int J Mol Sci. 2022. PMID: 36613651 Free PMC article. Review.
Cited by
-
Innovative immune mechanisms and antioxidative therapies of intervertebral disc degeneration.Front Bioeng Biotechnol. 2022 Oct 10;10:1023877. doi: 10.3389/fbioe.2022.1023877. eCollection 2022. Front Bioeng Biotechnol. 2022. PMID: 36299288 Free PMC article. Review.
-
A bovine nucleus pulposus explant culture model.J Orthop Res. 2022 Sep;40(9):2089-2102. doi: 10.1002/jor.25226. Epub 2021 Dec 5. J Orthop Res. 2022. PMID: 34812520 Free PMC article.
-
Oestrogen and Vibration Improve Intervertebral Disc Cell Viability and Decrease Catabolism in Bovine Organ Cultures.Int J Mol Sci. 2023 Mar 24;24(7):6143. doi: 10.3390/ijms24076143. Int J Mol Sci. 2023. PMID: 37047116 Free PMC article.
-
The role of biomechanical factors in models of intervertebral disc degeneration across multiple length scales.APL Bioeng. 2023 May 8;7(2):021501. doi: 10.1063/5.0137698. eCollection 2023 Jun. APL Bioeng. 2023. PMID: 37180733 Free PMC article. Review.
-
Diurnal Asymmetric Loading Modulates Cell Phenotype in Intervertebral Disc.JOR Spine. 2025 May 7;8(2):e70068. doi: 10.1002/jsp2.70068. eCollection 2025 Jun. JOR Spine. 2025. PMID: 40337077 Free PMC article.
References
-
- Andrade P., Hoogland G., Teernstra O. P., van Aalst J., van Maren E., Daemen M. A., et al. . (2016). Elevated levels of tumor necrosis factor-alpha and TNFR1 in recurrent herniated lumbar discs correlate with chronicity of postoperative sciatic pain. Spine J. 16, 243–251. 10.1016/j.spinee.2015.10.038 - DOI - PubMed
-
- Bachmeier B. E., Nerlich A. G., Weiler C., Paesold G., Jochum M., Boos N. (2007). Analysis of tissue distribution of TNF-alpha, TNF-alpha-receptors, and the activating TNF-alpha-converting enzyme suggests activation of the TNF-alpha system in the aging intervertebral disc. Ann. N.Y. Acad. Sci. 1096, 44–54. 10.1196/annals.1397.069 - DOI - PubMed
LinkOut - more resources
Full Text Sources
Research Materials
Miscellaneous