

Nomogram-Based Prediction of the Risk of Diabetic Retinopathy: A Retrospective Study
- PMID: 32587869
- PMCID: PMC7298262
- DOI: 10.1155/2020/7261047
Nomogram-Based Prediction of the Risk of Diabetic Retinopathy: A Retrospective Study
Abstract
Objectives: This study is aimed at developing a risk nomogram of diabetic retinopathy (DR) in a Chinese population with type 2 diabetes mellitus (T2DM).
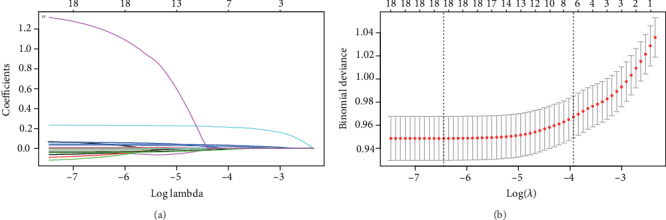
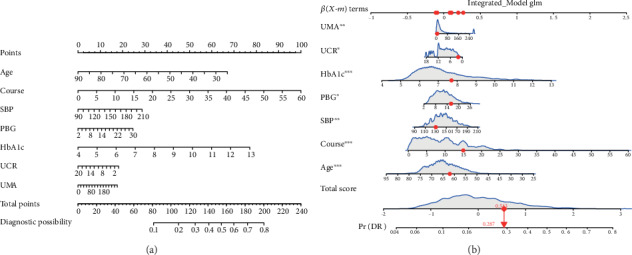
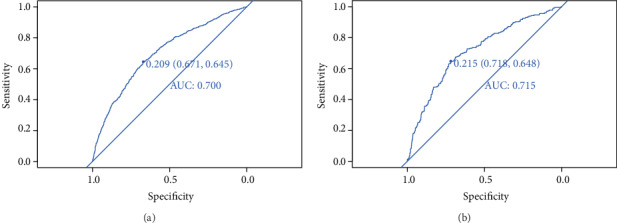
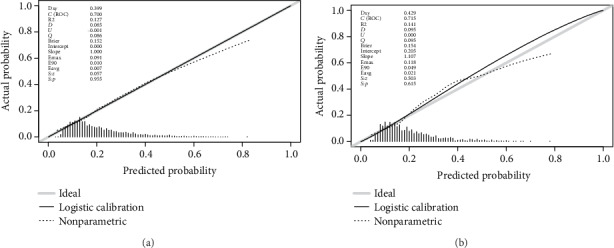
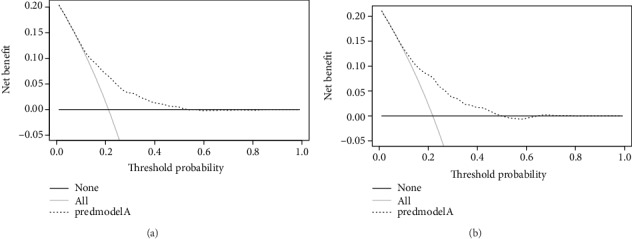
Methods: A questionnaire survey, biochemical indicator examination, and physical examination were performed on 4170 T2DM patients, and the collected data were used to evaluate the DR risk in T2DM patients. By operating R software, firstly, the least absolute shrinkage and selection operator (LASSO) regression analysis was used to optimize variable selection by running cyclic coordinate descent with 10 times K cross-validation. Secondly, multivariable logistic regression analysis was applied to build a predicting model introducing the predictors selected from the LASSO regression analysis. The nomogram was developed based on the selected variables visually. Thirdly, calibration plot, receiver operating characteristic (ROC) curve, and decision curve analysis were used to validate the model, and further assessment was running by external validation.
Results: Seven predictors were selected by LASSO from 19 variables, including age, course of disease, postprandial blood glucose (PBG), glycosylated haemoglobin A1c (HbA1c), uric creatinine (UCR), urinary microalbumin (UMA), and systolic blood pressure (SBP). The model built by these 7 predictors displayed medium prediction ability with the area under the ROC curve of 0.700 in the training set and 0.715 in the validation set. The decision curve analysis curve showed that the nomogram could be applied clinically if the risk threshold is between 21% and 57% and 21%-51% in external validation.
Conclusion: Introducing age, course of disease, PBG, HbA1c, UCR, UMA, and SBP, the risk nomogram is useful for prediction of DR risk in T2DM individuals.
Copyright © 2020 Ruohui Mo et al.
Conflict of interest statement
The author and coauthors declare no conflict of interest associated with this study.
Figures
Similar articles
-
Nomogram for the prediction of diabetic nephropathy risk among patients with type 2 diabetes mellitus based on a questionnaire and biochemical indicators: a retrospective study.Aging (Albany NY). 2020 Jun 2;12(11):10317-10336. doi: 10.18632/aging.103259. Epub 2020 Jun 2. Aging (Albany NY). 2020. PMID: 32484786 Free PMC article.
-
Nomogram for prediction of diabetic retinopathy in patients with type 2 diabetes mellitus: A retrospective study.J Diabetes Complications. 2022 Nov;36(11):108313. doi: 10.1016/j.jdiacomp.2022.108313. Epub 2022 Sep 21. J Diabetes Complications. 2022. PMID: 36183450
-
Development and external validation of a predictive model for type 2 diabetic retinopathy.Sci Rep. 2024 Jul 20;14(1):16741. doi: 10.1038/s41598-024-67533-5. Sci Rep. 2024. PMID: 39033211 Free PMC article.
-
Risk factor analysis and predictive model construction of lean MAFLD: a cross-sectional study of a health check-up population in China.Eur J Med Res. 2025 Feb 25;30(1):137. doi: 10.1186/s40001-025-02373-1. Eur J Med Res. 2025. PMID: 40001266 Free PMC article. Review.
-
Predicting vision-threatening diabetic retinopathy in patients with type 2 diabetes mellitus: Systematic review, meta-analysis, and prospective validation study.J Glob Health. 2024 Oct 11;14:04192. doi: 10.7189/jogh.14.04192. J Glob Health. 2024. PMID: 39391902 Free PMC article.
Cited by
-
Scoring and validation of a simple model for predicting diabetic retinopathy in patients with type 2 diabetes based on a meta-analysis approach of 21 cohorts.Ann Med. 2024 Dec;56(1):2413920. doi: 10.1080/07853890.2024.2413920. Epub 2024 Oct 11. Ann Med. 2024. PMID: 39392052 Free PMC article.
-
Prediction of Intracranial Infection in Patients under External Ventricular Drainage and Neurological Intensive Care: A Multicenter Retrospective Cohort Study.J Clin Med. 2022 Jul 8;11(14):3973. doi: 10.3390/jcm11143973. J Clin Med. 2022. PMID: 35887741 Free PMC article.
-
Using Machine Learning Techniques to Develop Risk Prediction Models for the Risk of Incident Diabetic Retinopathy Among Patients With Type 2 Diabetes Mellitus: A Cohort Study.Front Endocrinol (Lausanne). 2022 May 17;13:876559. doi: 10.3389/fendo.2022.876559. eCollection 2022. Front Endocrinol (Lausanne). 2022. PMID: 35655800 Free PMC article.
-
Nomogram-Based Prediction of the Futile Recanalization Risk Among Acute Ischemic Stroke Patients Before and After Endovascular Therapy: A Retrospective Study.Neuropsychiatr Dis Treat. 2023 Apr 13;19:879-894. doi: 10.2147/NDT.S400463. eCollection 2023. Neuropsychiatr Dis Treat. 2023. PMID: 37077709 Free PMC article.
-
Prediction Model and Decision Analysis for Early Recognition of SDNS/FRNS in Children.J Inflamm Res. 2024 Dec 7;17:10585-10598. doi: 10.2147/JIR.S494530. eCollection 2024. J Inflamm Res. 2024. PMID: 39670155 Free PMC article.
References
-
- Saeedi P., Petersohn I., Salpea P., et al. Global and regional diabetes prevalence estimates for 2019 and projections for 2030 and 2045: Results from the International Diabetes Federation Diabetes Atlas, 9th edition. Diabetes Research and Clinical Practice. 2019;157, article 107843 doi: 10.1016/j.diabres.2019.107843. - DOI - PubMed
-
- International Diabetes Federation. IDF Diabetes Atlas. 4th. Brussels, Belgium: International Diabetes 287 Federation; 2009.
-
- International Diabetes Federation. IDF Diabetes Atlas. 5th. Brussels, Belgium: International Diabetes 289 Federation; 2011.
-
- International Diabetes Federation. IDF Diabetes Atlas. 6th. Brussels, Belgium: International Diabetes 291 Federation; 2013.
-
- International Diabetes Federation. IDF Diabetes Atlas. 7th. Brussels, Belgium: International Diabetes 293 Federation; 2015.
MeSH terms
Substances
LinkOut - more resources
Full Text Sources
Medical
