

This is a preprint.
One year of modeling and forecasting COVID-19 transmission to support policymakers in Connecticut
- PMID: 32587978
- PMCID: PMC7310630
- DOI: 10.1101/2020.06.12.20126391
One year of modeling and forecasting COVID-19 transmission to support policymakers in Connecticut
Update in
-
One year of modeling and forecasting COVID-19 transmission to support policymakers in Connecticut.Sci Rep. 2021 Oct 12;11(1):20271. doi: 10.1038/s41598-021-99590-5. Sci Rep. 2021. PMID: 34642405 Free PMC article.
Abstract
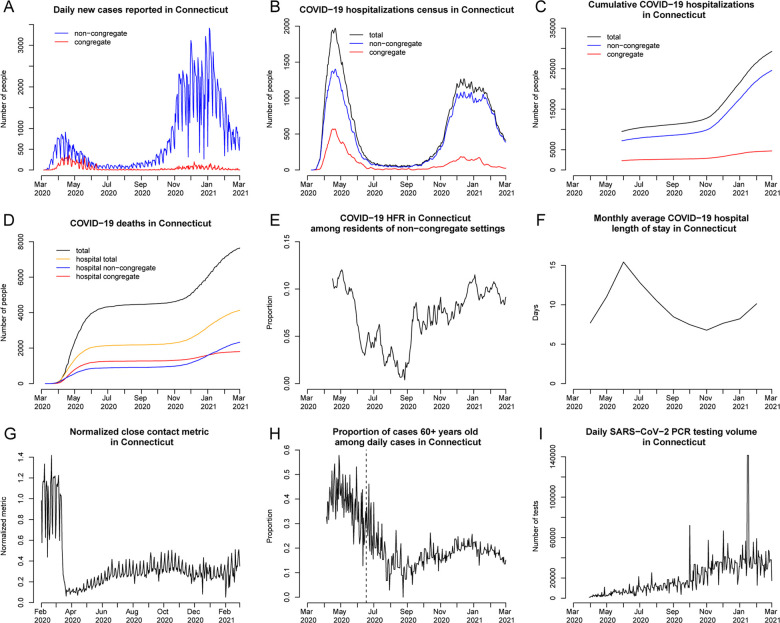
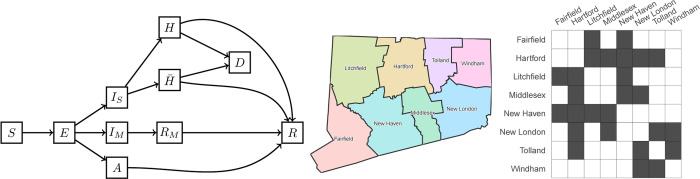
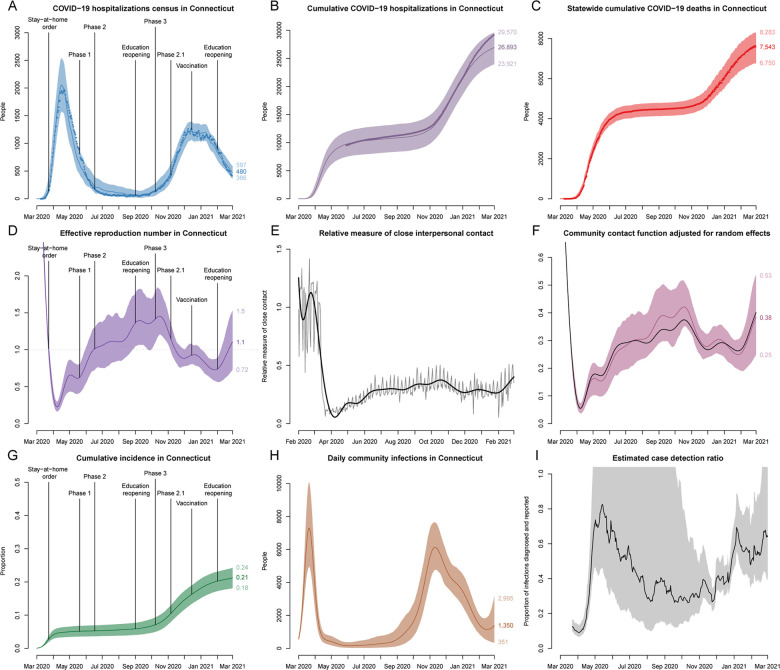
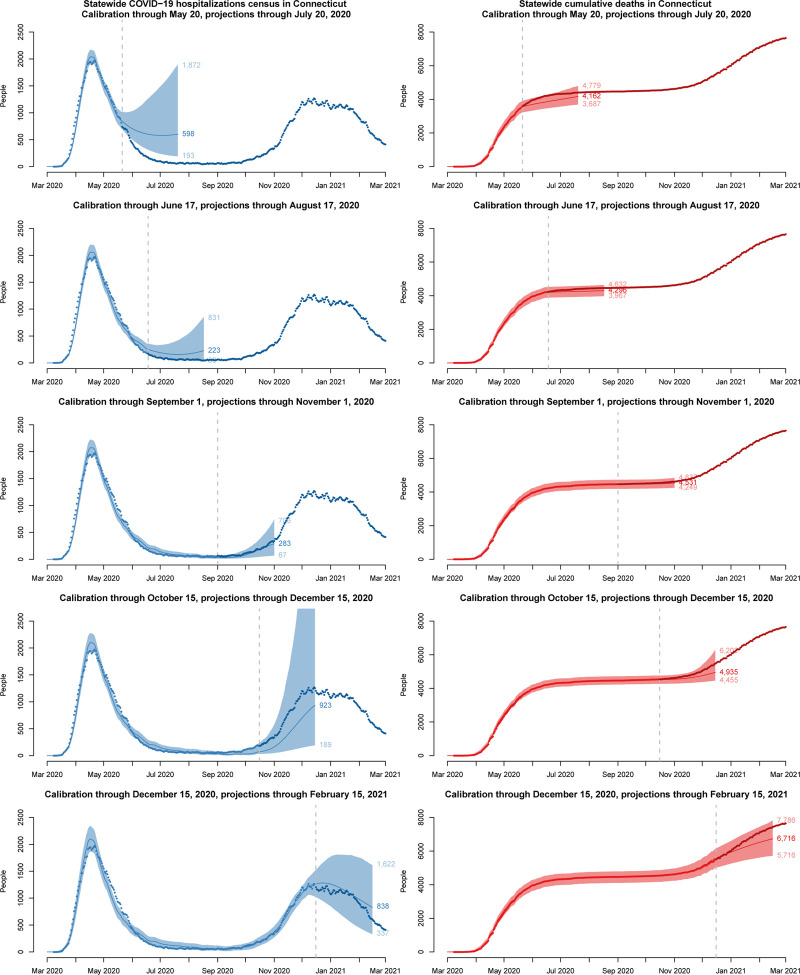
To support public health policymakers in Connecticut, we developed a county-structured compartmental SEIR-type model of SARS-CoV-2 transmission and COVID-19 disease progression. Our goals were to provide projections of infections, hospitalizations, and deaths, as well as estimates of important features of disease transmission, public behavior, healthcare response, and clinical progression of disease. In this paper, we describe a transmission model developed to meet the changing requirements of public health policymakers and officials in Connecticut from March 2020 to February 2021. We outline the model design, implementation and calibration, and describe how projections and estimates were used to support decision-making in Connecticut throughout the first year of the pandemic. We calibrated this model to data on deaths and hospitalizations, developed a novel measure of close interpersonal contact frequency to capture changes in transmission risk over time and used multiple local data sources to infer dynamics of time-varying model inputs. Estimated time-varying epidemiologic features of the COVID-19 epidemic in Connecticut include the effective reproduction number, cumulative incidence of infection, infection hospitalization and fatality ratios, and the case detection ratio. We describe methodology for producing projections of epidemic evolution under uncertain future scenarios, as well as analytical tools for estimating epidemic features that are difficult to measure directly, such as cumulative incidence and the effects of non-pharmaceutical interventions. The approach takes advantage of our unique access to Connecticut public health surveillance and hospital data and our direct connection to state officials and policymakers. We conclude with a discussion of the limitations inherent in predicting uncertain epidemic trajectories and lessons learned from one year of providing COVID-19 projections in Connecticut.
Keywords: SARS-CoV-2; SEIR epidemic model; case detection ratio; effective reproduction number; infection fatality ratio; infection hospitalization ratio; social distancing.
Conflict of interest statement
Competing interests: FWC is a paid consultant to Whitespace Solutions.
Figures
References
-
- Ferguson Neil M, Laydon Daniel, Nedjati-Gilani Gemma, Imai Natsuko, Ainslie Kylie, Baguelin Marc, Bhatia Sangeeta, Boonyasiri Adhiratha, Zulma Cucunubá Gina Cuomo-Dannenburg, Dighe Amy, Dorigatti Ilaria, Fu Han, Gaythorpe Katy, Green Will, Hamlet Arran, Hinsley Wes, Okell Lucy C, van Elsland Sabine, Thompson Hayley, Verity Robert, Volz Erik, Wang Haowei, Wang Yuanrong, Walker Patrick GT, Walters Caroline, Winskill Peter, Whittaker Charles, Donnelly Christl A, Riley Steven, Ghani Azra C, and Imperial College COVID-19 Response Team. Report 9: Impact of non-pharmaceutical interventions (NPIs) to reduce COVID-19 mortality and healthcare demand. 2020. doi: 10.25561/77482 URL https://www.imperial.ac.uk/media/imperial-college/medicine/sph/ide/gida-.... - DOI
-
- Adam David. Special report: The simulations driving the world’s response to COVID-19. Nature, 580(7803): 316, 2020. - PubMed
-
- Centers for Disease Control and Prevention. COVID-19 Mathematical Modeling. https://www.cdc.gov/coronavirus/2019-ncov/covid-data/mathematical-modeli..., Updated Aug. 7, 2020.
-
- Flaxman Seth, Mishra Swapnil, Gandy Axel, Juliette H Unwin T, Mellan Thomas A, Coupland Helen, Whittaker Charles, Zhu Harrison, Berah Tresnia, Eaton Jeffrey W, Monod Mélodie, Imperial College COVID-19 Response Team, Ghani Azra C., Donnelly Christl A., Riley Steven, Vollmer Michaela A. C., Ferguson Neil M., Okell Lucy C., and Bhatt Samir. Estimating the effects of non-pharmaceutical interventions on COVID-19 in Europe. Nature, 584(7820):257–261, 2020. doi: 10.1038/s41586-020-2405-7 - DOI - PubMed
Publication types
Grants and funding
LinkOut - more resources
Full Text Sources
Miscellaneous